***Last / Change / Volume data in this table is the closing quote data***
Symbol/Exchange
Company Name
Industry Group |
PRICE |
CHANGE
(%Change) |
Day High |
Volume
(% DAV)
(% 50 day avg vol) |
52 Wk Hi
% From Hi |
Featured
Date |
Price
Featured |
Pivot Featured |
|
Max Buy |
THO
-
NYSE
Thor Industries Inc
AUTOMOTIVE - Recreational Vehicles
|
$105.37
|
+1.18
1.13% |
$105.85
|
350,953
44.20% of 50 DAV
50 DAV is 794,000
|
$115.74
-8.96%
|
6/7/2017
|
$102.95
|
PP = $98.92
|
|
MB = $103.87
|
Most Recent Note - 7/20/2017 5:24:55 PM
G - Consolidating above its "max buy" level following its prior breakout from a"double bottom" base. Faces some resistance due to overhead supply up through the $115 level. See the latest FSU analysis for more details and a new annotated graph.
>>> FEATURED STOCK ARTICLE : Still Faces Some Resistance Due to Overhead Supply - 7/20/2017 |
View all notes |
Set NEW NOTE alert |
Company Profile |
SEC
News |
Chart |
Request a new note
C
A
S
I |
SBCF
-
NASDAQ
Seacoast Banking Corp Fl
BANKING - Regional - Mid-Atlantic Banks
|
$23.75
|
+0.32
1.37% |
$23.75
|
137,120
47.33% of 50 DAV
50 DAV is 289,700
|
$25.88
-8.23%
|
6/9/2017
|
$24.13
|
PP = $25.98
|
|
MB = $27.28
|
Most Recent Note - 7/20/2017 5:43:00 PM
Y - Still quietly consolidating near its 50 DMA line ($23.71). Subsequent losses below the recent low would trigger a more worrisome technical sell signal. Previously noted - "Subsequent volume-driven gains for new highs may trigger a new technical buy signal. "
>>> FEATURED STOCK ARTICLE : Florida Bank Perched -6.6% Off All-Time High - 7/6/2017 |
View all notes |
Set NEW NOTE alert |
Company Profile |
SEC
News |
Chart |
Request a new note
C
A
S
I |
BERY
-
NYSE
Berry Global Group Inc
CONSUMER NON-DURABLES - Packaging and Containers
|
$56.73
|
-0.46
-0.80% |
$57.37
|
737,108
81.81% of 50 DAV
50 DAV is 901,000
|
$58.95
-3.77%
|
7/14/2017
|
$57.67
|
PP = $59.05
|
|
MB = $62.00
|
Most Recent Note - 7/20/2017 5:30:08 PM
Y - Quietly fell today, slumping to a close just below its 50 DMA line ($57.48). Subsequent volume-driven gains above the pivot point may trigger a new (or add-on) technical buy signal. More damaging losses below the recent low ($56.14 on 7/06/17) would raise greater concerns and trigger a worrisome technical sell signal.
>>> FEATURED STOCK ARTICLE : Found Prompt Support at 50-Day Moving Average Line - 7/7/2017 |
View all notes |
Set NEW NOTE alert |
Company Profile |
SEC
News |
Chart |
Request a new note
C
A
S
I |
EW
-
NYSE
Edwards Lifesciences Cp
HEALTH SERVICES - Medical Appliances and Equipment
|
$117.14
|
-0.87
-0.74% |
$118.36
|
1,337,376
117.71% of 50 DAV
50 DAV is 1,136,200
|
$121.75
-3.79%
|
7/11/2017
|
$117.23
|
PP = $121.85
|
|
MB = $127.94
|
Most Recent Note - 7/19/2017 6:30:45 PM
Y - Posted a big gain today with above average volume, rallying from support at its 50 DMA line ($115.91). Color code was changed to yellow with new pivot point based on its 10/10/16 all-time high plus 10 cents. Subsequent volume-driven gains for new highs may trigger a new (or add-on) technical buy signal which could mark the beginning of a considerable new leg up. Volume totals have been mostly below average in recent weeks while holding its ground in a tight range.
>>> FEATURED STOCK ARTICLE : Medical Products Firm Perched Near All-Time High - 6/26/2017 |
View all notes |
Set NEW NOTE alert |
Company Profile |
SEC
News |
Chart |
Request a new note
C
A
S
I |
NTES
-
NASDAQ
Netease Inc Adr
INTERNET - Internet Information Providers
|
$311.50
|
+4.30
1.40% |
$313.79
|
669,518
49.93% of 50 DAV
50 DAV is 1,341,000
|
$337.55
-7.72%
|
6/8/2017
|
$310.76
|
PP = $307.62
|
|
MB = $323.00
|
Most Recent Note - 7/21/2017 5:32:56 PM
Y - Consolidating just above its 50 DMA line ($300.66) with volume totals cooling. Disciplined investors limit losses by selling any stock that falls more than -7% from their purchase price. Recent gains lacked great volume conviction. See the latest FSU analysis for more details and a new annotated graph.
>>> FEATURED STOCK ARTICLE : Found Recent Support at 50-Day Moving Average Line - 7/21/2017 |
View all notes |
Set NEW NOTE alert |
Company Profile |
SEC
News |
Chart |
Request a new note
C
A
S
I |
Symbol/Exchange
Company Name
Industry Group |
PRICE |
CHANGE
(%Change) |
Day High |
Volume
(% DAV)
(% 50 day avg vol) |
52 Wk Hi
% From Hi |
Featured
Date |
Price
Featured |
Pivot Featured |
|
Max Buy |
STMP
-
NASDAQ
Stamps.com Inc
INTERNET - Internet Software and Services
|
$151.60
|
+1.85
1.24% |
$152.55
|
277,375
53.65% of 50 DAV
50 DAV is 517,000
|
$156.40
-3.07%
|
5/24/2017
|
$133.10
|
PP = $136.10
|
|
MB = $142.91
|
 Most Recent Note - 7/24/2017 11:55:22 AM
G - Wedged higher above its "max buy" level with recent gains lacking volume conviction and its color code is changed to green. Prior low and its 50 DMA line define near-term support in the $140-141 area.
>>> FEATURED STOCK ARTICLE : Pulling Back After Getting Extended From Prior Base - 7/5/2017 |
View all notes |
Set NEW NOTE alert |
Company Profile |
SEC
News |
Chart |
Request a new note
C
A
S
I |
MELI
-
NASDAQ
Mercadolibre Inc
INTERNET - Internet Software and; Services
|
$282.38
|
+2.12
0.76% |
$283.26
|
435,222
64.77% of 50 DAV
50 DAV is 672,000
|
$297.95
-5.23%
|
6/15/2017
|
$261.73
|
PP = $297.95
|
|
MB = $312.85
|
Most Recent Note - 7/18/2017 4:14:48 PM
G - Recently rebounded above its 50 DMA line ($273) helping its outlook to improve. Faces resistance due to overhead supply up to the $298 level.
>>> FEATURED STOCK ARTICLE : Test of 10-Week Moving Average May Be a Secondary Buy Point - 6/15/2017 |
View all notes |
Set NEW NOTE alert |
Company Profile |
SEC
News |
Chart |
Request a new note
C
A
S
I |
HTHT
-
NASDAQ
China Lodging Group Ads
LEISURE - Lodging
|
$94.97
|
+1.46
1.56% |
$96.65
|
178,302
70.75% of 50 DAV
50 DAV is 252,000
|
$95.20
-0.24%
|
9/29/2016
|
$46.12
|
PP = $47.82
|
|
MB = $50.21
|
Most Recent Note - 7/24/2017 11:52:23 AM
G - Rallying into new all-time high territory with today's early gain. Its 50 DMA line ($80.97) defines near-term support above the prior low ($75.01 on 6/15/17). Sub par sales revenues growth was recently noted among concerns, however, earnings increases through the Mar '17 quarter have been strong versus the year-ago periods.
>>> FEATURED STOCK ARTICLE : China-Based Hotel Firm is Extended From Any Sound Base - 6/28/2017 |
View all notes |
Set NEW NOTE alert |
Company Profile |
SEC
News |
Chart |
Request a new note
C
A
S
I |
BEAT
-
NASDAQ
BioTelemetry Inc
Medical-Services
|
$34.90
|
+0.50
1.45% |
$34.95
|
381,090
84.13% of 50 DAV
50 DAV is 453,000
|
$35.60
-1.97%
|
2/14/2017
|
$25.10
|
PP = $24.55
|
|
MB = $25.78
|
Most Recent Note - 7/24/2017 12:04:11 PM
G - Quietly perched near its all-time high. Due to report Jun '17 quarterly earnings on 7/31/17. Volume and volatility often increase near earnings news. Its 50 DMA line ($30.57) and prior lows in the $26.50 - $27.00 area define near-term support. Bullish action continued after sub par Mar '17 earnings were repeatedly noted.
>>> FEATURED STOCK ARTICLE : New Highs on Twice Average Volume; Fundamental Concerns Remain - 7/14/2017 |
View all notes |
Set NEW NOTE alert |
Company Profile |
SEC
News |
Chart |
Request a new note
C
A
S
I |
ESNT
-
NYSE
Essent Group Ltd
Finance-MrtgandRel Svc
|
$38.09
|
-0.58
-1.50% |
$38.99
|
381,361
87.27% of 50 DAV
50 DAV is 437,000
|
$39.61
-3.84%
|
7/3/2017
|
$38.05
|
PP = $39.60
|
|
MB = $41.58
|
Most Recent Note - 7/20/2017 5:44:24 PM
Y - Quietly perched near its all-time high. Subsequent gains above the pivot point backed by at least +40% above average volume may trigger a new (or add-on) technical buy signal. Losses below the 50 DMA line ($37.02) and prior low ($34.08 on 5/05/17) would raise concerns and trigger technical sell signals.
>>> FEATURED STOCK ARTICLE : Sputtering Below its 50-Day Moving Average - 6/20/2017 |
View all notes |
Set NEW NOTE alert |
Company Profile |
SEC
News |
Chart |
Request a new note
C
A
S
I |
Symbol/Exchange
Company Name
Industry Group |
PRICE |
CHANGE
(%Change) |
Day High |
Volume
(% DAV)
(% 50 day avg vol) |
52 Wk Hi
% From Hi |
Featured
Date |
Price
Featured |
Pivot Featured |
|
Max Buy |
MTSI
-
NASDAQ
Macom Tech Solution Hldg
Elec-Semiconductor Mfg
|
$63.67
|
+0.65
1.03% |
$64.20
|
426,460
50.05% of 50 DAV
50 DAV is 852,000
|
$63.46
0.33%
|
5/16/2017
|
$52.52
|
PP = $53.89
|
|
MB = $56.58
|
Most Recent Note - 7/24/2017 2:50:12 PM
G - Gains have lacked great volume conviction while it hit another new all-time high with today's 4th consecutive gain. Did not form a sound base. Found support near its 50 DMA line ($58.02) during its latest consolidation.
>>> FEATURED STOCK ARTICLE : Meeting Resistance Near Prior High - 6/27/2017 |
View all notes |
Set NEW NOTE alert |
Company Profile |
SEC
News |
Chart |
Request a new note
C
A
S
I |
VEEV
-
NYSE
Veeva Systems Inc Cl A
Computer Sftwr-Medical
|
$65.79
|
+2.62
4.15% |
$66.09
|
1,484,330
82.46% of 50 DAV
50 DAV is 1,800,000
|
$68.07
-3.35%
|
7/24/2017
|
$65.91
|
PP = $68.17
|
|
MB = $71.58
|
Most Recent Note - 7/24/2017 2:41:25 PM
Y - Color code is changed to yellow with a new pivot point cited based on its 6/06/17 high plus 10 cents. Subsequent volume-driven gains for a new 52-week high may trigger a new (or add-on) technical buy signal. Found support at its 50 DMA line ($62.14) in recent weeks.
>>> FEATURED STOCK ARTICLE : Rebounding Since Testing Support at 50-Day Moving Average Line - 6/23/2017 |
View all notes |
Set NEW NOTE alert |
Company Profile |
SEC
News |
Chart |
Request a new note
C
A
S
I |
ANET
-
NYSE
Arista Networks Inc
TELECOMMUNICATIONS - Communication Equipment
|
$155.22
|
+2.30
1.50% |
$156.18
|
499,553
64.21% of 50 DAV
50 DAV is 778,000
|
$162.97
-4.76%
|
4/17/2017
|
$132.75
|
PP = $135.27
|
|
MB = $142.03
|
Most Recent Note - 7/21/2017 12:08:13 PM
G - Gapped down today undercutting its 50 DMA line ($151.11) then rebounding from early lows. It is extended from any sound base. Prior lows in the $144-143 area define the next important support to watch.
>>> FEATURED STOCK ARTICLE : Networking Firm Consolidating Above 50-Day Moving Average Line - 7/18/2017 |
View all notes |
Set NEW NOTE alert |
Company Profile |
SEC
News |
Chart |
Request a new note
C
A
S
I |
GRUB
-
NYSE
Grubhub Inc
COMPUTER SOFTWARE and SERVICES - Technical and System Software
|
$45.44
|
+0.19
0.42% |
$45.75
|
657,323
35.34% of 50 DAV
50 DAV is 1,860,000
|
$47.84
-5.02%
|
6/21/2017
|
$47.33
|
PP = $46.94
|
|
MB = $49.29
|
Most Recent Note - 7/18/2017 4:09:32 PM
Y - Volume totals have been cooling and stubbornly held its ground since gapping up above its 50 DMA line ($44.22) on 7/12/17 helping its outlook improve. Endured distributional pressure recently after it briefly rose above the new pivot point cited based on its 5/08/17 high plus 10 cents. Members were previously reminded - "A confirming gain backed by at least +40% above average volume and strong close above the pivot point may clinch a technical buy signal."
>>> FEATURED STOCK ARTICLE : Found Prompt Support at 50-Day Moving Average - 6/30/2017 |
View all notes |
Set NEW NOTE alert |
Company Profile |
SEC
News |
Chart |
Request a new note
C
A
S
I |
IBP
-
NYSE
Installed Building Prod
DIVERSIFIED SERVICES - Business/Management Services
|
$51.05
|
-0.10
-0.20% |
$51.45
|
62,198
46.42% of 50 DAV
50 DAV is 134,000
|
$55.45
-7.94%
|
6/13/2017
|
$54.25
|
PP = $55.55
|
|
MB = $58.33
|
Most Recent Note - 7/24/2017 12:08:38 PM
Y - Consolidating in a tight range near its 50 DMA line ($51.44). Volume-driven gains above the pivot point are still needed to trigger a proper new technical buy signal.
>>> FEATURED STOCK ARTICLE : Volume Cooling While Staying Above 50-Day Moving Average Line - 7/17/2017 |
View all notes |
Set NEW NOTE alert |
Company Profile |
SEC
News |
Chart |
Request a new note
C
A
S
I |
Symbol/Exchange
Company Name
Industry Group |
PRICE |
CHANGE
(%Change) |
Day High |
Volume
(% DAV)
(% 50 day avg vol) |
52 Wk Hi
% From Hi |
Featured
Date |
Price
Featured |
Pivot Featured |
|
Max Buy |
NCOM
-
NASDAQ
National Commerce Corp
BANKING - Regional - Southeast Banks
|
$40.05
|
+0.65
1.65% |
$40.20
|
14,582
47.04% of 50 DAV
50 DAV is 31,000
|
$41.25
-2.91%
|
4/25/2017
|
$38.95
|
PP = $40.09
|
|
MB = $42.09
|
Most Recent Note - 7/24/2017 2:46:56 PM
Y - Due to report Jun '17 earnings news after the market closes on Tuesday, July 25, 2017, and volume and volatility often increase near earnings news. Found support at its 50 DMA line ($38.90) recently and any damaging losses violating it or the recent lows would trigger technical sell signals.
>>> FEATURED STOCK ARTICLE : Recent Breakout Lacked Great Volume Conviction - 7/10/2017 |
View all notes |
Set NEW NOTE alert |
Company Profile |
SEC
News |
Chart |
Request a new note
C
A
S
I |
INGN
-
NASDAQ
Inogen Inc
HEALTH SERVICES - Medical Instruments and Supplies
|
$95.96
|
+0.74
0.78% |
$96.84
|
85,538
46.74% of 50 DAV
50 DAV is 183,000
|
$97.71
-1.79%
|
7/12/2017
|
$94.95
|
PP = $97.81
|
|
MB = $102.70
|
Most Recent Note - 7/24/2017 2:56:10 PM
Y - Color code was changed to yellow with new pivot point cited based on its 6/22/17 high as it formed an advanced "3-weeks tight" base. Subsequent volume-driven gains for new highs may trigger a new (or add-on) technical buy signal. Near-term support is its 50 DMA line ($91.35).
>>> FEATURED STOCK ARTICLE : In Tight Range Near All-Time High With Volume Totals Cooling - 7/12/2017 |
View all notes |
Set NEW NOTE alert |
Company Profile |
SEC
News |
Chart |
Request a new note
C
A
S
I |
HQY
-
NASDAQ
Healthequity Inc
COMPUTER SOFTWARE and SERVICES - Healthcare Information Service
|
$48.71
|
+1.33
2.81% |
$48.74
|
364,266
70.05% of 50 DAV
50 DAV is 520,000
|
$54.95
-11.36%
|
6/7/2017
|
$50.01
|
PP = $49.35
|
|
MB = $51.82
|
Most Recent Note - 7/19/2017 6:27:11 PM
G - Color code is changed to green after a loss today with higher volume undercut prior lows and violated its 50 DMA line ($48.82) triggering technical sell signals. Only a prompt rebound above the 50 DMA line would help its outlook improve. See the latest FSU analysis for more details and a new annotated graph.
>>> FEATURED STOCK ARTICLE : 50-Day Moving Average Violation Triggers Technical Sell Signal - 7/19/2017 |
View all notes |
Set NEW NOTE alert |
Company Profile |
SEC
News |
Chart |
Request a new note
C
A
S
I |
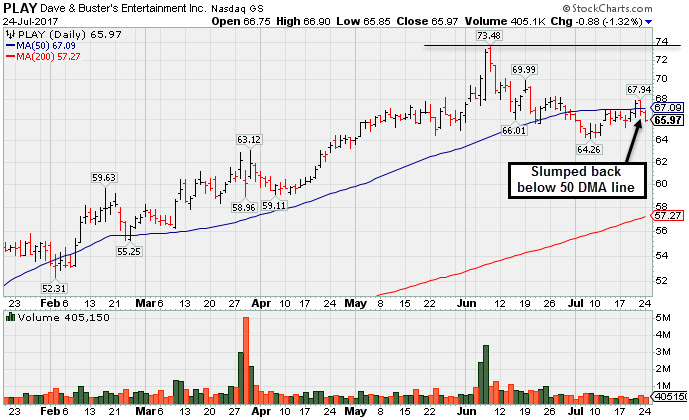
PLAY
-
NASDAQ
Dave & Buster's Ent Inc
Retail-Restaurants
|
$65.97
|
-0.88
-1.32% |
$66.90
|
405,150
59.58% of 50 DAV
50 DAV is 680,000
|
$73.48
-10.22%
|
2/23/2017
|
$55.41
|
PP = $58.35
|
|
MB = $61.27
|
Most Recent Note - 7/24/2017 5:08:34 PM
G - Sputtered back below its 50-day moving average (DMA) line ($67.09) raising concerns. It faces near-term resistance due to overhead supply up through the $73 level. Prior lows in the $64 area define important near-term support to watch where more damaging losses would trigger a worrisome technical sell signal. See the latest FSU analysis for more details and a new annotated graph.
>>> FEATURED STOCK ARTICLE : fsu - 7/24/2017 |
View all notes |
Set NEW NOTE alert |
Company Profile |
SEC
News |
Chart |
Request a new note
C
A
S
I |
OLLI
-
NASDAQ
Ollie's Bargain Outlet
Retail-DiscountandVariety
|
$43.75
|
-0.10
-0.23% |
$44.05
|
391,153
52.15% of 50 DAV
50 DAV is 750,000
|
$44.68
-2.07%
|
7/17/2017
|
$43.96
|
PP = $44.18
|
|
MB = $46.39
|
Most Recent Note - 7/19/2017 6:29:09 PM
Y - Pulled back today after recent gains lacking volume conviction. A new pivot point was cited based on its 6/02/17 high plus 10 cents. Subsequent gains and a strong close above the pivot point backed by at least +40% above average volume may trigger a new (or add-on) technical buy signal. Its 50 DMA line ($41.42) defines support above recent lows in the $37-38 area.
>>> FEATURED STOCK ARTICLE : Recently Found Support Near 50-Day Moving Average - 6/29/2017 |
View all notes |
Set NEW NOTE alert |
Company Profile |
SEC
News |
Chart |
Request a new note
C
A
S
I |
Symbol/Exchange
Company Name
Industry Group |
PRICE |
CHANGE
(%Change) |
Day High |
Volume
(% DAV)
(% 50 day avg vol) |
52 Wk Hi
% From Hi |
Featured
Date |
Price
Featured |
Pivot Featured |
|
Max Buy |
LITE
-
NASDAQ
Lumentum Holdings Inc
TELECOMMUNICATIONS - Cables / Satalite Equipment
|
$67.95
|
+4.60
7.26% |
$68.05
|
3,763,559
230.61% of 50 DAV
50 DAV is 1,632,000
|
$67.30
0.97%
|
7/13/2017
|
$64.15
|
PP = $67.40
|
|
MB = $70.77
|
Most Recent Note - 7/24/2017 2:36:53 PM
Y - Poised for a best-ever close with a big gain today with higher volume while approaching its pivot point. Its 50 DMA line ($59.85) and prior low ($56.20 on 6/29/17) define near-term support to watch. Gains above the pivot point backed by more than +40% above average volume may trigger a new (or add-on) technical buy signal.
>>> FEATURED STOCK ARTICLE : High Ranked Telecom - Fiber Optics Firm - 7/13/2017 |
View all notes |
Set NEW NOTE alert |
Company Profile |
SEC
News |
Chart |
Request a new note
C
A
S
I |
MOMO
-
NASDAQ
Momo Inc Ads Cl A
INTERNET - Content
|
$43.99
|
+1.82
4.32% |
$44.75
|
6,597,964
94.43% of 50 DAV
50 DAV is 6,987,000
|
$45.95
-4.27%
|
3/7/2017
|
$29.71
|
PP = $27.83
|
|
MB = $29.22
|
Most Recent Note - 7/24/2017 11:49:22 AM
G - Nearly challenged its prior high ($45.95 on 5/22/17) with today's early gain after gapping up. Consolidating above its 50 DMA line, building on a third-stage base. Prior low ($35.02 on 6/15/17) defines the next important chart support level where a violation would raise more serious concerns.
>>> FEATURED STOCK ARTICLE : Sputtering Below 50-Day Moving Average Line - 6/14/2017 |
View all notes |
Set NEW NOTE alert |
Company Profile |
SEC
News |
Chart |
Request a new note
C
A
S
I |
HLI
-
NYSE
Houlihan Lokey Inc Cl A
Finance-Invest Bnk/Bkrs
|
$36.74
|
-0.04
-0.11% |
$37.32
|
157,434
94.84% of 50 DAV
50 DAV is 166,000
|
$37.25
-1.37%
|
5/10/2017
|
$35.85
|
PP = $35.05
|
|
MB = $36.80
|
Most Recent Note - 7/18/2017 4:11:18 PM
Y - Perched near its "max buy" level, stubbornly holding its ground. Its 50 DMA line ($34.73) defines important near-term support to watch.
>>> FEATURED STOCK ARTICLE : Gapped Up and Nearly Challenged Prior High - 6/19/2017 |
View all notes |
Set NEW NOTE alert |
Company Profile |
SEC
News |
Chart |
Request a new note
C
A
S
I |