You are not logged in.
This means you
CAN ONLY VIEW reports that were published prior to Thursday, March 20, 2025.
You
MUST UPGRADE YOUR MEMBERSHIP if you want to see any current reports.
AFTER MARKET UPDATE - FRIDAY, JULY 16TH, 2021
Previous After Market Report Next After Market Report >>>
|
|
|
|
DOW |
-299.17 |
34,687.85 |
-0.86% |
|
Volume |
961,005,558 |
+12% |
|
Volume |
4,023,126,300 |
-10% |
|
NASDAQ |
-117.49 |
14,425.65 |
-0.81% |
|
Advancers |
957 |
29% |
|
Advancers |
1,322 |
31% |
|
S&P 500 |
-32.87 |
4,327.16 |
-0.75% |
|
Decliners |
2,306 |
71% |
|
Decliners |
2,912 |
69% |
|
Russell 2000 |
-27.06 |
2,163.24 |
-1.24% |
|
52 Wk Highs |
109 |
|
|
52 Wk Highs |
70 |
|
|
S&P 600 |
-18.67 |
1,297.56 |
-1.42% |
|
52 Wk Lows |
41 |
|
|
52 Wk Lows |
122 |
|
|
 |
Major Indices Slumped From Record Highs
Kenneth J. Gruneisen - Passed the CAN SLIM® Master's Exam
The Dow fell 299 points after opening at a fresh record high, pulling the blue chip index into negative territory for the week (-0.5%). The S&P 500 and the Nasdaq Composite each shed 0.8%, bringing their weekly declines to 1% and 1.9%, respectively. The small-cap Russell 2000 slumped over 5% on the week, its worst five-day stretch since October. The volume totals reported were mixed, higher than the prior session on the NYSE and lighter on the Nasdaq exchange. Breadth was negative as decliners led advancers by more than a 2-1 margin on the NYSE and on the Nasdaq exchange. There were 22 high-ranked companies from the Leaders List that hit new 52-week highs and were listed on the BreakOuts Page, versus 16 on the prior session. New 52-week highs totals improved and outnumbered new 52-week lows on the NYSE, but new lows outnumbered new highs on the Nasdaq exchange for the 3rd consecutive session. The major indices (M criteria) are in an uptrend. Investors are reminded to always make buying and selling decisions on case-by-case basis under the strict criteria and rules of the fact-based investment system.
PICTURED: The Nasdaq Composite Index has pulled back from its record high with 4 consecutive losses.
U.S. stocks finished lower on Friday, snapping a three-week winning streak. The major averages erased early session gains stemming from a solid retail sales print as a disappointing consumer sentiment reading contributed to renewed concerns surrounding economic growth.
On the data front, retail sales unexpectedly increased 0.6% in June, rebounding from May’s downwardly revised 1.7% drop. Separately, a preliminary reading from the University of Michigan revealed consumer sentiment surprisingly deteriorated to a five-month low in July as survey respondents raised their near-term inflation expectations to the highest level since August 2008. Treasuries closed little changed, with the yield on the 10-year note down one basis point to 1.29%, notching its third straight weekly decline. In commodities, WTI crude ended flat at $71.64/barrel, capping its worst weekly performance since early April (-4%).
Seven of 11 S&P 500 sectors closed in negative territory, with only the traditionally defensive sectors advancing. Utilities jumped 1%, while tech-related mega-cap shares lagged. Intel (INTC -1.51%) fell on reports the company was exploring the possible acquisition of privately-held chipmaker GlobalFoundries. Meanwhile, Moderna (MRNA +10.30%) rallied on news the drugmaker would become a member of the S&P 500. Elsewhere, Cintas Corp (CTAS +4.62%) rose on the heels of upbeat analyst commentary. |
 Kenneth J. Gruneisen started out as a licensed stockbroker in August 1987, a couple of months prior to the historic stock market crash that took the Dow Jones Industrial Average down -22.6% in a single day. He has published daily fact-based fundamental and technical analysis on high-ranked stocks online for two decades. Through FACTBASEDINVESTING.COM, Kenneth provides educational articles, news, market commentary, and other information regarding proven investment systems that work in good times and bad.
Comments contained in the body of this report are technical opinions only and are not necessarily those of Gruneisen Growth Corp. The material herein has been obtained from sources believed to be reliable and accurate, however, its accuracy and completeness cannot be guaranteed. Our firm, employees, and customers may effect transactions, including transactions contrary to any recommendation herein, or have positions in the securities mentioned herein or options with respect thereto. Any recommendation contained in this report may not be suitable for all investors and it is not to be deemed an offer or solicitation on our part with respect to the purchase or sale of any securities. |
|
 |
Financial, Retail, Tech, and Commodity-Linked Groups All Lost Ground
Kenneth J. Gruneisen - Passed the CAN SLIM® Master's Exam
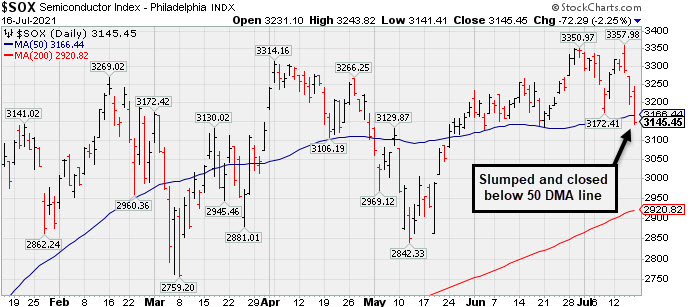
Losses for the Retail Index ($RLX -1.13%), Broker/Dealer Index ($XBD -1.05%), and Bank Index ($BKX -2.34%) weighed on the major averages. The tech sector was weak as the Semiconductor Index ($SOX -2.21%), Biotech Index ($BTK -1.12%), and Networking Index ($NWX -1.09%) suffered unanimous losses. Commodity-linked groups clearly had a negative bias as the Gold & Silver Index ($XAU -3.45%) outpaced the Oil Services Index ($OSX -2.79%) and Integrated Oil Index ($XOI -2.86%) to the downside.
PICTURED: The Semiconductor Index ($SOX -2.21%) slumped and closed below its 50-day moving average (DMA) line.
| Oil Services |
$OSX |
55.26 |
-1.59 |
-2.79% |
+24.66% |
| Integrated Oil |
$XOI |
1,010.33 |
-29.76 |
-2.86% |
+27.49% |
| Semiconductor |
$SOX |
3,146.52 |
-71.22 |
-2.21% |
+12.56% |
| Networking |
$NWX |
836.92 |
-9.22 |
-1.09% |
+16.71% |
| Broker/Dealer |
$XBD |
454.11 |
-4.84 |
-1.05% |
+20.26% |
| Retail |
$RLX |
4,083.72 |
-46.53 |
-1.13% |
+14.61% |
| Gold & Silver |
$XAU |
137.59 |
-4.91 |
-3.45% |
-4.58% |
| Bank |
$BKX |
121.43 |
-2.91 |
-2.34% |
+24.03% |
| Biotech |
$BTK |
5,658.75 |
-63.94 |
-1.12% |
-1.40% |
|
|
|
 |
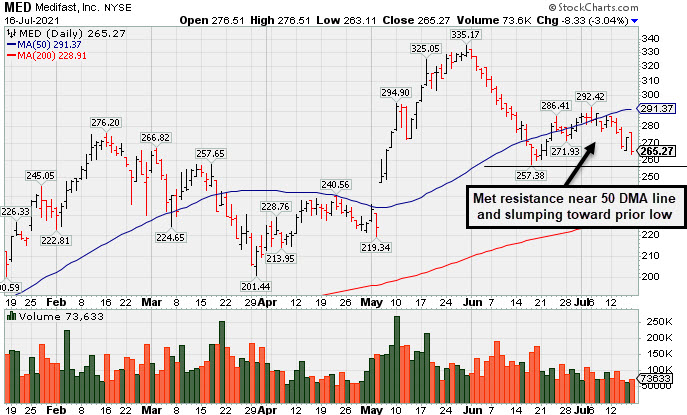
Slumping After 50 Day Moving Average Acted as Resistance
Kenneth J. Gruneisen - Passed the CAN SLIM® Master's Exam
Medifast Inc (MED -$8.33 or -3.04% to $265.27) slumped further below its 50-day moving average (DMA) line which acted as resistance in recent weeks. It will be dropped from the Featured Stocks list tonight. A rebound above its 50 DMA line is needed for its outlook to improve. More damaging losses below the prior low ($258.77 on 6/17/21) would raise greater concerns and trigger a worrisome technical sell signal.
Recently it reported Mar '21 quarterly earnings +79% on +91% sales revenues versus the year ago period, marking its 3rd consecutive quarterly comparison above the +25% minimum guideline (C criteria), helping it better match with winning models of the fact-based investment system. Annual earnings (A criteria) history has been strong.
The Cosmetics - Personal Care firm has only 11.8 million shares outstanding (S criteria) which can contribute to greater price volatility in the event of institutional buying or selling. The number of top-rated funds owning its shares rose from 425 in Jun '20 to 561 in Jun '21, a reassuring sign concerning the I criteria. Its current Up/Down Volume Ratio of 0.9 is an unbiased indication its shares have been under slight distributional pressure over the past 50 days. |
|
|
Color Codes Explained :
Y - Better candidates highlighted by our
staff of experts.
G - Previously featured
in past reports as yellow but may no longer be buyable under the
guidelines.
***Last / Change / Volume data in this table is the closing quote data***
Symbol/Exchange
Company Name
Industry Group |
PRICE |
CHANGE
(%Change) |
Day High |
Volume
(% DAV)
(% 50 day avg vol) |
52 Wk Hi
% From Hi |
Featured
Date |
Price
Featured |
Pivot Featured |
|
Max Buy |
 SIVB
-
NASDAQ
SIVB
-
NASDAQ
S V B Financial Group
BANKING - Regional - Pacific Banks
|
$561.76
|
-18.97
-3.27% |
$581.99
|
429,819
114.31% of 50 DAV
50 DAV is 376,000
|
$608.84
-7.73%
|
4/23/2021
|
$579.70
|
PP = $577.16
|
|
MB = $606.02
|
 Most Recent Note - 7/16/2021 5:02:07 PM
G - Slumped below its 50 DMA line ($569.88) with today's loss and its color code is changed to green. Only a prompt rebound would help its outlook improve.
>>> FEATURED STOCK ARTICLE : Consolidating Near 50-Day Average After Distributional Pressure - 6/25/2021 |
View all notes |
Set NEW NOTE alert |
Company Profile |
SEC
News |
Chart |
Request a new note
C
A
S
I |
LOGI
-
NASDAQ
Logitech Intl Sa
COMPUTER HARDWARE - Computer Peripherals
|
$117.91
|
-1.61
-1.35% |
$120.62
|
538,417
68.50% of 50 DAV
50 DAV is 786,000
|
$140.17
-15.88%
|
5/26/2021
|
$119.13
|
PP = $120.34
|
|
MB = $126.36
|
Most Recent Note - 7/16/2021 4:59:55 PM
G - Suffered 7 consecutive losses with below average volume. Sank below prior highs in the $120-117 area and its 50 DMA line ($121) triggering technical sell signals and its color code is changed to green. Only a prompt rebound above the 50 DMA line would help its outlook improve.
>>> FEATURED STOCK ARTICLE : Recent Pullback is Testing Important Technical Support - 7/2/2021 |
View all notes |
Set NEW NOTE alert |
Company Profile |
SEC
News |
Chart |
Request a new note
C
A
S
I |
CROX
-
NASDAQ
Crocs Inc
CONSUMER NON-DURABLES - Textile - Apparel Footwear
|
$112.26
|
-3.46
-2.99% |
$116.69
|
1,010,780
69.04% of 50 DAV
50 DAV is 1,464,000
|
$120.92
-7.16%
|
6/14/2021
|
$112.64
|
PP = $110.01
|
|
MB = $115.51
|
Most Recent Note - 7/14/2021 4:52:10 PM
G - There was a "negative reversal" today after touching a new all-time high above its "max buy" level. Its 50 DMA line ($107.57) defines important support to watch on pullbacks.
>>> FEATURED STOCK ARTICLE : Quietly Consolidating Below "Max Buy" Level - 7/7/2021 |
View all notes |
Set NEW NOTE alert |
Company Profile |
SEC
News |
Chart |
Request a new note
C
A
S
I |
CRL
-
NYSE
Charles River Labs Intl
DRUGS - Biotechnology
|
$384.49
|
+2.34
0.61% |
$384.93
|
228,997
33.43% of 50 DAV
50 DAV is 685,000
|
$386.57
-0.54%
|
6/9/2021
|
$345.91
|
PP = $349.23
|
|
MB = $366.69
|
Most Recent Note - 7/13/2021 5:26:46 PM
G - Volume totals have been cooling. Below average volume was behind recent gains as it wedged into record high territory. Prior highs in the $349 area and its 50 DMA line ($348) define near-term support to watch on pullbacks. Two of the past 3 quarterly comparisons through Mar '21 have been above the +25% minimum earnings guideline (C criteria). See the latest FSU analysis for more details and a new annotated graph.
>>> FEATURED STOCK ARTICLE : Volume Totals Cooling While Perched at High - 7/13/2021 |
View all notes |
Set NEW NOTE alert |
Company Profile |
SEC
News |
Chart |
Request a new note
C
A
S
I |
GNRC
-
NYSE
Generac Hldgs Inc
Electrical-Power/Equipmt
|
$430.34
|
-2.52
-0.58% |
$435.48
|
747,805
98.01% of 50 DAV
50 DAV is 763,000
|
$452.92
-4.99%
|
6/8/2021
|
$348.46
|
PP = $342.38
|
|
MB = $359.50
|
Most Recent Note - 7/14/2021 4:01:32 PM
G - Volume was lighter today as it pulled back from its all-time high. Very extended from the previously noted base. Prior high ($364) and its 50 DMA line ($356.67) defines support to watch on pullbacks. Fundamentals remain strong.
>>> FEATURED STOCK ARTICLE : Gain for New High Leaves GNRC Very Extended From Prior Base - 7/12/2021 |
View all notes |
Set NEW NOTE alert |
Company Profile |
SEC
News |
Chart |
Request a new note
C
A
S
I |
Symbol/Exchange
Company Name
Industry Group |
PRICE |
CHANGE
(%Change) |
Day High |
Volume
(% DAV)
(% 50 day avg vol) |
52 Wk Hi
% From Hi |
Featured
Date |
Price
Featured |
Pivot Featured |
|
Max Buy |
CAMT
-
NASDAQ
Camtek Ltd
ELECTRONICS - Scientific and Technical Instrum
|
$33.38
|
-1.36
-3.91% |
$35.56
|
242,356
82.15% of 50 DAV
50 DAV is 295,000
|
$40.47
-17.52%
|
4/28/2021
|
$35.03
|
PP = $35.34
|
|
MB = $37.11
|
Most Recent Note - 7/16/2021 4:56:11 PM
G - Color code is changed to green after today's big loss violated its 50 DMA line ($34.67) raising greater concerns and triggering a technical sell signal. Only a prompt rebound above the 50 DMA line would help its outlook improve.
>>> FEATURED STOCK ARTICLE : Loss With Light Volume Undercut 50-Day Moving Average - 7/8/2021 |
View all notes |
Set NEW NOTE alert |
Company Profile |
SEC
News |
Chart |
Request a new note
C
A
S
I |
ASML
-
NASDAQ
A S M L Holding N.V. NY
ELECTRONICS - Semiconductor Equipment and Mate
|
$687.42
|
-16.52
-2.35% |
$706.99
|
575,726
77.28% of 50 DAV
50 DAV is 745,000
|
$723.01
-4.92%
|
5/25/2021
|
$669.59
|
PP = $675.75
|
|
MB = $709.54
|
Most Recent Note - 7/14/2021 12:08:15 PM
Y - Gapped up today and hit a new all-time high. Recently tested its 50 DMA line ($672) which defines important near-term support. More damaging losses would raise concerns and trigger technical sell signals.
>>> FEATURED STOCK ARTICLE : Volume Higher While Pulling Back Toward 50-Day Moving Average - 7/1/2021 |
View all notes |
Set NEW NOTE alert |
Company Profile |
SEC
News |
Chart |
Request a new note
C
A
S
I |
MED
-
NYSE
Medifast Inc
SPECIALTY RETAIL - Specialty Retail, Other
|
$265.27
|
-8.33
-3.04% |
$276.51
|
73,633
61.36% of 50 DAV
50 DAV is 120,000
|
$336.99
-21.28%
|
5/11/2021
|
$285.72
|
PP = $279.56
|
|
MB = $293.54
|
Most Recent Note - 7/16/2021 4:51:43 PM
Slumped further below its 50 DMA line and it will be dropped from the Featured Stocks list tonight. A rebound above its 50 DMA line ($292) is needed for its outlook to improve. More damaging losses below the prior low ($258.77 on 6/17/21) would raise greater concerns and trigger a worrisome technical sell signal. See the latest FSU analysis for more details and a new annotated graph.
>>> FEATURED STOCK ARTICLE : Slumping After 50 Day Moving Average Acted as Resistance - 7/16/2021 |
View all notes |
Set NEW NOTE alert |
Company Profile |
SEC
News |
Chart |
Request a new note
C
A
S
I |
CLFD
-
NASDAQ
Clearfield Inc
TELECOMMUNICATIONS - Cables / Satalite Equipment
|
$33.85
|
-1.38
-3.92% |
$35.71
|
100,653
89.87% of 50 DAV
50 DAV is 112,000
|
$43.64
-22.43%
|
6/4/2021
|
$40.01
|
PP = $40.36
|
|
MB = $42.38
|
Most Recent Note - 7/16/2021 4:54:05 PM
Slumped further below its 50 DMA line with higher (near average) volume behind today's 5th consecutive loss. It will be dropped from the Featured Stocks list tonight. A rebound above the 50 DMA line is needed for its outlook to improve. Fundamentals remain strong.
>>> FEATURED STOCK ARTICLE : Consolidating Above 50-Day Moving Average Helped Outlook - 6/30/2021 |
View all notes |
Set NEW NOTE alert |
Company Profile |
SEC
News |
Chart |
Request a new note
C
A
S
I |
POOL
-
NASDAQ
Pool Corp
WHOLESALE - Basic Materials Wholesale
|
$458.89
|
-0.93
-0.20% |
$464.84
|
224,067
89.63% of 50 DAV
50 DAV is 250,000
|
$478.67
-4.13%
|
6/21/2021
|
$455.09
|
PP = $449.54
|
|
MB = $472.02
|
Most Recent Note - 7/12/2021 5:22:57 PM
G - Perched at its 52-week high and its color code is changed to green after getting extended from the latest base. Prior highs in the $449-444 range define initial support to watch above its 50 DMA line ($442) on pullbacks.
>>> FEATURED STOCK ARTICLE : Volume-Driven Breakout After Orderly Consolidation - 6/21/2021 |
View all notes |
Set NEW NOTE alert |
Company Profile |
SEC
News |
Chart |
Request a new note
C
A
S
I |
Symbol/Exchange
Company Name
Industry Group |
PRICE |
CHANGE
(%Change) |
Day High |
Volume
(% DAV)
(% 50 day avg vol) |
52 Wk Hi
% From Hi |
Featured
Date |
Price
Featured |
Pivot Featured |
|
Max Buy |
FSBW
-
NASDAQ
F S Bancorp
Banks-West/Southwest
|
$35.21
|
-0.63
-1.76% |
$35.81
|
19,505
62.92% of 50 DAV
50 DAV is 31,000
|
$36.85
-4.45%
|
5/18/2021
|
$70.16
|
PP = $73.72
|
|
MB = $77.41
|
Most Recent Note - 7/12/2021 12:47:52 PM
Y - Still perched within striking distance of the pivot point cited based on its 3/08/21 high plus 10 cents. Near its 50 DMA line ($70.14) it has found prompt support during its ongoing ascent. Subsequent gains above the pivot point backed by at least +40% above average volume are needed to trigger a technical buy signal.
>>> FEATURED STOCK ARTICLE : Still Consolidating With Close Striking Distance of All-Time High - 6/24/2021 |
View all notes |
Set NEW NOTE alert |
Company Profile |
SEC
News |
Chart |
Request a new note
C
A
S
I |
SMPL
-
NASDAQ
Simply Good Foods Co
Food-Confectionery
|
$36.72
|
+0.11
0.30% |
$37.32
|
294,968
52.96% of 50 DAV
50 DAV is 557,000
|
$38.50
-4.62%
|
12/28/2020
|
$30.40
|
PP = $31.44
|
|
MB = $33.01
|
Most Recent Note - 7/15/2021 4:49:29 PM
G - Pulled back today for a 4th consecutive small loss. Volume totals have been cooling after hitting a new all-time high on 7/01/21. Prior highs in the $35 area define near-term support to watch along with its 50 DMA line ($35.27). Reported May '21 quarterly earnings +65% on +32% sales revenues versus the year ago period, well above the +25% minimum earnings guideline (C criteria). See the latest FSU analysis for more details and a new annotated graph.
>>> FEATURED STOCK ARTICLE : Pulled Back from High With Small Losses on Light Volume - 7/15/2021 |
View all notes |
Set NEW NOTE alert |
Company Profile |
SEC
News |
Chart |
Request a new note
C
A
S
I |
SHOP
-
NYSE
Shopify Inc Cl A
Computer Sftwr-Enterprse
|
$1,442.63
|
+1.13
0.08% |
$1,463.81
|
957,714
67.54% of 50 DAV
50 DAV is 1,418,000
|
$1,587.74
-9.14%
|
7/2/2021
|
$1,468.00
|
PP = $1,552.23
|
|
MB = $1,629.84
|
Most Recent Note - 7/14/2021 3:52:26 PM
Y - Reversed into the red today after early gains and a "negative reversal" was noted on 7/07/21 after hitting a new high. A new pivot point was recently cited based on its 6/21/21 high while building on a cup-with-high-handle base. Confirming gains with at least +40% above average volume for new highs would trigger a new (or add-on) technical buy signal and be a reassuring sign of fresh institutional buying demand.
>>> FEATURED STOCK ARTICLE : Rebounding After Choppy 4-Month Consolidation - 6/16/2021 |
View all notes |
Set NEW NOTE alert |
Company Profile |
SEC
News |
Chart |
Request a new note
C
A
S
I |
YETI
-
NYSE
Yeti Holdings Inc
Leisure-Products
|
$87.57
|
-2.62
-2.90% |
$91.50
|
610,740
42.24% of 50 DAV
50 DAV is 1,446,000
|
$96.62
-9.37%
|
5/13/2021
|
$84.20
|
PP = $90.65
|
|
MB = $95.18
|
Most Recent Note - 7/16/2021 5:05:26 PM
G - Color code is changed to green after today's 4th consecutive loss violated its 50 DMA line ($89.48) raising concerns. Only a prompt rebound would help its outlook improve. The prior low ($85.08 on 6/18/21) defines the next important support level to watch. Fundamentals remain strong.
>>> FEATURED STOCK ARTICLE : Volume Totals Cooling While Consolidating Near High - 7/9/2021 |
View all notes |
Set NEW NOTE alert |
Company Profile |
SEC
News |
Chart |
Request a new note
C
A
S
I |
DOCU
-
NASDAQ
Docusign Inc
Computer Sftwr-Enterprse
|
$282.05
|
+5.04
1.82% |
$283.59
|
1,901,188
60.74% of 50 DAV
50 DAV is 3,129,800
|
$298.75
-5.59%
|
7/6/2021
|
$288.96
|
PP = $290.33
|
|
MB = $304.85
|
Most Recent Note - 7/14/2021 3:59:10 PM
Y - Pulling back today for a 2nd consecutive loss with lighter volume after wedging into new high territory with gains in recent weeks lacking great volume conviction. Highlighted in yellow with pivot point cited based on its 9/02/20 high plus 10 cents. A gain and strong close above the pivot point cited backed by at least +40% above average volume may trigger a convincing new (or add-on) technical buy signal. Fundamentals remain strong after reporting very strong Apr '21 quarterly results.
>>> FEATURED STOCK ARTICLE : Touched New High With Average Volume Behind Today's Gain - 7/6/2021 |
View all notes |
Set NEW NOTE alert |
Company Profile |
SEC
News |
Chart |
Request a new note
C
A
S
I |
Symbol/Exchange
Company Name
Industry Group |
PRICE |
CHANGE
(%Change) |
Day High |
Volume
(% DAV)
(% 50 day avg vol) |
52 Wk Hi
% From Hi |
Featured
Date |
Price
Featured |
Pivot Featured |
|
Max Buy |
JEF
-
NYSE
Jefferies Financial Grp
Finance-Invest Bnk/Bkrs
|
$33.37
|
-0.60
-1.77% |
$34.47
|
2,122,304
97.09% of 50 DAV
50 DAV is 2,186,000
|
$35.69
-6.50%
|
6/28/2021
|
$31.81
|
PP = $34.42
|
|
MB = $36.14
|
Most Recent Note - 7/14/2021 12:15:35 PM
Y - Color code is changed to yellow after a gap up today and big volume-driven gain. Prompt rebound above the 50 DMA line ($32.06) helped its outlook improve. As previously noted - "Subsequent gains above the pivot point backed by at least +40% above average volume are necessary to trigger a technical buy signal."
>>> FEATURED STOCK ARTICLE : High-Ranked Financial Firm Formed "Double Bottom" Base - 6/28/2021 |
View all notes |
Set NEW NOTE alert |
Company Profile |
SEC
News |
Chart |
Request a new note
C
A
S
I |
CLAR
-
NASDAQ
Clarus Corporation
Leisure-Products
|
$27.56
|
-0.47
-1.68% |
$28.08
|
202,631
89.66% of 50 DAV
50 DAV is 226,000
|
$28.21
-2.30%
|
5/12/2021
|
$21.40
|
PP = $19.73
|
|
MB = $20.72
|
Most Recent Note - 7/12/2021 5:20:49 PM
G - Posted a big gain with below average volume and hit a new 52-week high today. It did not form a sound base of sufficient length. Its 50 DMA line ($23.46) defines important near-term support to watch.
>>> FEATURED STOCK ARTICLE : Encountering Distributional Pressure After Recent Rally - 6/17/2021 |
View all notes |
Set NEW NOTE alert |
Company Profile |
SEC
News |
Chart |
Request a new note
C
A
S
I |
AVTR
-
NYSE
Avantor Inc
Medical-Research Eqp/Svc
|
$36.35
|
+0.04
0.11% |
$36.52
|
2,289,896
58.75% of 50 DAV
50 DAV is 3,898,000
|
$36.52
-0.47%
|
6/10/2021
|
$32.94
|
PP = $34.09
|
|
MB = $35.79
|
Most Recent Note - 7/14/2021 4:32:50 PM
G - Stubbornly holding its ground but making little progress since triggering a technical buy signal. Prior highs in the $33 area coincide with its 50 DMA line defining important support to watch on pullbacks.
>>> FEATURED STOCK ARTICLE : Held Ground But Made Little Price Progress Since Featured - 7/14/2021 |
View all notes |
Set NEW NOTE alert |
Company Profile |
SEC
News |
Chart |
Request a new note
C
A
S
I |
|
|
|
THESE ARE NOT BUY RECOMMENDATIONS!
Comments contained in the body of this report are technical
opinions only. The material herein has been obtained
from sources believed to be reliable and accurate, however,
its accuracy and completeness cannot be guaranteed.
This site is not an investment advisor, hence it does
not endorse or recommend any securities or other investments.
Any recommendation contained in this report may not
be suitable for all investors and it is not to be deemed
an offer or solicitation on our part with respect to
the purchase or sale of any securities. All trademarks,
service marks and trade names appearing in this report
are the property of their respective owners, and are
likewise used for identification purposes only.
This report is a service available
only to active Paid Premium Members.
You may opt-out of receiving report notifications
at any time. Questions or comments may be submitted
by writing to Premium Membership Services 665 S.E. 10 Street, Suite 201 Deerfield Beach, FL 33441-5634 or by calling 1-800-965-8307
or 954-785-1121.
|
|
|