You are not logged in.
This means you
CAN ONLY VIEW reports that were published prior to Thursday, March 20, 2025.
You
MUST UPGRADE YOUR MEMBERSHIP if you want to see any current reports.
AFTER MARKET UPDATE - WEDNESDAY, JUNE 16TH, 2021
Previous After Market Report Next After Market Report >>>
|
|
|
|
DOW |
-265.66 |
34,033.67 |
-0.77% |
|
Volume |
1,061,184,799 |
+23% |
|
Volume |
4,616,513,300 |
+3% |
|
NASDAQ |
-36.01 |
14,036.85 |
-0.26% |
|
Advancers |
1,223 |
38% |
|
Advancers |
1,920 |
46% |
|
S&P 500 |
-22.89 |
4,223.70 |
-0.54% |
|
Decliners |
1,985 |
62% |
|
Decliners |
2,227 |
54% |
|
Russell 2000 |
-5.38 |
2,314.69 |
-0.23% |
|
52 Wk Highs |
185 |
|
|
52 Wk Highs |
133 |
|
|
S&P 600 |
-0.88 |
1,389.57 |
-0.06% |
|
52 Wk Lows |
22 |
|
|
52 Wk Lows |
37 |
|
|
 |
Major Indices Pulled Back With Higher Volume Totals
Kenneth J. Gruneisen - Passed the CAN SLIM® Master's Exam
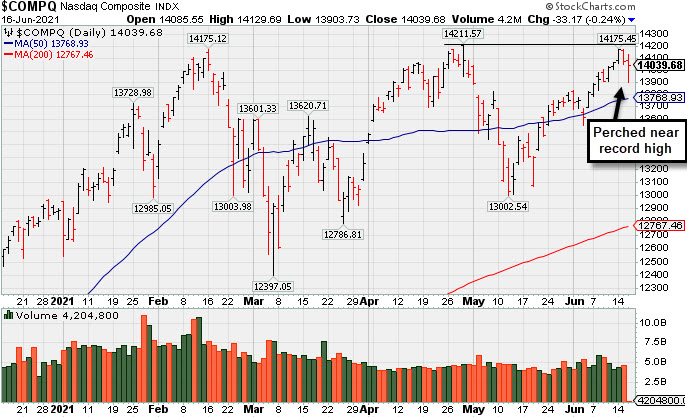
The Dow dropped 265 points, while the S&P 500 lost 0.5%, The Nasdaq Composite ended 0.2% lower. The volume totals reported were higher than the prior session on the NYSE and on the Nasdaq exchange. Breadth was negative as decliners led advancers by a 3-2 margin on the NYSE and by a narrower margin on the Nasdaq exchange. There were 37 high-ranked companies from the Leaders List that hit new 52-week highs and were listed on the BreakOuts Page, versus 36 on the prior session. New 52-week highs totals still solidly outnumbered new 52-week lows totals on the NYSE and on the Nasdaq exchange. The major indices (M criteria) are still in an uptrend, although that trend endured pressure in recent weeks. Investors are reminded to always make buying and selling decisions on case-by-case basis under the strict criteria and rules of the fact-based investment system.
PICTURED: The Nasdaq Composite Index is perched near its record high. Its 50-day moving average (DMA) line acted as support during the prior consolidation.
Committee members notably upgraded their inflation forecast, though the recent buildup in price pressures was described as largely stemming from transitory factors. U.S. equity benchmarks pared losses, however, as Fed Chair Jerome Powell’s post-meeting press conference helped assuage concerns of imminent monetary policy tightening.
Treasuries slumped, with the yield on the 10-year note climbing nine basis points to 1.58%. The yield on the more Fed-sensitive two-year note jumped four basis points to 0.20%, its highest level in a year. Elsewhere, the U.S. dollar rallied 0.8%, pressuring oil prices and gold. WTI crude erased earlier gains to finish down 0.3% at $71.88/barrel despite data showing a fourth consecutive weekly drawdown in domestic crude stockpiles.
Ten of 11 S&P 500 sectors closed in negative territory, with bond proxies Utilities and Consumer Staples among the worst performers. Consumer Discretionary shares bucked the downtrend. In earnings, Oracle (ORCL -5.60%) gapped down following weak current-quarter guidance.
On the data front, housing starts rebounded 3.6% in May from the prior downwardly revised 12.1% drop. Separately, building permits slipped 3% to a seven-month low during the same period. |
 Kenneth J. Gruneisen started out as a licensed stockbroker in August 1987, a couple of months prior to the historic stock market crash that took the Dow Jones Industrial Average down -22.6% in a single day. He has published daily fact-based fundamental and technical analysis on high-ranked stocks online for two decades. Through FACTBASEDINVESTING.COM, Kenneth provides educational articles, news, market commentary, and other information regarding proven investment systems that work in good times and bad.
Comments contained in the body of this report are technical opinions only and are not necessarily those of Gruneisen Growth Corp. The material herein has been obtained from sources believed to be reliable and accurate, however, its accuracy and completeness cannot be guaranteed. Our firm, employees, and customers may effect transactions, including transactions contrary to any recommendation herein, or have positions in the securities mentioned herein or options with respect thereto. Any recommendation contained in this report may not be suitable for all investors and it is not to be deemed an offer or solicitation on our part with respect to the purchase or sale of any securities. |
|
 |
Financial and Retail Indexes Rose
Kenneth J. Gruneisen - Passed the CAN SLIM® Master's Exam
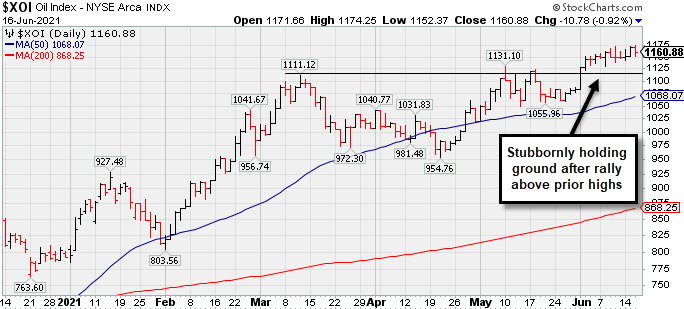
There were small gains for the Bank Index ($BKX +0.54%), Broker/Dealer Index ($XBD +0.10%), and the Retail Index ($RLX +0.24%). Meanwhile, the tech sector had a negative bias as the Semiconductor Index ($SOX -0.77%), Networking Index ($NWX -0.50%), and Biotech Index ($BTK -0.28%) each ended lower. The Oil Services Index ($OSX +0.05%) finished flat while the Integrated Oil Index ($XOI -0.92%) and Gold & Silver Index ($XAU -1.58%) both lost ground.
PICTURED: The Integrated Oil Index ($XOI -0.92%) is stubbornly holding its ground after rallying above prior highs.
| Oil Services |
$OSX |
68.16 |
+0.03 |
+0.05% |
+54.09% |
| Integrated Oil |
$XOI |
1,160.88 |
-10.78 |
-0.92% |
+46.49% |
| Semiconductor |
$SOX |
3,201.01 |
-24.97 |
-0.77% |
+14.51% |
| Networking |
$NWX |
857.75 |
-4.29 |
-0.50% |
+19.61% |
| Broker/Dealer |
$XBD |
474.04 |
+0.48 |
+0.10% |
+25.54% |
| Retail |
$RLX |
3,885.72 |
+9.28 |
+0.24% |
+9.05% |
| Gold & Silver |
$XAU |
154.16 |
-2.47 |
-1.58% |
+6.91% |
| Bank |
$BKX |
128.61 |
+0.69 |
+0.54% |
+31.36% |
| Biotech |
$BTK |
5,892.44 |
-16.40 |
-0.28% |
+2.67% |
|
|
|
 |
Rebounding After Choppy 4-Month Consolidation
Kenneth J. Gruneisen - Passed the CAN SLIM® Master's Exam
Shopify Inc Cl A (SHOP +$45.22 or +3.42% to $1,366.30) was highlighted in yellow with new pivot point cited based on its 2/10/21 high plus 10 cents in the earlier mid-day report (read here). Subsequent gains above the pivot point backed by at least +40% above average volume are needed to trigger a technical buy signal. It was last shown in the FSU section on 3/02/21 with an annotated graph under the headline, "Found Support Near Prior High and 50-Day Moving Average". It found support after dipping below its 200 DMA line during the choppy consolidation since dropped from the Featured Stocks list on 3/04/21. The recent rebound above the 50 DMA line helped its outlook improve, however its Relative Strength Rating of 76 remains below the 80+ minimum guideline for buy candidates.
SHOP reported Mar '21 quarterly earnings +958% on +110% sales revenues versus the year ago period, continuing its strong earnings track record. Prior quarters showed big earnings increases well above the +25% minimum guideline (C criteria) with very strong underlying sales revenues growth. After years of losses it had strong earnings growth in FY '17-19 (A criteria).
The Ontario, Canada-based Computer Software - Enterprise firm saw the number of top-rated funds owning its shares rise from 1,151 in Sep '19 to 1,967 in Dec '20, a reassuring sign concerning the I criteria. It has a B Timeliness rating and an A Sponsorship Rating. There are 116.1 million shares outstanding (S criteria) which can contribute to greater price volatility in the event of institutional buying or selling. |
|
|
Color Codes Explained :
Y - Better candidates highlighted by our
staff of experts.
G - Previously featured
in past reports as yellow but may no longer be buyable under the
guidelines.
***Last / Change / Volume data in this table is the closing quote data***
Symbol/Exchange
Company Name
Industry Group |
PRICE |
CHANGE
(%Change) |
Day High |
Volume
(% DAV)
(% 50 day avg vol) |
52 Wk Hi
% From Hi |
Featured
Date |
Price
Featured |
Pivot Featured |
|
Max Buy |
 ABCB
-
NASDAQ
ABCB
-
NASDAQ
Ameris Bancorp
BANKING - Regional - Mid-Atlantic Banks
|
$55.50
|
+0.65
1.19% |
$56.36
|
412,643
99.91% of 50 DAV
50 DAV is 413,000
|
$59.85
-7.27%
|
5/21/2021
|
$58.86
|
PP = $57.91
|
|
MB = $60.81
|
Most Recent Note - 6/15/2021 4:31:01 PM
Y - Found prompt support at its 50 DMA line ($54.10) with today's gain backed by light volume. Still sputtering below the previously cited pivot point. More damaging losses would raise greater concerns and trigger a worrisome technical sell signal.
>>> FEATURED STOCK ARTICLE : Breakout to New All-Time High for Another Regional Bank - 5/21/2021 |
View all notes |
Set NEW NOTE alert |
Company Profile |
SEC
News |
Chart |
Request a new note
C
A
S
I |
SIVB
-
NASDAQ
S V B Financial Group
BANKING - Regional - Pacific Banks
|
$567.06
|
+16.83
3.06% |
$569.17
|
551,542
135.18% of 50 DAV
50 DAV is 408,000
|
$608.84
-6.86%
|
4/23/2021
|
$579.70
|
PP = $577.16
|
|
MB = $606.02
|
Most Recent Note - 6/14/2021 12:23:18 PM
G - Undercutting its 50 DMA line ($556.17) with today's 4th consecutive loss raising concerns and its color code is changed to green. A prompt rebound above its 50 DMA line is needed for its outlook to improve. Confirming gains above the pivot point backed by at least +40% above average volume are still needed to help clinch a convincing technical buy signal. Reported earnings +293% on +64% sales revenues for the Mar '21 quarter versus the year ago period, its 3rd strong comparison. Completed a new Public Offering on 3/24/21.
>>> FEATURED STOCK ARTICLE : Sputtering Since Featured Without Confirming Gains - 5/20/2021 |
View all notes |
Set NEW NOTE alert |
Company Profile |
SEC
News |
Chart |
Request a new note
C
A
S
I |
LOGI
-
NASDAQ
Logitech Intl Sa
COMPUTER HARDWARE - Computer Peripherals
|
$128.07
|
-0.49
-0.38% |
$129.64
|
463,877
55.69% of 50 DAV
50 DAV is 833,000
|
$140.17
-8.63%
|
5/26/2021
|
$119.13
|
PP = $120.34
|
|
MB = $126.36
|
Most Recent Note - 6/11/2021 12:43:28 PM
G - Pulling back from its all-time high with today's 2nd consecutive gap down and loss on higher volume. It is extended from the previously noted base. Prior highs in the $120-117 area define support to watch on pullbacks along with its 50 DMA line ($115).
>>> FEATURED STOCK ARTICLE : Streak of Gains to New Highs Lacked Great Volume Conviction - 5/27/2021 |
View all notes |
Set NEW NOTE alert |
Company Profile |
SEC
News |
Chart |
Request a new note
C
A
S
I |
CROX
-
NASDAQ
Crocs Inc
CONSUMER NON-DURABLES - Textile - Apparel Footwear
|
$110.40
|
-0.17
-0.15% |
$111.96
|
1,108,599
63.60% of 50 DAV
50 DAV is 1,743,000
|
$115.37
-4.31%
|
6/14/2021
|
$112.64
|
PP = $110.01
|
|
MB = $115.51
|
Most Recent Note - 6/14/2021 12:00:48 PM
Y - Gapped up today for a new all-time high clearing a short 5-week base. Color code is changed to yellow with new pivot point cited based on its 5/10/21 high plus 10 cents. A gain and strong close above its pivot point backed by at least +40% above average volume may clinch a proper new (or add-on) technical buy signal. Its 50 DMA line ($95.64) defines initial support above prior highs in the $86 area.
>>> FEATURED STOCK ARTICLE : Encountered Distributional Pressure Late This Week - 5/28/2021 |
View all notes |
Set NEW NOTE alert |
Company Profile |
SEC
News |
Chart |
Request a new note
C
A
S
I |
RCKY
-
NASDAQ
Rocky Brands Inc
CONSUMER NON-DURABLES - Textile - Apparel Footwear
|
$54.42
|
-0.05
-0.09% |
$55.44
|
78,810
89.56% of 50 DAV
50 DAV is 88,000
|
$69.00
-21.13%
|
5/5/2021
|
$61.65
|
PP = $61.55
|
|
MB = $64.63
|
Most Recent Note - 6/14/2021 5:26:49 PM
G - Still sputtering below its 50 DMA line ($56.50). A rebound above that short-term average is needed for its outlook to improve. The prior low ($50.52 on 5/19/21) defines the next important support where any violation may trigger a more worrisome technical sell signal. Fundamentals remain strong.
>>> FEATURED STOCK ARTICLE : Still Sputtering After Slump Below 50-Day Moving Average - 6/7/2021 |
View all notes |
Set NEW NOTE alert |
Company Profile |
SEC
News |
Chart |
Request a new note
C
A
S
I |
Symbol/Exchange
Company Name
Industry Group |
PRICE |
CHANGE
(%Change) |
Day High |
Volume
(% DAV)
(% 50 day avg vol) |
52 Wk Hi
% From Hi |
Featured
Date |
Price
Featured |
Pivot Featured |
|
Max Buy |
CRL
-
NYSE
Charles River Labs Intl
DRUGS - Biotechnology
|
$352.92
|
-1.44
-0.41% |
$355.62
|
299,800
43.70% of 50 DAV
50 DAV is 686,000
|
$356.35
-0.96%
|
6/9/2021
|
$345.91
|
PP = $349.23
|
|
MB = $366.69
|
Most Recent Note - 6/15/2021 4:20:45 PM
Y - Posted recent gains with below average volume, wedging to new highs. Gains above the pivot point backed by at least +40% above average volume are needed to trigger a proper new (or add-on) technical buy signal. Its 50 DMA line ($329) defines near-term support to watch on pullbacks. Two of the past 3 quarterly comparisons through Mar '21 have been above the +25% minimum earnings guideline (C criteria).
>>> FEATURED STOCK ARTICLE : Building New Base After Strong Quarterly Earnings Report - 6/9/2021 |
View all notes |
Set NEW NOTE alert |
Company Profile |
SEC
News |
Chart |
Request a new note
C
A
S
I |
GNRC
-
NYSE
Generac Hldgs Inc
Electrical-Power/Equipmt
|
$369.70
|
+7.44
2.05% |
$377.01
|
1,320,108
206.27% of 50 DAV
50 DAV is 640,000
|
$364.00
1.57%
|
6/8/2021
|
$348.46
|
PP = $342.38
|
|
MB = $359.50
|
 Most Recent Note - 6/16/2021 12:47:43 PM
Y - Hitting new all-time highs with heavier volume behind today's 5th consecutive gain. Reported earnings +174% on +70% sales revenues for the Mar '21 quarter versus the year ago period, its 3rd strong quarterly comparison above the +25% minimum guideline (C criteria). Annual earnings (A criteria) growth has been strong and steady.
>>> FEATURED STOCK ARTICLE : Gap Up Gain With +118% Above Average Volume - 6/8/2021 |
View all notes |
Set NEW NOTE alert |
Company Profile |
SEC
News |
Chart |
Request a new note
C
A
S
I |
CAMT
-
NASDAQ
Camtek Ltd
ELECTRONICS - Scientific and Technical Instrum
|
$36.96
|
-0.22
-0.59% |
$37.34
|
257,804
82.37% of 50 DAV
50 DAV is 313,000
|
$40.47
-8.67%
|
4/28/2021
|
$35.03
|
PP = $35.34
|
|
MB = $37.11
|
Most Recent Note - 6/15/2021 4:07:47 PM
G - Pulling back from its 52-week high. Prior highs in the $35-36 area define initial support to watch above its 50 DMA line ($33.32).
>>> FEATURED STOCK ARTICLE : Perched at 52-Week High After 4th Consecutive Gain - 6/1/2021 |
View all notes |
Set NEW NOTE alert |
Company Profile |
SEC
News |
Chart |
Request a new note
C
A
S
I |
ASML
-
NASDAQ
A S M L Holding N.V. NY
ELECTRONICS - Semiconductor Equipment and Mate
|
$699.05
|
-2.73
-0.39% |
$709.97
|
585,735
69.15% of 50 DAV
50 DAV is 847,000
|
$710.97
-1.68%
|
5/25/2021
|
$669.59
|
PP = $675.75
|
|
MB = $709.54
|
Most Recent Note - 6/16/2021 5:01:41 PM
Y - Stubbornly holding its ground near its all time high with volume totals cooling. Highlighted in yellow with pivot point cited based on its 4/26/21 high plus 10 cents. Subsequent gain and a strong close above its pivot point backed by at least +40% above average volume is needed to trigger a proper technical buy signal. Its 50 DMA line ($655) defines important near-term support to watch. Reported Mar '21 quarterly earnings +264% on +90% sales revenues versus the year-ago period. The 4 latest quarterly comparisons were above the +25% minimum earnings guideline (C criteria). Annual earnings history included a small downturn in FY '19. Dutch Electronics - Semiconductor Equipment firm made an impressive rally from a deep slump in March.
>>> FEATURED STOCK ARTICLE : Perched Near All-Time High After Short Base Above 50-Day Average - 5/26/2021 |
View all notes |
Set NEW NOTE alert |
Company Profile |
SEC
News |
Chart |
Request a new note
C
A
S
I |
BRKS
-
NASDAQ
Brooks Automation
ELECTRONICS - Semiconductor Equipment and Mate
|
$96.56
|
-2.61
-2.63% |
$99.74
|
685,894
89.54% of 50 DAV
50 DAV is 766,000
|
$108.72
-11.18%
|
4/5/2021
|
$99.31
|
PP = $91.88
|
|
MB = $96.47
|
Most Recent Note - 6/15/2021 4:02:21 PM
G - Consolidating above its 50 DMA line ($97.52) which defines important near-term support. More damaging losses below the recent low ($86.12 on 5/12/21) would raise serious concerns.
>>> FEATURED STOCK ARTICLE : Consolidating Above 50-Day Moving Average Line and Prior High - 6/3/2021 |
View all notes |
Set NEW NOTE alert |
Company Profile |
SEC
News |
Chart |
Request a new note
C
A
S
I |
Symbol/Exchange
Company Name
Industry Group |
PRICE |
CHANGE
(%Change) |
Day High |
Volume
(% DAV)
(% 50 day avg vol) |
52 Wk Hi
% From Hi |
Featured
Date |
Price
Featured |
Pivot Featured |
|
Max Buy |
OPY
-
NYSE
Oppenheimer Holdings Inc
FINANCIAL SERVICES - Investment Brokerage - Regiona
|
$55.12
|
+0.15
0.27% |
$55.75
|
285,529
285.53% of 50 DAV
50 DAV is 100,000
|
$55.00
0.22%
|
6/7/2021
|
$48.74
|
PP = $52.55
|
|
MB = $55.18
|
Most Recent Note - 6/16/2021 12:56:48 PM
Y - Reversed into the red after early gains today. Powered into new high territory on the prior session with heavy volume behind a big gain, clearing the pivot point cited based on its 5/03/21 high plus 10 cents, triggering a new (or add-on) technical buy signal. Fundamentals remain strong.
>>> FEATURED STOCK ARTICLE : Extended From Any Sound Base After Decent Rally - 5/17/2021 |
View all notes |
Set NEW NOTE alert |
Company Profile |
SEC
News |
Chart |
Request a new note
C
A
S
I |
CRMT
-
NASDAQ
Americas Car-Mart Inc
SPECIALTY RETAIL - Auto Dealerships
|
$144.61
|
-2.14
-1.46% |
$147.00
|
41,461
84.27% of 50 DAV
50 DAV is 49,200
|
$177.45
-18.51%
|
5/25/2021
|
$159.80
|
PP = $165.10
|
|
MB = $173.36
|
Most Recent Note - 6/15/2021 4:23:30 PM
G - Failing to rebound after slumping below its 50 DMA line ($151.41) with volume-driven losses. Its Relative Strength Rating has slumped to 70, below the 80+ minimum guideline for buy candidates. More damaging losses below the prior low ($142) trigger a worrisome technical sell signal.
>>> FEATURED STOCK ARTICLE : Car Dealership Firm Challenging All-Time High - 5/25/2021 |
View all notes |
Set NEW NOTE alert |
Company Profile |
SEC
News |
Chart |
Request a new note
C
A
S
I |
MED
-
NYSE
Medifast Inc
SPECIALTY RETAIL - Specialty Retail, Other
|
$272.67
|
-9.51
-3.37% |
$282.84
|
95,310
82.16% of 50 DAV
50 DAV is 116,000
|
$336.99
-19.09%
|
5/11/2021
|
$285.72
|
PP = $279.56
|
|
MB = $293.54
|
Most Recent Note - 6/14/2021 5:18:20 PM
Y - Pulled back today for a 10th consecutive loss with near average volume. Color code is changed to yellow while testing the prior high in the $279 area which defines initial support to watch above its 50 DMA line ($271). More damaging losses would raise greater concerns.
>>> FEATURED STOCK ARTICLE : Halted 10-Session Losing Streak Near Prior High and 50 DMA - 6/15/2021 |
View all notes |
Set NEW NOTE alert |
Company Profile |
SEC
News |
Chart |
Request a new note
C
A
S
I |
CLFD
-
NASDAQ
Clearfield Inc
TELECOMMUNICATIONS - Cables / Satalite Equipment
|
$35.41
|
+0.54
1.55% |
$35.69
|
157,643
116.77% of 50 DAV
50 DAV is 135,000
|
$43.64
-18.86%
|
6/4/2021
|
$40.01
|
PP = $40.36
|
|
MB = $42.38
|
Most Recent Note - 6/15/2021 4:12:17 PM
G - Fell abruptly from its 52-week high, and color code is changed to green after violating its 50 DMA line ($35.56) with 2 damaging losses on above average volume. Only a prompt rebound above the 50 DMA line would help its outlook improve. Prior low defines the next important near-term support in the $33 area. Fundamentals remain strong after it reported Mar '21 quarterly earnings +440% on +45% sales revenues versus the year ago period, continuing its strong earnings track record.
>>> FEATURED STOCK ARTICLE : Stalled and Found Support Above 50-Day Moving Average - 5/24/2021 |
View all notes |
Set NEW NOTE alert |
Company Profile |
SEC
News |
Chart |
Request a new note
C
A
S
I |
FSBW
-
NASDAQ
F S Bancorp
Banks-West/Southwest
|
$70.41
|
+0.06
0.09% |
$71.24
|
17,191
143.26% of 50 DAV
50 DAV is 12,000
|
$73.62
-4.36%
|
5/18/2021
|
$70.16
|
PP = $73.72
|
|
MB = $77.41
|
Most Recent Note - 6/14/2021 5:14:27 PM
Y - This thinly-traded Bank is still perched within close striking distance of the pivot point cited based on its 3/08/21 high plus 10 cents. It has been consolidating above its 50 DMA line ($68.91) where it found prompt support during its ongoing ascent. Subsequent gains above the pivot point backed by at least +40% above average volume are needed to trigger a technical buy signal. Fundamentals remain strong.
>>> FEATURED STOCK ARTICLE : Thinly-Traded Bank Consolidating Above 50-Day Moving Average - 5/18/2021 |
View all notes |
Set NEW NOTE alert |
Company Profile |
SEC
News |
Chart |
Request a new note
C
A
S
I |
Symbol/Exchange
Company Name
Industry Group |
PRICE |
CHANGE
(%Change) |
Day High |
Volume
(% DAV)
(% 50 day avg vol) |
52 Wk Hi
% From Hi |
Featured
Date |
Price
Featured |
Pivot Featured |
|
Max Buy |
SMPL
-
NASDAQ
Simply Good Foods Co
Food-Confectionery
|
$35.73
|
+0.27
0.76% |
$36.96
|
869,016
174.15% of 50 DAV
50 DAV is 499,000
|
$36.15
-1.16%
|
12/28/2020
|
$30.40
|
PP = $31.44
|
|
MB = $33.01
|
Most Recent Note - 6/16/2021 1:09:51 PM
G - Rising into new high territory with ever-increasing volume behind today's 4th consecutive gain. Near-term support to watch is its 50 DMA line ($33.98) and the prior low ($31.09 on 5/18/21). Reported Feb '21 quarterly earnings +9% on +2% sales revenues versus the year ago period, below the +25% minimum earnings guideline (C criteria), raising fundamental concerns.
>>> FEATURED STOCK ARTICLE : Simply Wedging Into New High Territory - 6/14/2021 |
View all notes |
Set NEW NOTE alert |
Company Profile |
SEC
News |
Chart |
Request a new note
C
A
S
I |
QRVO
-
NASDAQ
"Qorvo, Inc"
ELECTRONICS - Semiconductor - Integrated Cir
|
$181.71
|
-0.20
-0.11% |
$184.09
|
995,749
90.57% of 50 DAV
50 DAV is 1,099,400
|
$201.68
-9.90%
|
4/1/2021
|
$190.48
|
PP = $191.92
|
|
MB = $201.52
|
Most Recent Note - 6/15/2021 4:28:58 PM
G - Sputtering below its 50 DMA line ($184) which has been acting as resistance. Its current Relative Strength Rating is 72, below the 80+ minimum for buy candidates.
>>> FEATURED STOCK ARTICLE : Rebound Above 50-Day Moving Average Helped Outlook - 6/2/2021 |
View all notes |
Set NEW NOTE alert |
Company Profile |
SEC
News |
Chart |
Request a new note
C
A
S
I |
SHOP
-
NYSE
Shopify Inc Cl A
Computer Sftwr-Enterprse
|
$1,366.30
|
+45.22
3.42% |
$1,377.00
|
2,306,184
181.16% of 50 DAV
50 DAV is 1,273,000
|
$1,499.75
-8.90%
|
6/16/2021
|
$1,343.80
|
PP = $1,499.85
|
|
MB = $1,574.84
|
Most Recent Note - 6/16/2021 4:57:07 PM
Y - Color code was changed to yellow with new pivot point cited based on its 2/10/21 high plus 10 cents. Subsequent gains above the pivot point backed by at least +40% above average volume are needed to trigger a technical buy signal. Found support after dipping below its 200 DMA line during the choppy consolidation since dropped from the Featured Stocks list on 3/04/21. Rebound above the 50 DMA line helped its outlook improve, however its Relative Strength Rating of 76 remains below the 80+ minimum guideline for buy candidates. Reported Mar '21 quarterly earnings +958% on +110% sales revenues versus the year ago period, continuing its strong earnings track record. See the latest FSU analysis for more details and a new annotated graph.
>>> FEATURED STOCK ARTICLE : Rebounding After Choppy 4-Month Consolidation - 6/16/2021 |
View all notes |
Set NEW NOTE alert |
Company Profile |
SEC
News |
Chart |
Request a new note
C
A
S
I |
YETI
-
NYSE
Yeti Holdings Inc
Leisure-Products
|
$90.22
|
-2.32
-2.51% |
$92.40
|
1,267,244
86.32% of 50 DAV
50 DAV is 1,468,000
|
$95.76
-5.79%
|
5/13/2021
|
$84.20
|
PP = $90.65
|
|
MB = $95.18
|
Most Recent Note - 6/15/2021 4:16:01 PM
Y - Volume totals have been cooling while hovering near its all-time high. Its 50 DMA line ($86.65) and prior highs in the $80 area define near-term support to watch on pullbacks. Reported Mar 21 quarterly earnings +245% on +42% sales revenues versus the year ago period, continuing its strong earnings track record.
>>> FEATURED STOCK ARTICLE : Hovering Near High After Finding Support at 50-Day Moving Average - 6/4/2021 |
View all notes |
Set NEW NOTE alert |
Company Profile |
SEC
News |
Chart |
Request a new note
C
A
S
I |
MRBK
-
NASDAQ
Meridian Corp
Banks-Northeast
|
$26.78
|
-0.32
-1.18% |
$27.35
|
33,095
122.57% of 50 DAV
50 DAV is 27,000
|
$29.18
-8.22%
|
5/18/2021
|
$25.58
|
PP = $28.06
|
|
MB = $29.46
|
Most Recent Note - 6/11/2021 5:38:07 PM
Y - Still consolidating in a tight range above its 50 DMA line ($26.20). Stalled since reaching a new 52-week high when featured on 5/18/21. Reported Mar '21 earnings +323% on +93% sales revenues versus the year ago period, continuing its strong earnings track record. Recent low ($24.01 on 4/21/21) defines important near-term support where any violation may trigger a worrisome technical sell signal. Its Relative Strength Rating is 78, below the 80 minimum guideline. See the latest FSU analysis for more details and a new annotated graph.
>>> FEATURED STOCK ARTICLE : Stalled Yet Found Support at 50-Day Moving Average Line - 6/11/2021 |
View all notes |
Set NEW NOTE alert |
Company Profile |
SEC
News |
Chart |
Request a new note
C
A
S
I |
Symbol/Exchange
Company Name
Industry Group |
PRICE |
CHANGE
(%Change) |
Day High |
Volume
(% DAV)
(% 50 day avg vol) |
52 Wk Hi
% From Hi |
Featured
Date |
Price
Featured |
Pivot Featured |
|
Max Buy |
CLAR
-
NASDAQ
Clarus Corporation
Leisure-Products
|
$23.77
|
-0.50
-2.06% |
$24.21
|
307,961
179.05% of 50 DAV
50 DAV is 172,000
|
$26.07
-8.82%
|
5/12/2021
|
$21.40
|
PP = $19.73
|
|
MB = $20.72
|
Most Recent Note - 6/16/2021 12:31:16 PM
G - Pulling back from its 52-week high with today's 3rd consecutive loss, but still very extended from the previously noted base. Its 50 DMA line ($20.93) and prior high ($19.63 on 3/09/21) define support to watch.
>>> FEATURED STOCK ARTICLE : 4 Volume-Driven Gains Into New High Territory - 5/12/2021 |
View all notes |
Set NEW NOTE alert |
Company Profile |
SEC
News |
Chart |
Request a new note
C
A
S
I |
AVTR
-
NYSE
Avantor Inc
Medical-Research Eqp/Svc
|
$34.05
|
+0.82
2.47% |
$34.50
|
5,452,734
138.18% of 50 DAV
50 DAV is 3,946,000
|
$33.99
0.18%
|
6/10/2021
|
$32.94
|
PP = $34.09
|
|
MB = $35.79
|
Most Recent Note - 6/16/2021 4:59:51 PM
Y - Posted a solid gain today backed by +38% above average volume. Held its ground stubbornly since highlighted in yellow in the 6/10/21 mid-day report with a pivot point cited based on its 4/29/21 high plus 10 cents. Subsequent gains above the pivot point backed by at least +40% are needed to trigger a proper technical buy signal. The Mar '21 quarter marked its 3rd consecutive quarterly comparison with earnings above the year ago period by at least +25% (C criteria). Annual earnings growth has been strong (A criteria). Following its $14 IPO on 5/17/19 it completed Secondary Offerings on 5/21/20, 8/21/20 and 11/09/20.
>>> FEATURED STOCK ARTICLE : Medical Research Firm Challenging Prior High - 6/10/2021 |
View all notes |
Set NEW NOTE alert |
Company Profile |
SEC
News |
Chart |
Request a new note
C
A
S
I |
|
|
|
THESE ARE NOT BUY RECOMMENDATIONS!
Comments contained in the body of this report are technical
opinions only. The material herein has been obtained
from sources believed to be reliable and accurate, however,
its accuracy and completeness cannot be guaranteed.
This site is not an investment advisor, hence it does
not endorse or recommend any securities or other investments.
Any recommendation contained in this report may not
be suitable for all investors and it is not to be deemed
an offer or solicitation on our part with respect to
the purchase or sale of any securities. All trademarks,
service marks and trade names appearing in this report
are the property of their respective owners, and are
likewise used for identification purposes only.
This report is a service available
only to active Paid Premium Members.
You may opt-out of receiving report notifications
at any time. Questions or comments may be submitted
by writing to Premium Membership Services 665 S.E. 10 Street, Suite 201 Deerfield Beach, FL 33441-5634 or by calling 1-800-965-8307
or 954-785-1121.
|
|
|