You are not logged in.
This means you
CAN ONLY VIEW reports that were published prior to Thursday, March 20, 2025.
You
MUST UPGRADE YOUR MEMBERSHIP if you want to see any current reports.
AFTER MARKET UPDATE - WEDNESDAY, JUNE 30TH, 2021
Previous After Market Report Next After Market Report >>>
|
|
|
|
DOW |
+210.22 |
34,502.51 |
+0.61% |
|
Volume |
1,120,735,362 |
+39% |
|
Volume |
5,252,528,200 |
+10% |
|
NASDAQ |
-24.87 |
14,503.47 |
-0.17% |
|
Advancers |
1,888 |
58% |
|
Advancers |
2,029 |
47% |
|
S&P 500 |
+5.70 |
4,297.50 |
+0.13% |
|
Decliners |
1,389 |
42% |
|
Decliners |
2,281 |
53% |
|
Russell 2000 |
+1.71 |
2,310.55 |
+0.07% |
|
52 Wk Highs |
205 |
|
|
52 Wk Highs |
137 |
|
|
S&P 600 |
+4.86 |
1,374.84 |
+0.35% |
|
52 Wk Lows |
12 |
|
|
52 Wk Lows |
36 |
|
|
 |
Major Indexes Closed 5th Straight Quarterly Gain
Kenneth J. Gruneisen - Passed the CAN SLIM® Master's Exam
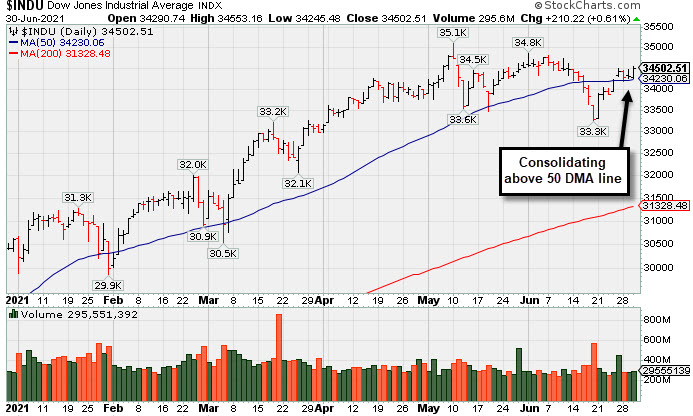
The major indices were mixed on Wednesday. The volume totals reported were mixed, lighter than the prior session on the NYSE and higher on the Nasdaq exchange. Breadth was mixed as decliners led advancers by a narrow margin on the Nasdaq, meanwhile advancers led decliners by 9-7 on the NYSE. Leadership thinned as there were 21 high-ranked companies from the Leaders List that hit new 52-week highs and were listed on the BreakOuts Page, versus 35 on the prior session. New 52-week highs totals solidly outnumbered new 52-week lows totals on the NYSE and on the Nasdaq exchange. The major indices (M criteria) are in an uptrend. Investors are reminded to always make buying and selling decisions on case-by-case basis under the strict criteria and rules of the fact-based investment system.
PICTURED: The Nasdaq Composite Index found prompt support at its 50-day moving average (DMA) line and is hitting new record highs.
The S&P 500 capped its strongest first-half performance since 2019 (+14.4% year-to-date). The broad benchmark rose 0.1% to a new record level, posting a fifth straight monthly advance (+2.2%). The Nasdaq Composite drifted from its all-time high, down 0.2%. The tech-heavy index climbed 5.5% in June as growth-related shares resumed their outperformance versus their more cyclical and value-oriented counterparts. The Dow added 210 points, paring its monthly decline to 0.1%. The Russell 2000 edged 0.2% higher, advancing for the ninth consecutive month, its longest such winning streak since 1983. The major averages posted their fifth straight quarterly gain, with the Dow, S&P 500 and Nasdaq Composite up 4.6%, 8.2%, and 9.5%, respectively.
Treasuries strengthened, with the yield on the 10-year note down one basis point to 1.46%, ending the month 13 basis points lower. In commodities, WTI crude capped its third consecutive monthly advance, up 10.9% in June to $73.54/barrel. COMEX gold weathered its worst month since November 2016 (-6.9%) as the U.S. dollar notched its strongest month since March (+2.3%). Elsewhere, bitcoin saw its worst quarter since the end of 2018.
On the data front, a report from ADP showed private payrolls increased by a better-than-forecasted 692,000 in June. Separately, pending home sales unexpectedly rebounded 8% in May, while weekly MBA mortgage applications fell the most since early February. Additionally, business conditions in the Chicago region eased from a 47-year high in June. In corporate news, Intel (INTC -1.07%) fell after postponing production of one of its newest chips, sending shares of rival Advanced Micro Devices (AMD +4.93%). |
 Kenneth J. Gruneisen started out as a licensed stockbroker in August 1987, a couple of months prior to the historic stock market crash that took the Dow Jones Industrial Average down -22.6% in a single day. He has published daily fact-based fundamental and technical analysis on high-ranked stocks online for two decades. Through FACTBASEDINVESTING.COM, Kenneth provides educational articles, news, market commentary, and other information regarding proven investment systems that work in good times and bad.
Comments contained in the body of this report are technical opinions only and are not necessarily those of Gruneisen Growth Corp. The material herein has been obtained from sources believed to be reliable and accurate, however, its accuracy and completeness cannot be guaranteed. Our firm, employees, and customers may effect transactions, including transactions contrary to any recommendation herein, or have positions in the securities mentioned herein or options with respect thereto. Any recommendation contained in this report may not be suitable for all investors and it is not to be deemed an offer or solicitation on our part with respect to the purchase or sale of any securities. |
|
 |
Bank, Biotech, and Commodity-Linked Groups Rose
Kenneth J. Gruneisen - Passed the CAN SLIM® Master's Exam
The Bank Index ($BKX +0.57%) posted a modest gain while the Broker/Dealer Index ($XBD -0.34%) edged lower and the Retail Index ($RLX -0.05%) finished flat The Biotech Index ($BTK +0.33%) inched higher while the Semiconductor Index ($SOX -0.11%) finished flat and the Networking Index ($NWX -0.65%) edged lower. Commodity linked groups posted gains as the Gold & Silver Index ($XAU +1.05%), the Oil Services Index ($OSX +0.55%), and Integrated Oil Index ($XOI +1.16%) each finished higher. PICTURED: The Gold & Silver Index ($XAU +1.05%) recently sank below its 50-day and 200-day moving average (DMA) lines.
| Oil Services |
$OSX |
63.74 |
+0.35 |
+0.55% |
+43.78% |
| Integrated Oil |
$XOI |
1,138.65 |
+13.05 |
+1.16% |
+43.68% |
| Semiconductor |
$SOX |
3,345.31 |
-3.55 |
-0.11% |
+19.67% |
| Networking |
$NWX |
854.58 |
-5.58 |
-0.65% |
+19.17% |
| Broker/Dealer |
$XBD |
469.12 |
-1.58 |
-0.34% |
+24.24% |
| Retail |
$RLX |
3,984.03 |
-1.99 |
-0.05% |
+11.81% |
| Gold & Silver |
$XAU |
141.17 |
+1.47 |
+1.05% |
-2.10% |
| Bank |
$BKX |
125.22 |
+0.70 |
+0.57% |
+27.89% |
| Biotech |
$BTK |
5,901.08 |
+19.20 |
+0.33% |
+2.82% |
|
|
|
 |
Consolidating Above 50-Day Moving Average Helped Outlook
Kenneth J. Gruneisen - Passed the CAN SLIM® Master's Exam
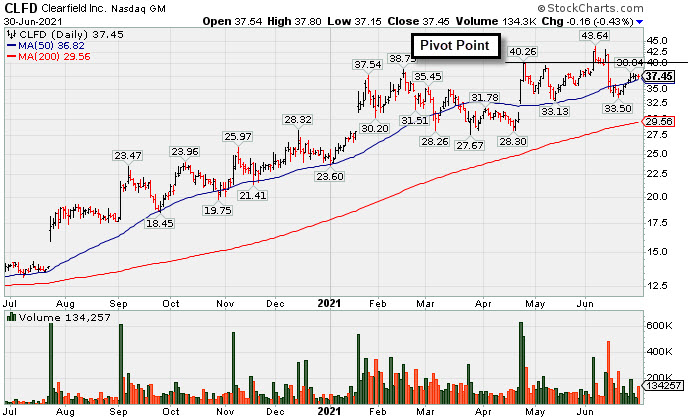
Clearfield Inc (CLFD -$0.16 or -0.43% to $37.45) has been consolidating above Its 50-day moving average (DMA) line ($36.64) which has helped its outlook improve. Fundamentals remain strong. It made no meaningful progress since highlighted in yellow with new pivot point cited based on its 2/16/21 high plus 10 cents in the 4/26/21 mid-day report (read here). The recent low ($33.50) defines important near term support to watch. More damaging losses would raise serious concerns.
Bullish action came after it reported Mar '21 quarterly earnings +440% on +45% sales revenues versus the year ago period, continuing its strong earnings track record. The high-ranked TELECOMMUNICATIONS - Fiber Optics firm has reported 5 consecutive quarterly earnings comparisons above the +25% minimum guideline (C criteria). Annual earnings (A criteria) history has improved after a downturn in FY '17.
CLFD traded up more than 75% since first highlighted in yellow with pivot point cited based on its 11/09/20 high plus 10 cents in the 11/17/20 mid-day report (read here).
The number of top-rated funds owning its shares rose from 132 in Jun '20 to 166 in Mar '21. Its current Up/Down Volume Ratio of 1.5 is an unbiased indication its shares have been under slight accumulation over the past 50 days. Its Accumulation/Distribution Rating is C+ and Timeliness Rating is B, and its Sponsorship Rating is D.
|
|
|
Color Codes Explained :
Y - Better candidates highlighted by our
staff of experts.
G - Previously featured
in past reports as yellow but may no longer be buyable under the
guidelines.
***Last / Change / Volume data in this table is the closing quote data***
Symbol/Exchange
Company Name
Industry Group |
PRICE |
CHANGE
(%Change) |
Day High |
Volume
(% DAV)
(% 50 day avg vol) |
52 Wk Hi
% From Hi |
Featured
Date |
Price
Featured |
Pivot Featured |
|
Max Buy |
 ABCB
-
NASDAQ
ABCB
-
NASDAQ
Ameris Bancorp
BANKING - Regional - Mid-Atlantic Banks
|
$50.63
|
-0.05
-0.10% |
$50.92
|
319,954
72.39% of 50 DAV
50 DAV is 442,000
|
$59.85
-15.41%
|
5/21/2021
|
$58.86
|
PP = $57.91
|
|
MB = $60.81
|
Most Recent Note - 6/29/2021 5:08:13 PM
G - Still sputtering after last week's damaging losses triggered a worrisome technical sell signal. A rebound above the 50 DMA line (54.26) is needed for its outlook to improve. See the latest FSU analysis for more details and a new annotated graph.
>>> FEATURED STOCK ARTICLE : Still Sputtering After Damaging Losses Triggered Sell Signal - 6/29/2021 |
View all notes |
Set NEW NOTE alert |
Company Profile |
SEC
News |
Chart |
Request a new note
C
A
S
I |
SIVB
-
NASDAQ
S V B Financial Group
BANKING - Regional - Pacific Banks
|
$556.43
|
-0.46
-0.08% |
$561.52
|
353,576
88.62% of 50 DAV
50 DAV is 399,000
|
$608.84
-8.61%
|
4/23/2021
|
$579.70
|
PP = $577.16
|
|
MB = $606.02
|
Most Recent Note - 6/25/2021 5:14:27 PM
G - Consolidating near its 50 DMA line ($566). Confirming gains above the pivot point backed by at least +40% above average volume are still needed to help clinch a convincing technical buy signal. Reported earnings +293% on +64% sales revenues for the Mar '21 quarter versus the year ago period, its 3rd strong comparison. Completed a new Public Offering on 3/24/21. See the latest FSU analysis for more details and a new annotated graph.
>>> FEATURED STOCK ARTICLE : Consolidating Near 50-Day Average After Distributional Pressure - 6/25/2021 |
View all notes |
Set NEW NOTE alert |
Company Profile |
SEC
News |
Chart |
Request a new note
C
A
S
I |
LOGI
-
NASDAQ
Logitech Intl Sa
COMPUTER HARDWARE - Computer Peripherals
|
$120.92
|
-2.37
-1.92% |
$121.67
|
623,195
72.89% of 50 DAV
50 DAV is 855,000
|
$140.17
-13.73%
|
5/26/2021
|
$119.13
|
PP = $120.34
|
|
MB = $126.36
|
Most Recent Note - 6/25/2021 5:12:56 PM
Y - Suffered a loss today with higher volume, slumping near prior highs in the $120-117 area which define important support to watch above its 50 DMA line ($118.34).
>>> FEATURED STOCK ARTICLE : Streak of Gains to New Highs Lacked Great Volume Conviction - 5/27/2021 |
View all notes |
Set NEW NOTE alert |
Company Profile |
SEC
News |
Chart |
Request a new note
C
A
S
I |
CROX
-
NASDAQ
Crocs Inc
CONSUMER NON-DURABLES - Textile - Apparel Footwear
|
$116.52
|
+0.87
0.75% |
$116.85
|
848,295
47.02% of 50 DAV
50 DAV is 1,804,000
|
$117.98
-1.24%
|
6/14/2021
|
$112.64
|
PP = $110.01
|
|
MB = $115.51
|
Most Recent Note - 6/28/2021 5:13:08 PM
Y - Posted a 6th consecutive gain today with lighter than average volume hitting new all-time highs. Its 50 DMA line ($101.64) defines initial support above the prior low ($94.92 on 5/20/21).
>>> FEATURED STOCK ARTICLE : Encountered Distributional Pressure Late This Week - 5/28/2021 |
View all notes |
Set NEW NOTE alert |
Company Profile |
SEC
News |
Chart |
Request a new note
C
A
S
I |
RCKY
-
NASDAQ
Rocky Brands Inc
CONSUMER NON-DURABLES - Textile - Apparel Footwear
|
$55.60
|
+0.10
0.18% |
$56.04
|
40,974
46.56% of 50 DAV
50 DAV is 88,000
|
$69.00
-19.42%
|
5/5/2021
|
$61.65
|
PP = $61.55
|
|
MB = $64.63
|
Most Recent Note - 6/28/2021 5:16:08 PM
G - Still sputtering below its 50 DMA line ($55.99) which is now downward sloping. A rebound above that short-term average is needed for its outlook to improve. The prior low ($50.52 on 5/19/21) defines the next important support where any violation may trigger a more worrisome technical sell signal. Fundamentals remain strong.
>>> FEATURED STOCK ARTICLE : Still Sputtering After Slump Below 50-Day Moving Average - 6/7/2021 |
View all notes |
Set NEW NOTE alert |
Company Profile |
SEC
News |
Chart |
Request a new note
C
A
S
I |
Symbol/Exchange
Company Name
Industry Group |
PRICE |
CHANGE
(%Change) |
Day High |
Volume
(% DAV)
(% 50 day avg vol) |
52 Wk Hi
% From Hi |
Featured
Date |
Price
Featured |
Pivot Featured |
|
Max Buy |
CRL
-
NYSE
Charles River Labs Intl
DRUGS - Biotechnology
|
$369.92
|
-1.73
-0.47% |
$372.51
|
292,048
41.54% of 50 DAV
50 DAV is 703,000
|
$371.80
-0.51%
|
6/9/2021
|
$345.91
|
PP = $349.23
|
|
MB = $366.69
|
Most Recent Note - 6/28/2021 5:11:21 PM
Y - Holding its ground with below average volume after recently wedging to new highs. Gains above the pivot point backed by at least +40% above average volume are needed to trigger a proper new (or add-on) technical buy signal. Its 50 DMA line ($338.50) defines near-term support to watch on pullbacks. Two of the past 3 quarterly comparisons through Mar '21 have been above the +25% minimum earnings guideline (C criteria).
>>> FEATURED STOCK ARTICLE : Building New Base After Strong Quarterly Earnings Report - 6/9/2021 |
View all notes |
Set NEW NOTE alert |
Company Profile |
SEC
News |
Chart |
Request a new note
C
A
S
I |
GNRC
-
NYSE
Generac Hldgs Inc
Electrical-Power/Equipmt
|
$415.15
|
+4.73
1.15% |
$417.49
|
540,165
72.60% of 50 DAV
50 DAV is 744,000
|
$412.10
0.74%
|
6/8/2021
|
$348.46
|
PP = $342.38
|
|
MB = $359.50
|
Most Recent Note - 6/24/2021 12:52:54 PM
G - Reversed into the red today after hitting another new all-time high. Very extended from the previously noted base after a streak of 10 consecutive gains marked by volume. Prior high ($364) defines initial support to watch on pullbacks. Fundamentals remain strong.
>>> FEATURED STOCK ARTICLE : Gap Up Gain With +118% Above Average Volume - 6/8/2021 |
View all notes |
Set NEW NOTE alert |
Company Profile |
SEC
News |
Chart |
Request a new note
C
A
S
I |
CAMT
-
NASDAQ
Camtek Ltd
ELECTRONICS - Scientific and Technical Instrum
|
$37.71
|
+0.07
0.19% |
$38.41
|
189,869
61.45% of 50 DAV
50 DAV is 309,000
|
$40.47
-6.82%
|
4/28/2021
|
$35.03
|
PP = $35.34
|
|
MB = $37.11
|
Most Recent Note - 6/29/2021 4:14:00 PM
G - Volume totals have been cooling. It is extended from any sound base. Found support near prior highs in the $35-36 area. Its 50 DMA line ($34.09) defines the next important support to watch.
>>> FEATURED STOCK ARTICLE : Perched at 52-Week High After 4th Consecutive Gain - 6/1/2021 |
View all notes |
Set NEW NOTE alert |
Company Profile |
SEC
News |
Chart |
Request a new note
C
A
S
I |
ASML
-
NASDAQ
A S M L Holding N.V. NY
ELECTRONICS - Semiconductor Equipment and Mate
|
$690.84
|
-12.84
-1.82% |
$696.57
|
762,171
94.33% of 50 DAV
50 DAV is 808,000
|
$710.97
-2.83%
|
5/25/2021
|
$669.59
|
PP = $675.75
|
|
MB = $709.54
|
 Most Recent Note - 6/30/2021 12:20:51 PM
Y - Volume totals have been cooling while consolidating near its all time high after testing the prior high ($675) with a big loss on heavier volume. Highlighted in yellow with pivot point cited based on its 4/26/21 high plus 10 cents. Subsequent gain and a strong close above its pivot point backed by at least +40% above average volume is needed to trigger a proper technical buy signal. Its 50 DMA line ($666) defines important near-term support to watch.
>>> FEATURED STOCK ARTICLE : Perched Near All-Time High After Short Base Above 50-Day Average - 5/26/2021 |
View all notes |
Set NEW NOTE alert |
Company Profile |
SEC
News |
Chart |
Request a new note
C
A
S
I |
BRKS
-
NASDAQ
Brooks Automation
ELECTRONICS - Semiconductor Equipment and Mate
|
$95.28
|
-1.20
-1.24% |
$96.71
|
1,300,276
135.16% of 50 DAV
50 DAV is 962,000
|
$108.72
-12.36%
|
4/5/2021
|
$99.31
|
PP = $91.88
|
|
MB = $96.47
|
Most Recent Note - 6/24/2021 3:51:08 PM
G - Rebounding toward its 50 DMA line ($97.17) which may act as resistance after damaging volume-driven losses. A rebound above the 50 DMA line would help its outlook improve. More damaging losses below the recent low ($86.12 on 5/12/21) would trigger a more worrisome technical sell signal.
>>> FEATURED STOCK ARTICLE : Consolidating Above 50-Day Moving Average Line and Prior High - 6/3/2021 |
View all notes |
Set NEW NOTE alert |
Company Profile |
SEC
News |
Chart |
Request a new note
C
A
S
I |
Symbol/Exchange
Company Name
Industry Group |
PRICE |
CHANGE
(%Change) |
Day High |
Volume
(% DAV)
(% 50 day avg vol) |
52 Wk Hi
% From Hi |
Featured
Date |
Price
Featured |
Pivot Featured |
|
Max Buy |
OPY
-
NYSE
Oppenheimer Holdings Inc
FINANCIAL SERVICES - Investment Brokerage - Regiona
|
$50.84
|
-0.12
-0.24% |
$51.03
|
43,451
39.15% of 50 DAV
50 DAV is 111,000
|
$55.75
-8.81%
|
6/7/2021
|
$48.74
|
PP = $52.55
|
|
MB = $55.18
|
Most Recent Note - 6/24/2021 4:00:52 PM
Y - Posted a 2nd consecutive gain with below average volume. Recent slump below prior highs and back into the prior base raised concerns. Its 50 DMA line ($49.06) defines important near term support. Fundamentals remain strong.
>>> FEATURED STOCK ARTICLE : Abrupt Slump Back Into Latest Base With 2 Volume-Driven Losses - 6/18/2021 |
View all notes |
Set NEW NOTE alert |
Company Profile |
SEC
News |
Chart |
Request a new note
C
A
S
I |
MED
-
NYSE
Medifast Inc
SPECIALTY RETAIL - Specialty Retail, Other
|
$282.98
|
+3.81
1.36% |
$285.00
|
90,897
75.12% of 50 DAV
50 DAV is 121,000
|
$336.99
-16.03%
|
5/11/2021
|
$285.72
|
PP = $279.56
|
|
MB = $293.54
|
Most Recent Note - 6/24/2021 4:44:39 PM
G - Recently rebounded and it is consolidating near the prior high in the $279 area and near its 50 DMA line ($278). More damaging losses below the prior low ($258.77 on ce6/17/21) would raise greater concerns and trigger a worrisome technical sell signal.
>>> FEATURED STOCK ARTICLE : Halted 10-Session Losing Streak Near Prior High and 50 DMA - 6/15/2021 |
View all notes |
Set NEW NOTE alert |
Company Profile |
SEC
News |
Chart |
Request a new note
C
A
S
I |
CLFD
-
NASDAQ
Clearfield Inc
TELECOMMUNICATIONS - Cables / Satalite Equipment
|
$37.45
|
-0.16
-0.43% |
$37.80
|
134,257
92.59% of 50 DAV
50 DAV is 145,000
|
$43.64
-14.18%
|
6/4/2021
|
$40.01
|
PP = $40.36
|
|
MB = $42.38
|
Most Recent Note - 6/30/2021 5:46:00 PM
G - Consolidating above its 50 DMA line ($36.64) which has helped its outlook improve, but it still faces some resistance due to overhead supply up to the $43 level. Fundamentals remain strong. See the latest FSU analysis for more details and a new annotated graph.
>>> FEATURED STOCK ARTICLE : Consolidating Above 50-Day Moving Average Helped Outlook - 6/30/2021 |
View all notes |
Set NEW NOTE alert |
Company Profile |
SEC
News |
Chart |
Request a new note
C
A
S
I |
POOL
-
NASDAQ
Pool Corp
WHOLESALE - Basic Materials Wholesale
|
$458.66
|
-6.38
-1.37% |
$467.55
|
431,864
165.47% of 50 DAV
50 DAV is 261,000
|
$470.15
-2.44%
|
6/21/2021
|
$455.09
|
PP = $449.54
|
|
MB = $472.02
|
Most Recent Note - 6/30/2021 12:59:03 PM
Y - Pulling back from its 52-week high hit on the prior session. Prior highs in the $449-444 range define initial support to watch above its 50 DMA line ($434) on pullbacks.
>>> FEATURED STOCK ARTICLE : Volume-Driven Breakout After Orderly Consolidation - 6/21/2021 |
View all notes |
Set NEW NOTE alert |
Company Profile |
SEC
News |
Chart |
Request a new note
C
A
S
I |
FSBW
-
NASDAQ
F S Bancorp
Banks-West/Southwest
|
$71.27
|
-0.47
-0.66% |
$72.89
|
9,369
62.46% of 50 DAV
50 DAV is 15,000
|
$73.62
-3.19%
|
5/18/2021
|
$70.16
|
PP = $73.72
|
|
MB = $77.41
|
Most Recent Note - 6/24/2021 4:41:38 PM
Y - Quiet gain today leaves it perched within close striking distance of the pivot point cited based on its 3/08/21 high plus 10 cents. It has been consolidating above its 50 DMA line ($69.25) where it found prompt support during its ongoing ascent. Subsequent gains above the pivot point backed by at least +40% above average volume are needed to trigger a technical buy signal. See the latest FSU analysis for more details and a new annotated graph.
>>> FEATURED STOCK ARTICLE : Still Consolidating With Close Striking Distance of All-Time High - 6/24/2021 |
View all notes |
Set NEW NOTE alert |
Company Profile |
SEC
News |
Chart |
Request a new note
C
A
S
I |
Symbol/Exchange
Company Name
Industry Group |
PRICE |
CHANGE
(%Change) |
Day High |
Volume
(% DAV)
(% 50 day avg vol) |
52 Wk Hi
% From Hi |
Featured
Date |
Price
Featured |
Pivot Featured |
|
Max Buy |
SMPL
-
NASDAQ
Simply Good Foods Co
Food-Confectionery
|
$36.51
|
+0.17
0.47% |
$36.88
|
428,591
80.41% of 50 DAV
50 DAV is 533,000
|
$37.83
-3.49%
|
12/28/2020
|
$30.40
|
PP = $31.44
|
|
MB = $33.01
|
Most Recent Note - 6/24/2021 1:07:55 PM
G - Hovering near its all-time high following a noted streak of 8 consecutive gains. Near-term support to watch is its 50 DMA line ($34.45) and the prior low ($31.09 on 5/18/21). Reported Feb '21 quarterly earnings +9% on +2% sales revenues versus the year ago period, below the +25% minimum earnings guideline (C criteria), raising fundamental concerns.
>>> FEATURED STOCK ARTICLE : Simply Wedging Into New High Territory - 6/14/2021 |
View all notes |
Set NEW NOTE alert |
Company Profile |
SEC
News |
Chart |
Request a new note
C
A
S
I |
SHOP
-
NYSE
Shopify Inc Cl A
Computer Sftwr-Enterprse
|
$1,460.98
|
-22.01
-1.48% |
$1,491.80
|
1,041,770
70.68% of 50 DAV
50 DAV is 1,474,000
|
$1,552.23
-5.88%
|
6/16/2021
|
$1,343.80
|
PP = $1,499.85
|
|
MB = $1,574.84
|
Most Recent Note - 6/29/2021 2:41:59 PM
Y - Stubbornly holding its ground near its all-time high, however, it has pulled back below its pivot point with volume totals cooling after an impressive streak of gains.
>>> FEATURED STOCK ARTICLE : Rebounding After Choppy 4-Month Consolidation - 6/16/2021 |
View all notes |
Set NEW NOTE alert |
Company Profile |
SEC
News |
Chart |
Request a new note
C
A
S
I |
YETI
-
NYSE
Yeti Holdings Inc
Leisure-Products
|
$91.82
|
-1.02
-1.10% |
$93.02
|
802,954
51.97% of 50 DAV
50 DAV is 1,545,000
|
$95.76
-4.11%
|
5/13/2021
|
$84.20
|
PP = $90.65
|
|
MB = $95.18
|
Most Recent Note - 6/29/2021 5:10:22 PM
Y - Color code is changed to yellow after a 3rd consecutive gain today with lighter volume, consolidating above the 50 DMA line ($88.36). Prior highs in the $80 area define near-term support to watch on pullbacks. Reported Mar 21 quarterly earnings +245% on +42% sales revenues versus the year ago period, continuing its strong earnings track record.
>>> FEATURED STOCK ARTICLE : Hovering Near High After Finding Support at 50-Day Moving Average - 6/4/2021 |
View all notes |
Set NEW NOTE alert |
Company Profile |
SEC
News |
Chart |
Request a new note
C
A
S
I |
MRBK
-
NASDAQ
Meridian Corp
Banks-Northeast
|
$26.25
|
+0.00
0.00% |
$26.81
|
5,118
11.71% of 50 DAV
50 DAV is 43,700
|
$29.18
-10.04%
|
5/18/2021
|
$25.58
|
PP = $28.06
|
|
MB = $29.46
|
Most Recent Note - 6/29/2021 2:23:57 PM
Y - Churned higher than average volume while recently consolidating in a tight range near its 50 DMA line ($26.42). Stalled since reaching a new 52-week high when featured on 5/18/21. Reported Mar '21 earnings +323% on +93% sales revenues versus the year ago period, continuing its strong earnings track record. Recent low ($24.01 on 4/21/21) defines important near-term support where any violation may trigger a worrisome technical sell signal. Its Relative Strength Rating is 75, below the 80 minimum guideline.
>>> FEATURED STOCK ARTICLE : Stalled Yet Found Support at 50-Day Moving Average Line - 6/11/2021 |
View all notes |
Set NEW NOTE alert |
Company Profile |
SEC
News |
Chart |
Request a new note
C
A
S
I |
JEF
-
NYSE
Jefferies Financial Grp
Finance-Invest Bnk/Bkrs
|
$34.20
|
-0.02
-0.06% |
$34.50
|
3,002,636
152.50% of 50 DAV
50 DAV is 1,969,000
|
$34.98
-2.23%
|
6/28/2021
|
$31.81
|
PP = $34.42
|
|
MB = $36.14
|
Most Recent Note - 6/30/2021 12:47:09 PM
Y - Holding its ground today. Gapped up on the prior session for a big volume-driven gain and touched a new 52-week high. Bullish action came after it reported May '21 quarterly earnings +713% on +70% sales revenues versus the year ago period, continuing its strong earnings rack record. It was highlighted in the 6/28/21 mid-day report in yellow with pivot point cited based on its 5/10/21 high while building on a 14-week "double bottom" base as it was noted - "Subsequent gains above the pivot point backed by at least +40% above average volume are necessary to trigger a technical buy signal. The past 3 quarterly comparisons through Feb '21 showed strong earnings increases with solid sales revenues growth. Annual earnings history (the A criteria) has been strong."
>>> FEATURED STOCK ARTICLE : High-Ranked Financial Firm Formed "Double Bottom" Base - 6/28/2021 |
View all notes |
Set NEW NOTE alert |
Company Profile |
SEC
News |
Chart |
Request a new note
C
A
S
I |
Symbol/Exchange
Company Name
Industry Group |
PRICE |
CHANGE
(%Change) |
Day High |
Volume
(% DAV)
(% 50 day avg vol) |
52 Wk Hi
% From Hi |
Featured
Date |
Price
Featured |
Pivot Featured |
|
Max Buy |
CLAR
-
NASDAQ
Clarus Corporation
Leisure-Products
|
$25.70
|
+0.37
1.46% |
$25.79
|
205,343
91.26% of 50 DAV
50 DAV is 225,000
|
$26.07
-1.42%
|
5/12/2021
|
$21.40
|
PP = $19.73
|
|
MB = $20.72
|
Most Recent Note - 6/29/2021 12:35:55 PM
G - Posting a solid gain with above average volume today. Rebounding after encountering distributional pressure, but it has not formed a sound base of sufficient length. Its 50 DMA line ($22.12) defines important near-term support to watch.
>>> FEATURED STOCK ARTICLE : Encountering Distributional Pressure After Recent Rally - 6/17/2021 |
View all notes |
Set NEW NOTE alert |
Company Profile |
SEC
News |
Chart |
Request a new note
C
A
S
I |
AVTR
-
NYSE
Avantor Inc
Medical-Research Eqp/Svc
|
$35.51
|
-0.24
-0.67% |
$35.75
|
4,300,202
106.78% of 50 DAV
50 DAV is 4,027,000
|
$36.31
-2.20%
|
6/10/2021
|
$32.94
|
PP = $34.09
|
|
MB = $35.79
|
Most Recent Note - 6/24/2021 3:56:38 PM
Y - Stubbornly holding its ground near its all-time high and wedging higher since triggering a technical buy signal. Prior highs in the $33 area define initial support to watch on pullbacks.
>>> FEATURED STOCK ARTICLE : Medical Research Firm Challenging Prior High - 6/10/2021 |
View all notes |
Set NEW NOTE alert |
Company Profile |
SEC
News |
Chart |
Request a new note
C
A
S
I |
|
|
|
THESE ARE NOT BUY RECOMMENDATIONS!
Comments contained in the body of this report are technical
opinions only. The material herein has been obtained
from sources believed to be reliable and accurate, however,
its accuracy and completeness cannot be guaranteed.
This site is not an investment advisor, hence it does
not endorse or recommend any securities or other investments.
Any recommendation contained in this report may not
be suitable for all investors and it is not to be deemed
an offer or solicitation on our part with respect to
the purchase or sale of any securities. All trademarks,
service marks and trade names appearing in this report
are the property of their respective owners, and are
likewise used for identification purposes only.
This report is a service available
only to active Paid Premium Members.
You may opt-out of receiving report notifications
at any time. Questions or comments may be submitted
by writing to Premium Membership Services 665 S.E. 10 Street, Suite 201 Deerfield Beach, FL 33441-5634 or by calling 1-800-965-8307
or 954-785-1121.
|
|
|