You are not logged in.
This means you
CAN ONLY VIEW reports that were published prior to Thursday, March 20, 2025.
You
MUST UPGRADE YOUR MEMBERSHIP if you want to see any current reports.
AFTER MARKET UPDATE - MONDAY, JUNE 21ST, 2021
Previous After Market Report Next After Market Report >>>
|
|
|
|
DOW |
+586.89 |
33,876.97 |
+1.76% |
|
Volume |
1,009,629,979 |
-63% |
|
Volume |
4,453,820,500 |
-27% |
|
NASDAQ |
+113.08 |
14,143.46 |
+0.81% |
|
Advancers |
2,405 |
75% |
|
Advancers |
2,494 |
58% |
|
S&P 500 |
+58.34 |
4,224.79 |
+1.40% |
|
Decliners |
821 |
25% |
|
Decliners |
1,797 |
42% |
|
Russell 2000 |
+48.35 |
2,286.09 |
+2.16% |
|
52 Wk Highs |
109 |
|
|
52 Wk Highs |
103 |
|
|
S&P 600 |
+30.21 |
1,360.88 |
+2.27% |
|
52 Wk Lows |
26 |
|
|
52 Wk Lows |
55 |
|
|
 |
Major Indices Rose With Lighter Volume Totals
Kenneth J. Gruneisen - Passed the CAN SLIM® Master's Exam
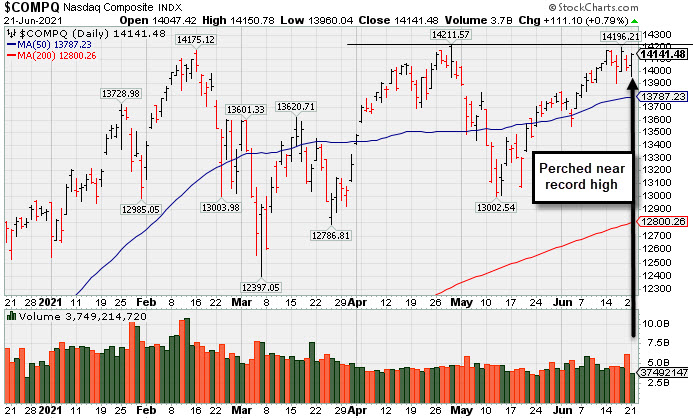
The Dow rallied 586 points in its best session since March (following its worst weekly performance since October). The S&P 500 jumped 1.4%, back within 0.8% of its most recent all-time high. The Nasdaq Composite rose 0.8%, while the small-cap Russell 2000 surged 2.1%. The volume totals reported were lighter than the prior session on the NYSE and on the Nasdaq exchange, down from Friday's totals which were inflated by options expirations. Breadth was positive as advancers led decliners by almost a 3-1 margin on the NYSE and by more than a 4-3 margin on the Nasdaq exchange. There were 25 high-ranked companies from the Leaders List that hit new 52-week highs and were listed on the BreakOuts Page, versus 17 on the prior session. New 52-week highs totals expanded and outnumbered new 52-week lows totals on the NYSE and on the Nasdaq exchange. The major indices (M criteria) are in an uptrend. Investors are reminded to always make buying and selling decisions on case-by-case basis under the strict criteria and rules of the fact-based investment system.
PICTURED: The Nasdaq Composite Index rebounded near its record high.
U.S. stocks finished firmly higher on Monday as Wall Street recouped some losses from last week. Meanwhile, the CBOE Volatility Index (VIX) - Wall Street's so-called "fear gauge” - fell back below 20 after climbing above that level for the first time in a month on Friday.
All 11 S&P 500 sectors closed in positive territory, with the more cyclical and value-oriented Energy, Financials and Industrials among the standouts. In corporate news, Amazon (AMZN -0.94%) edged lower as the e-commerce giant launched its Prime Day sale. Elsewhere, ZipRecruiter (ZIP +10.58%) rose after being the subject of multi-analyst upgrades.
Comments from Federal Reserve officials garnered attention, as last week’s market moves were widely attributed to the central bank’s perceived "hawkish" pivot. Dallas Fed President Kaplan stated his preference to taper asset purchases “sooner rather than later,” while New York Fed President Williams reiterated the need for continued monetary support, attributing recent price pressures to temporary factors. The U.S. Treasury yield curve steepened, with yield on the 10-year note up five basis points to 1.49%.
In FOREX trading, a gauge of the U.S. dollar slipped 0.4% on the heels of a 2% weekly rally. The lower dollar helped COMEX gold end a six-session losing streak, gaining 0.8% to $1,782.40/ounce. In other commodities, WTI crude advanced 2.7% to $73.60/barrel. |
 Kenneth J. Gruneisen started out as a licensed stockbroker in August 1987, a couple of months prior to the historic stock market crash that took the Dow Jones Industrial Average down -22.6% in a single day. He has published daily fact-based fundamental and technical analysis on high-ranked stocks online for two decades. Through FACTBASEDINVESTING.COM, Kenneth provides educational articles, news, market commentary, and other information regarding proven investment systems that work in good times and bad.
Comments contained in the body of this report are technical opinions only and are not necessarily those of Gruneisen Growth Corp. The material herein has been obtained from sources believed to be reliable and accurate, however, its accuracy and completeness cannot be guaranteed. Our firm, employees, and customers may effect transactions, including transactions contrary to any recommendation herein, or have positions in the securities mentioned herein or options with respect thereto. Any recommendation contained in this report may not be suitable for all investors and it is not to be deemed an offer or solicitation on our part with respect to the purchase or sale of any securities. |
|
 |
Energy and Financial Indexes Led Group Gainers
Kenneth J. Gruneisen - Passed the CAN SLIM® Master's Exam
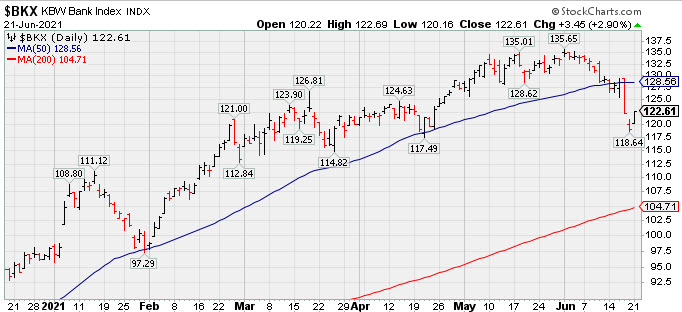
The Broker/Dealer Index ($XBD +2.05%) and Bank Index ($BKX +2.90%) both posted solid gains while the Retail Index ($RLX +0.17%) inched higher. The tech sector had a positive bias as the Networking Index ($NWX +1.83%) outpaced the Biotech Index ($BTK +0.40%) and the Semiconductor Index ($SOX +0.67%). The Oil Services Index ($OSX +5.45%) and Integrated Oil Index ($XOI +4.62%) both posted standout gains and outpaced the Gold & Silver Index ($XAU +1.63%).
PICTURED: The Biotech Index ($BTK +0.40%) posted a gain on Monday, rebounding after last week's slump well below its 50-day moving average line.
| Oil Services |
$OSX |
66.30 |
+3.42 |
+5.45% |
+49.56% |
| Integrated Oil |
$XOI |
1,141.00 |
+50.40 |
+4.62% |
+43.98% |
| Semiconductor |
$SOX |
3,173.87 |
+21.06 |
+0.67% |
+13.54% |
| Networking |
$NWX |
846.77 |
+15.24 |
+1.83% |
+18.08% |
| Broker/Dealer |
$XBD |
464.30 |
+9.34 |
+2.05% |
+22.96% |
| Retail |
$RLX |
3,925.21 |
+6.49 |
+0.17% |
+10.16% |
| Gold & Silver |
$XAU |
144.13 |
+2.32 |
+1.63% |
-0.04% |
| Bank |
$BKX |
122.61 |
+3.45 |
+2.90% |
+25.23% |
| Biotech |
$BTK |
5,934.91 |
+23.55 |
+0.40% |
+3.41% |
|
|
|
 |
Volume-Driven Breakout After Orderly Consolidation
Kenneth J. Gruneisen - Passed the CAN SLIM® Master's Exam
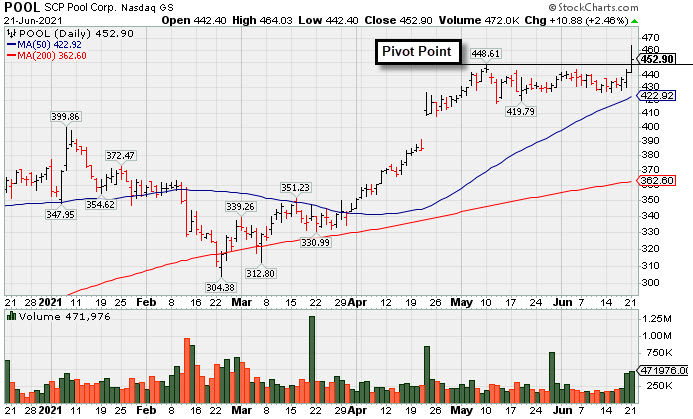
Pool Corp (POOL +$10.88 or +2.46% to $452.90) finished in the middle of its intra-day range after highlighted in yellow with pivot point cited based on its 5/10/21 high plus 10 cents in the earlier mid-day report (read here). It hit a new 52-week high with today's 3rd consecutive volume-driven gain after an orderly consolidation. The gain and close above the pivot point was backed +87% above average volume helping clinch a technical buy signal.
It has an Earnings Per Share Rating of 99. Reported earnings +227% on +57% sales revenues for the Mar '21 quarter versus the year ago period, its 3rd consecutive comparison well above the +25% minimum earnings guideline (C criteria), helping it better match the fact-based investment system's fundamental guidelines.
The high-ranked Retail - Leisure Products firm has seen the number of top-rated funds owning its shares rise from 813 in Jun '20 to 1,333 in Mar '21, a reassuring sign concerning the I criteria. Its current Up/Down Volume Ratio of 1.9 is an unbiased indication its shares have been under accumulation over the past 50 days. It has a Timeliness rating of A and Sponsorship Rating of B. Its small supply of only 40.1 million shares outstanding (S criteria) can contribute to greater price volatility in the event of institutional buying or selling.
|
|
|
Color Codes Explained :
Y - Better candidates highlighted by our
staff of experts.
G - Previously featured
in past reports as yellow but may no longer be buyable under the
guidelines.
***Last / Change / Volume data in this table is the closing quote data***
Symbol/Exchange
Company Name
Industry Group |
PRICE |
CHANGE
(%Change) |
Day High |
Volume
(% DAV)
(% 50 day avg vol) |
52 Wk Hi
% From Hi |
Featured
Date |
Price
Featured |
Pivot Featured |
|
Max Buy |
 ABCB
-
NASDAQ
ABCB
-
NASDAQ
Ameris Bancorp
BANKING - Regional - Mid-Atlantic Banks
|
$52.19
|
+2.16
4.32% |
$52.80
|
474,360
110.06% of 50 DAV
50 DAV is 431,000
|
$59.85
-12.80%
|
5/21/2021
|
$58.86
|
PP = $57.91
|
|
MB = $60.81
|
 Most Recent Note - 6/21/2021 5:15:38 PM
G - Rebounded impressively with today's big gain after last week's damaging losses triggered a worrisome technical sell signal. Only a prompt rebound above the 50 DMA line (54.14) would help its outlook improve.
>>> FEATURED STOCK ARTICLE : Breakout to New All-Time High for Another Regional Bank - 5/21/2021 |
View all notes |
Set NEW NOTE alert |
Company Profile |
SEC
News |
Chart |
Request a new note
C
A
S
I |
SIVB
-
NASDAQ
S V B Financial Group
BANKING - Regional - Pacific Banks
|
$553.47
|
+22.51
4.24% |
$555.15
|
340,601
80.33% of 50 DAV
50 DAV is 424,000
|
$608.84
-9.09%
|
4/23/2021
|
$579.70
|
PP = $577.16
|
|
MB = $606.02
|
Most Recent Note - 6/21/2021 5:18:32 PM
G - Posted a gain today with lighter volume after damaging volume-drive losses last week raised concerns. A prompt rebound above its 50 DMA line ($562) is needed for its outlook to improve. Confirming gains above the pivot point backed by at least +40% above average volume are still needed to help clinch a convincing technical buy signal. Reported earnings +293% on +64% sales revenues for the Mar '21 quarter versus the year ago period, its 3rd strong comparison. Completed a new Public Offering on 3/24/21.
>>> FEATURED STOCK ARTICLE : Sputtering Since Featured Without Confirming Gains - 5/20/2021 |
View all notes |
Set NEW NOTE alert |
Company Profile |
SEC
News |
Chart |
Request a new note
C
A
S
I |
LOGI
-
NASDAQ
Logitech Intl Sa
COMPUTER HARDWARE - Computer Peripherals
|
$126.34
|
+2.56
2.07% |
$127.38
|
517,827
61.94% of 50 DAV
50 DAV is 836,000
|
$140.17
-9.87%
|
5/26/2021
|
$119.13
|
PP = $120.34
|
|
MB = $126.36
|
Most Recent Note - 6/17/2021 6:26:39 PM
G - Pulled back from its all-time high, slumping near its previously noted "max buy" level. Prior highs in the $120-117 area define support to watch on pullbacks along with its 50 DMA line ($116.52).
>>> FEATURED STOCK ARTICLE : Streak of Gains to New Highs Lacked Great Volume Conviction - 5/27/2021 |
View all notes |
Set NEW NOTE alert |
Company Profile |
SEC
News |
Chart |
Request a new note
C
A
S
I |
CROX
-
NASDAQ
Crocs Inc
CONSUMER NON-DURABLES - Textile - Apparel Footwear
|
$107.44
|
+2.94
2.81% |
$108.58
|
1,042,440
58.83% of 50 DAV
50 DAV is 1,772,000
|
$115.37
-6.87%
|
6/14/2021
|
$112.64
|
PP = $110.01
|
|
MB = $115.51
|
Most Recent Note - 6/21/2021 5:20:30 PM
Y - Posted a gain today with lighter volume, halting a streak of 4 consecutive losses. Stalled after hitting a new all-time high on 6/14/21 and slumped back into the previously noted base raising concerns. Its 50 DMA line ($98.32) defines initial support above the prior low ($94.92 on 5/20/21).
>>> FEATURED STOCK ARTICLE : Encountered Distributional Pressure Late This Week - 5/28/2021 |
View all notes |
Set NEW NOTE alert |
Company Profile |
SEC
News |
Chart |
Request a new note
C
A
S
I |
RCKY
-
NASDAQ
Rocky Brands Inc
CONSUMER NON-DURABLES - Textile - Apparel Footwear
|
$55.34
|
+1.52
2.82% |
$55.70
|
62,368
70.87% of 50 DAV
50 DAV is 88,000
|
$69.00
-19.80%
|
5/5/2021
|
$61.65
|
PP = $61.55
|
|
MB = $64.63
|
Most Recent Note - 6/21/2021 5:21:50 PM
G - Posted a gain today with light volume, still sputtering below its 50 DMA line ($56.37). A rebound above that short-term average is needed for its outlook to improve. The prior low ($50.52 on 5/19/21) defines the next important support where any violation may trigger a more worrisome technical sell signal. Fundamentals remain strong.
>>> FEATURED STOCK ARTICLE : Still Sputtering After Slump Below 50-Day Moving Average - 6/7/2021 |
View all notes |
Set NEW NOTE alert |
Company Profile |
SEC
News |
Chart |
Request a new note
C
A
S
I |
Symbol/Exchange
Company Name
Industry Group |
PRICE |
CHANGE
(%Change) |
Day High |
Volume
(% DAV)
(% 50 day avg vol) |
52 Wk Hi
% From Hi |
Featured
Date |
Price
Featured |
Pivot Featured |
|
Max Buy |
CRL
-
NYSE
Charles River Labs Intl
DRUGS - Biotechnology
|
$360.59
|
+6.89
1.95% |
$361.68
|
257,920
36.90% of 50 DAV
50 DAV is 699,000
|
$359.56
0.29%
|
6/9/2021
|
$345.91
|
PP = $349.23
|
|
MB = $366.69
|
Most Recent Note - 6/21/2021 5:11:52 PM
Y - Posted yet another gain today with below average volume, wedging to new highs. Gains above the pivot point backed by at least +40% above average volume are needed to trigger a proper new (or add-on) technical buy signal. Its 50 DMA line ($333) defines near-term support to watch on pullbacks. Two of the past 3 quarterly comparisons through Mar '21 have been above the +25% minimum earnings guideline (C criteria).
>>> FEATURED STOCK ARTICLE : Building New Base After Strong Quarterly Earnings Report - 6/9/2021 |
View all notes |
Set NEW NOTE alert |
Company Profile |
SEC
News |
Chart |
Request a new note
C
A
S
I |
GNRC
-
NYSE
Generac Hldgs Inc
Electrical-Power/Equipmt
|
$389.21
|
+2.81
0.73% |
$390.56
|
886,215
130.52% of 50 DAV
50 DAV is 679,000
|
$391.62
-0.62%
|
6/8/2021
|
$348.46
|
PP = $342.38
|
|
MB = $359.50
|
Most Recent Note - 6/18/2021 4:48:00 PM
G - Getting more extended from the previously noted base, it hit another new all-time high with +111% above average volume behind today's 7th consecutive gain. Prior highs define initial support to watch on pullbacks. Fundamentals remain strong.
>>> FEATURED STOCK ARTICLE : Gap Up Gain With +118% Above Average Volume - 6/8/2021 |
View all notes |
Set NEW NOTE alert |
Company Profile |
SEC
News |
Chart |
Request a new note
C
A
S
I |
CAMT
-
NASDAQ
Camtek Ltd
ELECTRONICS - Scientific and Technical Instrum
|
$34.95
|
-1.24
-3.43% |
$36.22
|
321,062
97.88% of 50 DAV
50 DAV is 328,000
|
$40.47
-13.64%
|
4/28/2021
|
$35.03
|
PP = $35.34
|
|
MB = $37.11
|
Most Recent Note - 6/21/2021 5:08:16 PM
G - Suffered a 6th consecutive loss today undercutting prior highs in the $35-36 area raising some concerns. Its 50 DMA line ($33.57) defines the next important support to watch.
>>> FEATURED STOCK ARTICLE : Perched at 52-Week High After 4th Consecutive Gain - 6/1/2021 |
View all notes |
Set NEW NOTE alert |
Company Profile |
SEC
News |
Chart |
Request a new note
C
A
S
I |
ASML
-
NASDAQ
A S M L Holding N.V. NY
ELECTRONICS - Semiconductor Equipment and Mate
|
$680.65
|
+9.58
1.43% |
$681.95
|
565,045
66.71% of 50 DAV
50 DAV is 847,000
|
$710.97
-4.26%
|
5/25/2021
|
$669.59
|
PP = $675.75
|
|
MB = $709.54
|
Most Recent Note - 6/18/2021 3:25:36 PM
Y - Gapped down today retreating from its all time high and testing the prior high ($675) with a big loss on heavier volume. Highlighted in yellow with pivot point cited based on its 4/26/21 high plus 10 cents. Subsequent gain and a strong close above its pivot point backed by at least +40% above average volume is needed to trigger a proper technical buy signal. Its 50 DMA line ($657) defines important near-term support to watch.
>>> FEATURED STOCK ARTICLE : Perched Near All-Time High After Short Base Above 50-Day Average - 5/26/2021 |
View all notes |
Set NEW NOTE alert |
Company Profile |
SEC
News |
Chart |
Request a new note
C
A
S
I |
BRKS
-
NASDAQ
Brooks Automation
ELECTRONICS - Semiconductor Equipment and Mate
|
$93.76
|
+2.08
2.27% |
$94.14
|
927,097
117.35% of 50 DAV
50 DAV is 790,000
|
$108.72
-13.76%
|
4/5/2021
|
$99.31
|
PP = $91.88
|
|
MB = $96.47
|
Most Recent Note - 6/18/2021 3:20:54 PM
G - Gapped down today slumping well below its 50 DMA line ($97.31) with a big loss raising concerns. Only a prompt rebound above the 50 DMA line would help its outlook improve. More damaging losses below the recent low ($86.12 on 5/12/21) would trigger a more worrisome technical sell signal.
>>> FEATURED STOCK ARTICLE : Consolidating Above 50-Day Moving Average Line and Prior High - 6/3/2021 |
View all notes |
Set NEW NOTE alert |
Company Profile |
SEC
News |
Chart |
Request a new note
C
A
S
I |
Symbol/Exchange
Company Name
Industry Group |
PRICE |
CHANGE
(%Change) |
Day High |
Volume
(% DAV)
(% 50 day avg vol) |
52 Wk Hi
% From Hi |
Featured
Date |
Price
Featured |
Pivot Featured |
|
Max Buy |
OPY
-
NYSE
Oppenheimer Holdings Inc
FINANCIAL SERVICES - Investment Brokerage - Regiona
|
$50.12
|
+1.09
2.22% |
$50.89
|
113,419
103.11% of 50 DAV
50 DAV is 110,000
|
$55.75
-10.10%
|
6/7/2021
|
$48.74
|
PP = $52.55
|
|
MB = $55.18
|
Most Recent Note - 6/18/2021 4:51:38 PM
Y - Pulled back abruptly with above average volume behind 2 consecutive losses, slumping below prior highs and back into the prior base raising concerns. Its 50 DMA line ($48.48) defines important near term support. Fundamentals remain strong.
>>> FEATURED STOCK ARTICLE : Abrupt Slump Back Into Latest Base With 2 Volume-Driven Losses - 6/18/2021 |
View all notes |
Set NEW NOTE alert |
Company Profile |
SEC
News |
Chart |
Request a new note
C
A
S
I |
MED
-
NYSE
Medifast Inc
SPECIALTY RETAIL - Specialty Retail, Other
|
$265.63
|
+3.58
1.37% |
$269.57
|
93,900
78.91% of 50 DAV
50 DAV is 119,000
|
$336.99
-21.18%
|
5/11/2021
|
$285.72
|
PP = $279.56
|
|
MB = $293.54
|
Most Recent Note - 6/18/2021 3:40:05 PM
G - Color code is changed to green after slumping further below the prior high in the $279 area and violating its 50 DMA line ($275) raising greater concerns and triggering a technical sell signal. A rebound above the 50 DMA line is needed for its outlook to improve.
>>> FEATURED STOCK ARTICLE : Halted 10-Session Losing Streak Near Prior High and 50 DMA - 6/15/2021 |
View all notes |
Set NEW NOTE alert |
Company Profile |
SEC
News |
Chart |
Request a new note
C
A
S
I |
CLFD
-
NASDAQ
Clearfield Inc
TELECOMMUNICATIONS - Cables / Satalite Equipment
|
$34.74
|
+0.58
1.70% |
$34.85
|
82,306
57.96% of 50 DAV
50 DAV is 142,000
|
$43.64
-20.39%
|
6/4/2021
|
$40.01
|
PP = $40.36
|
|
MB = $42.38
|
Most Recent Note - 6/18/2021 3:28:23 PM
G - Slumping further below its 50 DMA line ($35.80) with another damaging loss today testing the prior low which defines important near-term support in the $33 area. Only a prompt rebound above the 50 DMA line would help its outlook improve. Fundamentals remain strong.
>>> FEATURED STOCK ARTICLE : Stalled and Found Support Above 50-Day Moving Average - 5/24/2021 |
View all notes |
Set NEW NOTE alert |
Company Profile |
SEC
News |
Chart |
Request a new note
C
A
S
I |
POOL
-
NASDAQ
Pool Corp
WHOLESALE - Basic Materials Wholesale
|
$452.90
|
+10.88
2.46% |
$464.03
|
471,976
187.29% of 50 DAV
50 DAV is 252,000
|
$449.44
0.77%
|
6/21/2021
|
$455.09
|
PP = $449.54
|
|
MB = $472.02
|
Most Recent Note - 6/21/2021 5:10:22 PM
Y - Color code was changed to yellow with pivot point cited based on its 5/10/21 high plus 10 cents. Hit a new 52-week high with today's 3rd consecutive volume-driven gain after an orderly consolidation. The gain and close above the pivot point backed by +85% above average volume clinched a technical buy signal. Reported earnings +227% on +57% sales revenues for the Mar '21 quarter versus the year ago period, its 3rd consecutive comparison well above the +25% minimum earnings guideline (C criteria), helping it better match the fact-based investment system's fundamental guidelines. See the latest FSU analysis for more details and a new annotated graph.
>>> FEATURED STOCK ARTICLE : Volume-Driven Breakout After Orderly Consolidation - 6/21/2021 |
View all notes |
Set NEW NOTE alert |
Company Profile |
SEC
News |
Chart |
Request a new note
C
A
S
I |
FSBW
-
NASDAQ
F S Bancorp
Banks-West/Southwest
|
$69.73
|
+0.48
0.69% |
$71.11
|
13,466
103.58% of 50 DAV
50 DAV is 13,000
|
$73.62
-5.28%
|
5/18/2021
|
$70.16
|
PP = $73.72
|
|
MB = $77.41
|
Most Recent Note - 6/18/2021 12:43:28 PM
Y - This thinly-traded Bank is still perched within close striking distance of the pivot point cited based on its 3/08/21 high plus 10 cents. It has been consolidating above its 50 DMA line ($69.01) where it found prompt support during its ongoing ascent. Subsequent gains above the pivot point backed by at least +40% above average volume are needed to trigger a technical buy signal. Fundamentals remain strong.
>>> FEATURED STOCK ARTICLE : Thinly-Traded Bank Consolidating Above 50-Day Moving Average - 5/18/2021 |
View all notes |
Set NEW NOTE alert |
Company Profile |
SEC
News |
Chart |
Request a new note
C
A
S
I |
Symbol/Exchange
Company Name
Industry Group |
PRICE |
CHANGE
(%Change) |
Day High |
Volume
(% DAV)
(% 50 day avg vol) |
52 Wk Hi
% From Hi |
Featured
Date |
Price
Featured |
Pivot Featured |
|
Max Buy |
SMPL
-
NASDAQ
Simply Good Foods Co
Food-Confectionery
|
$36.13
|
+0.27
0.75% |
$36.56
|
527,931
105.38% of 50 DAV
50 DAV is 501,000
|
$36.96
-2.25%
|
12/28/2020
|
$30.40
|
PP = $31.44
|
|
MB = $33.01
|
Most Recent Note - 6/21/2021 5:13:53 PM
G - Rising into new high territory with average volume behind today's 7th consecutive gain. Near-term support to watch is its 50 DMA line ($34.23) and the prior low ($31.09 on 5/18/21). Reported Feb '21 quarterly earnings +9% on +2% sales revenues versus the year ago period, below the +25% minimum earnings guideline (C criteria), raising fundamental concerns.
>>> FEATURED STOCK ARTICLE : Simply Wedging Into New High Territory - 6/14/2021 |
View all notes |
Set NEW NOTE alert |
Company Profile |
SEC
News |
Chart |
Request a new note
C
A
S
I |
SHOP
-
NYSE
Shopify Inc Cl A
Computer Sftwr-Enterprse
|
$1,480.23
|
+13.36
0.91% |
$1,552.23
|
3,235,801
235.50% of 50 DAV
50 DAV is 1,374,000
|
$1,499.75
-1.30%
|
6/16/2021
|
$1,343.80
|
PP = $1,499.85
|
|
MB = $1,574.84
|
Most Recent Note - 6/21/2021 1:11:48 PM
Y - Hitting new all-time highs with today's 8th consecutive gain marked by ever-increasing volume. A gain and strong close above the pivot point backed by at least +40% above average volume may clinch a proper trigger a technical buy signal. Found support after dipping below its 200 DMA line during the choppy consolidation since dropped from the Featured Stocks list on 3/04/21. Its Relative Strength Rating improved to 85, above the 80+ minimum guideline for buy candidates. Reported Mar '21 quarterly earnings +958% on +110% sales revenues versus the year ago period, continuing its strong earnings track record.
>>> FEATURED STOCK ARTICLE : Rebounding After Choppy 4-Month Consolidation - 6/16/2021 |
View all notes |
Set NEW NOTE alert |
Company Profile |
SEC
News |
Chart |
Request a new note
C
A
S
I |
YETI
-
NYSE
Yeti Holdings Inc
Leisure-Products
|
$88.61
|
+2.78
3.24% |
$89.23
|
1,004,259
68.50% of 50 DAV
50 DAV is 1,466,000
|
$95.76
-7.47%
|
5/13/2021
|
$84.20
|
PP = $90.65
|
|
MB = $95.18
|
Most Recent Note - 6/21/2021 5:23:28 PM
G - Posted a gain today with lighter volume breaking a streak of 5 consecutive losses. Only a prompt rebound above the 50 DMA line ($87.59) would help its outlook improve. Prior highs in the $80 area define near-term support to watch on pullbacks. Reported Mar 21 quarterly earnings +245% on +42% sales revenues versus the year ago period, continuing its strong earnings track record.
>>> FEATURED STOCK ARTICLE : Hovering Near High After Finding Support at 50-Day Moving Average - 6/4/2021 |
View all notes |
Set NEW NOTE alert |
Company Profile |
SEC
News |
Chart |
Request a new note
C
A
S
I |
MRBK
-
NASDAQ
Meridian Corp
Banks-Northeast
|
$26.14
|
-0.26
-0.98% |
$26.52
|
29,259
102.30% of 50 DAV
50 DAV is 28,600
|
$29.18
-10.42%
|
5/18/2021
|
$25.58
|
PP = $28.06
|
|
MB = $29.46
|
Most Recent Note - 6/17/2021 6:28:02 PM
Y - Churning higher than average volume while still consolidating in a tight range above its 50 DMA line ($26.29). Stalled since reaching a new 52-week high when featured on 5/18/21. Reported Mar '21 earnings +323% on +93% sales revenues versus the year ago period, continuing its strong earnings track record. Recent low ($24.01 on 4/21/21) defines important near-term support where any violation may trigger a worrisome technical sell signal. Its Relative Strength Rating is 76, below the 80 minimum guideline.
>>> FEATURED STOCK ARTICLE : Stalled Yet Found Support at 50-Day Moving Average Line - 6/11/2021 |
View all notes |
Set NEW NOTE alert |
Company Profile |
SEC
News |
Chart |
Request a new note
C
A
S
I |
CLAR
-
NASDAQ
Clarus Corporation
Leisure-Products
|
$24.46
|
+1.06
4.53% |
$24.66
|
249,715
134.26% of 50 DAV
50 DAV is 186,000
|
$26.07
-6.18%
|
5/12/2021
|
$21.40
|
PP = $19.73
|
|
MB = $20.72
|
Most Recent Note - 6/21/2021 5:16:54 PM
G - Posted a 2nd consecutive gain today, rebounding after encountering distributional pressure. Still extended from the prior base, its 50 DMA line ($21.29) and prior high ($19.63 on 3/09/21) define support to watch.
>>> FEATURED STOCK ARTICLE : Encountering Distributional Pressure After Recent Rally - 6/17/2021 |
View all notes |
Set NEW NOTE alert |
Company Profile |
SEC
News |
Chart |
Request a new note
C
A
S
I |
Symbol/Exchange
Company Name
Industry Group |
PRICE |
CHANGE
(%Change) |
Day High |
Volume
(% DAV)
(% 50 day avg vol) |
52 Wk Hi
% From Hi |
Featured
Date |
Price
Featured |
Pivot Featured |
|
Max Buy |
AVTR
-
NYSE
Avantor Inc
Medical-Research Eqp/Svc
|
$34.91
|
+0.22
0.63% |
$35.19
|
4,501,788
111.96% of 50 DAV
50 DAV is 4,021,000
|
$35.19
-0.80%
|
6/10/2021
|
$32.94
|
PP = $34.09
|
|
MB = $35.79
|
Most Recent Note - 6/17/2021 6:24:37 PM
Y - Posted a 2nd consecutive gain today backed by +45% above average volume triggering a technical buy signal. Prior highs in the $33 area define initial support to watch on pullbacks.
>>> FEATURED STOCK ARTICLE : Medical Research Firm Challenging Prior High - 6/10/2021 |
View all notes |
Set NEW NOTE alert |
Company Profile |
SEC
News |
Chart |
Request a new note
C
A
S
I |
|
|
|
THESE ARE NOT BUY RECOMMENDATIONS!
Comments contained in the body of this report are technical
opinions only. The material herein has been obtained
from sources believed to be reliable and accurate, however,
its accuracy and completeness cannot be guaranteed.
This site is not an investment advisor, hence it does
not endorse or recommend any securities or other investments.
Any recommendation contained in this report may not
be suitable for all investors and it is not to be deemed
an offer or solicitation on our part with respect to
the purchase or sale of any securities. All trademarks,
service marks and trade names appearing in this report
are the property of their respective owners, and are
likewise used for identification purposes only.
This report is a service available
only to active Paid Premium Members.
You may opt-out of receiving report notifications
at any time. Questions or comments may be submitted
by writing to Premium Membership Services 665 S.E. 10 Street, Suite 201 Deerfield Beach, FL 33441-5634 or by calling 1-800-965-8307
or 954-785-1121.
|
|
|