You are not logged in.
This means you
CAN ONLY VIEW reports that were published prior to Saturday, April 19, 2025.
You
MUST UPGRADE YOUR MEMBERSHIP if you want to see any current reports.
AFTER MARKET UPDATE - THURSDAY, JUNE 17TH, 2021
Previous After Market Report Next After Market Report >>>
|
|
|
|
DOW |
-210.22 |
33,823.45 |
-0.62% |
|
Volume |
1,195,941,595 |
+13% |
|
Volume |
4,528,013,700 |
-2% |
|
NASDAQ |
+128.24 |
14,167.92 |
+0.91% |
|
Advancers |
1,132 |
35% |
|
Advancers |
1,713 |
43% |
|
S&P 500 |
-1.84 |
4,221.86 |
-0.04% |
|
Decliners |
2,078 |
65% |
|
Decliners |
2,283 |
57% |
|
Russell 2000 |
-27.23 |
2,287.46 |
-1.18% |
|
52 Wk Highs |
141 |
|
|
52 Wk Highs |
121 |
|
|
S&P 600 |
-25.51 |
1,364.06 |
-1.84% |
|
52 Wk Lows |
25 |
|
|
52 Wk Lows |
36 |
|
|
 |
Breadth Negative as Major Indices Slumped
Kenneth J. Gruneisen - Passed the CAN SLIM® Master's Exam
The Dow fell 210 points, while the S&P 500 pared steeper declines to finish just below the flat line. The Nasdaq Composite rallied 0.9%, closing just below its record level notched on Monday. The volume totals reported were mixed, higher than the prior session on the NYSE and lighter on the Nasdaq exchange. Breadth was negative as decliners led advancers by almost a 2-1 margin on the NYSE and by a 3-2 margin on the Nasdaq exchange. There were 43 high-ranked companies from the Leaders List that hit new 52-week highs and were listed on the BreakOuts Page, versus 37 on the prior session. New 52-week highs totals contracted yet still solidly outnumbered new 52-week lows totals on the NYSE and on the Nasdaq exchange. The major indices (M criteria) are in an uptrend. Investors are reminded to always make buying and selling decisions on case-by-case basis under the strict criteria and rules of the fact-based investment system.
PICTURED: The Dow Jones Industrial Average violated its 50-day moving average (DMA) line with losses on higher volume raising concerns.
U.S. equities fluctuated as a rotation into growth-oriented stocks regained momentum on Thursday. Investors continued to assess the implications of the Federal Reserve's economic projections, which were widely interpreted as more "hawkish" than expected, with officials penciling in two rate hikes by the end of 2023.
Treasuries strengthened, with the yield on the 10-year note down seven basis points to 1.51%, retracing yesterday’s move that sent the benchmark rate spiking the most in three months. The 30-year bond yield fell nine basis points to 2.11%, its lowest level since February. In FOREX trading, the U.S. dollar advanced 0.9%, extending its rally to a fifth session for its longest winning streak since March 2020. The stronger greenback pressured commodities, with WTI crude sliding 1.5% to $71.06/barrel and COMEX gold sinking 4.5% to $1,776.60/ounce for its worst day since November. On the data front, initial jobless claims last week unexpectedly climbed for the first time since April.
Seven of 11 S&P 500 sectors ended in positive territory, with Information Technology gaining 1.2%. Health Care also outperformed with Danaher (DHR +5.07%) rising after agreeing to buy privately-held biotech company Aldevron for $9.6 billion. Meanwhile, the more-cyclical-oriented groups Energy, Financials and Materials were among the laggards. In corporate news, CureVac (CVAC -38.99%) fell after posting disappointing trial results for its experimental COVID-19 vaccine. In earnings, homebuilder Lennar Corp. (LEN +3.62%) following a top and bottom line beat. |
 Kenneth J. Gruneisen started out as a licensed stockbroker in August 1987, a couple of months prior to the historic stock market crash that took the Dow Jones Industrial Average down -22.6% in a single day. He has published daily fact-based fundamental and technical analysis on high-ranked stocks online for two decades. Through FACTBASEDINVESTING.COM, Kenneth provides educational articles, news, market commentary, and other information regarding proven investment systems that work in good times and bad.
Comments contained in the body of this report are technical opinions only and are not necessarily those of Gruneisen Growth Corp. The material herein has been obtained from sources believed to be reliable and accurate, however, its accuracy and completeness cannot be guaranteed. Our firm, employees, and customers may effect transactions, including transactions contrary to any recommendation herein, or have positions in the securities mentioned herein or options with respect thereto. Any recommendation contained in this report may not be suitable for all investors and it is not to be deemed an offer or solicitation on our part with respect to the purchase or sale of any securities. |
|
 |
Retail, Semiconductor, and Biotech Indexes Rose
Kenneth J. Gruneisen - Passed the CAN SLIM® Master's Exam
The Bank Index ($BKX -4.90%) weighed on the major indices and the Broker/Dealer Index ($XBD -1.33%) also fell while the Retail Index ($RLX +1.18%) helped offset pressure on the major averages as it posted a solid gain The tech sector was mixed as the Semiconductor Index ($SOX +0.96%) and Biotech Index ($BTK +0.40%) both rose, meanwhile the Networking Index ($NWX -0.57%) edged lower. Commodity-linked groups were standout decliners as the Gold & Silver Index ($XAU -5.81%), Oil Services Index ($OSX -5.62%), and Integrated Oil Index ($XOI -3.32%) each suffered a big loss.
PICTURED: The Semiconductor Index ($SOX +0.96%) is above its 50-day moving average line and perched within striking distance of the prior high.
| Oil Services |
$OSX |
64.33 |
-3.83 |
-5.62% |
+45.11% |
| Integrated Oil |
$XOI |
1,122.39 |
-38.50 |
-3.32% |
+41.63% |
| Semiconductor |
$SOX |
3,231.87 |
+30.86 |
+0.96% |
+15.61% |
| Networking |
$NWX |
852.88 |
-4.87 |
-0.57% |
+18.93% |
| Broker/Dealer |
$XBD |
467.75 |
-6.29 |
-1.33% |
+23.87% |
| Retail |
$RLX |
3,931.00 |
+45.80 |
+1.18% |
+10.32% |
| Gold & Silver |
$XAU |
145.19 |
-8.96 |
-5.81% |
+0.70% |
| Bank |
$BKX |
122.31 |
-6.30 |
-4.90% |
+24.92% |
| Biotech |
$BTK |
5,915.98 |
+23.54 |
+0.40% |
+3.08% |
|
|
|
 |
Encountering Distributional Pressure After Recent Rally
Kenneth J. Gruneisen - Passed the CAN SLIM® Master's Exam
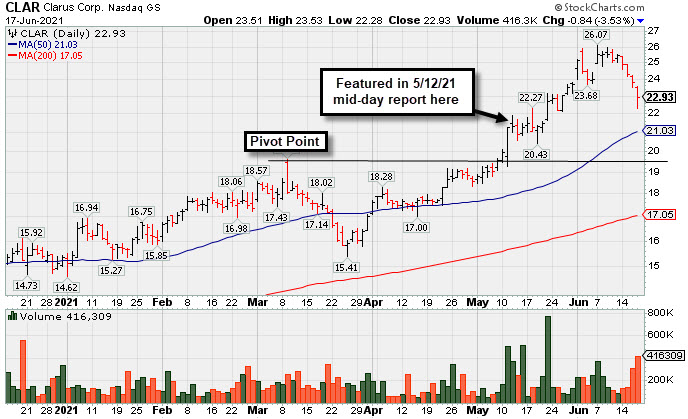
Clarus Corporation (CLAR -$0.84 or -3.53% to $22.93) pulled back from its 52-week high with today's 4th consecutive loss marked by ever-increasing volume. It is extended from the prior base. Its 50-day moving average (DMA) line ($21.03) and prior high ($19.63 on 3/09/21) define support to watch.
CLAR was highlighted in yellow in the 5/12/21 mid-day report (read here) with pivot point cited based on its 3/09/21 high plus 10 cents. It was shown in more detail with an annotated graph that evening under the headline, "4 Volume-Driven Gains Into New High Territory".
The high-ranked Leisure-Products firm's Sep, Dec '20 and Mar '21 quarterly results showed very strong earnings increases over the year ago periods with impressive acceleration in sales revenues growth rate. Annual earnings history (A criteria) has been strong.
The number of top-rated funds owning its shares rose from 168 in Dec '20 to 171 in Mar '21. Its current Up/Down Volume Ratio of 1.8 is an unbiased indication that its shares have been under accumulation over the past 50 days. Its small supply of only 22.2 million shares (S criteria) in the public float can contribute to greater volatility in the event of institutional buying or selling.
|
|
|
Color Codes Explained :
Y - Better candidates highlighted by our
staff of experts.
G - Previously featured
in past reports as yellow but may no longer be buyable under the
guidelines.
***Last / Change / Volume data in this table is the closing quote data***
Symbol/Exchange
Company Name
Industry Group |
PRICE |
CHANGE
(%Change) |
Day High |
Volume
(% DAV)
(% 50 day avg vol) |
52 Wk Hi
% From Hi |
Featured
Date |
Price
Featured |
Pivot Featured |
|
Max Buy |
 ABCB
-
NASDAQ
ABCB
-
NASDAQ
Ameris Bancorp
BANKING - Regional - Mid-Atlantic Banks
|
$52.91
|
-2.59
-4.67% |
$56.06
|
448,889
108.43% of 50 DAV
50 DAV is 414,000
|
$59.85
-11.60%
|
5/21/2021
|
$58.86
|
PP = $57.91
|
|
MB = $60.81
|
 Most Recent Note - 6/17/2021 6:15:06 PM
G - Color code is changed to green after slumping bellow its 50 DMA line ($54.17) with today's big loss raising concerns. Still sputtering below the previously cited pivot point. More damaging losses below the prior low ($52.42 on 5/26/21) would raise greater concerns and trigger a worrisome technical sell signal.
>>> FEATURED STOCK ARTICLE : Breakout to New All-Time High for Another Regional Bank - 5/21/2021 |
View all notes |
Set NEW NOTE alert |
Company Profile |
SEC
News |
Chart |
Request a new note
C
A
S
I |
SIVB
-
NASDAQ
S V B Financial Group
BANKING - Regional - Pacific Banks
|
$545.38
|
-21.68
-3.82% |
$573.98
|
421,482
102.30% of 50 DAV
50 DAV is 412,000
|
$608.84
-10.42%
|
4/23/2021
|
$579.70
|
PP = $577.16
|
|
MB = $606.02
|
Most Recent Note - 6/17/2021 6:19:34 PM
G - Undercut its 50 DMA line ($560) again with today's big loss raising concerns. A prompt rebound above its 50 DMA line is needed for its outlook to improve. Confirming gains above the pivot point backed by at least +40% above average volume are still needed to help clinch a convincing technical buy signal. Reported earnings +293% on +64% sales revenues for the Mar '21 quarter versus the year ago period, its 3rd strong comparison. Completed a new Public Offering on 3/24/21.
>>> FEATURED STOCK ARTICLE : Sputtering Since Featured Without Confirming Gains - 5/20/2021 |
View all notes |
Set NEW NOTE alert |
Company Profile |
SEC
News |
Chart |
Request a new note
C
A
S
I |
LOGI
-
NASDAQ
Logitech Intl Sa
COMPUTER HARDWARE - Computer Peripherals
|
$126.13
|
-1.94
-1.51% |
$127.04
|
794,181
96.38% of 50 DAV
50 DAV is 824,000
|
$140.17
-10.02%
|
5/26/2021
|
$119.13
|
PP = $120.34
|
|
MB = $126.36
|
Most Recent Note - 6/17/2021 6:26:39 PM
G - Pulled back from its all-time high, slumping near its previously noted "max buy" level. Prior highs in the $120-117 area define support to watch on pullbacks along with its 50 DMA line ($116.52).
>>> FEATURED STOCK ARTICLE : Streak of Gains to New Highs Lacked Great Volume Conviction - 5/27/2021 |
View all notes |
Set NEW NOTE alert |
Company Profile |
SEC
News |
Chart |
Request a new note
C
A
S
I |
CROX
-
NASDAQ
Crocs Inc
CONSUMER NON-DURABLES - Textile - Apparel Footwear
|
$108.21
|
-2.19
-1.98% |
$110.62
|
1,513,493
86.78% of 50 DAV
50 DAV is 1,744,000
|
$115.37
-6.21%
|
6/14/2021
|
$112.64
|
PP = $110.01
|
|
MB = $115.51
|
Most Recent Note - 6/14/2021 12:00:48 PM
Y - Gapped up today for a new all-time high clearing a short 5-week base. Color code is changed to yellow with new pivot point cited based on its 5/10/21 high plus 10 cents. A gain and strong close above its pivot point backed by at least +40% above average volume may clinch a proper new (or add-on) technical buy signal. Its 50 DMA line ($95.64) defines initial support above prior highs in the $86 area.
>>> FEATURED STOCK ARTICLE : Encountered Distributional Pressure Late This Week - 5/28/2021 |
View all notes |
Set NEW NOTE alert |
Company Profile |
SEC
News |
Chart |
Request a new note
C
A
S
I |
RCKY
-
NASDAQ
Rocky Brands Inc
CONSUMER NON-DURABLES - Textile - Apparel Footwear
|
$54.54
|
+0.12
0.22% |
$54.95
|
65,627
75.43% of 50 DAV
50 DAV is 87,000
|
$69.00
-20.96%
|
5/5/2021
|
$61.65
|
PP = $61.55
|
|
MB = $64.63
|
Most Recent Note - 6/14/2021 5:26:49 PM
G - Still sputtering below its 50 DMA line ($56.50). A rebound above that short-term average is needed for its outlook to improve. The prior low ($50.52 on 5/19/21) defines the next important support where any violation may trigger a more worrisome technical sell signal. Fundamentals remain strong.
>>> FEATURED STOCK ARTICLE : Still Sputtering After Slump Below 50-Day Moving Average - 6/7/2021 |
View all notes |
Set NEW NOTE alert |
Company Profile |
SEC
News |
Chart |
Request a new note
C
A
S
I |
Symbol/Exchange
Company Name
Industry Group |
PRICE |
CHANGE
(%Change) |
Day High |
Volume
(% DAV)
(% 50 day avg vol) |
52 Wk Hi
% From Hi |
Featured
Date |
Price
Featured |
Pivot Featured |
|
Max Buy |
CRL
-
NYSE
Charles River Labs Intl
DRUGS - Biotechnology
|
$357.78
|
+4.86
1.38% |
$359.56
|
402,956
58.83% of 50 DAV
50 DAV is 685,000
|
$356.35
0.40%
|
6/9/2021
|
$345.91
|
PP = $349.23
|
|
MB = $366.69
|
Most Recent Note - 6/15/2021 4:20:45 PM
Y - Posted recent gains with below average volume, wedging to new highs. Gains above the pivot point backed by at least +40% above average volume are needed to trigger a proper new (or add-on) technical buy signal. Its 50 DMA line ($329) defines near-term support to watch on pullbacks. Two of the past 3 quarterly comparisons through Mar '21 have been above the +25% minimum earnings guideline (C criteria).
>>> FEATURED STOCK ARTICLE : Building New Base After Strong Quarterly Earnings Report - 6/9/2021 |
View all notes |
Set NEW NOTE alert |
Company Profile |
SEC
News |
Chart |
Request a new note
C
A
S
I |
GNRC
-
NYSE
Generac Hldgs Inc
Electrical-Power/Equipmt
|
$378.94
|
+9.24
2.50% |
$381.01
|
961,882
147.75% of 50 DAV
50 DAV is 651,000
|
$377.01
0.51%
|
6/8/2021
|
$348.46
|
PP = $342.38
|
|
MB = $359.50
|
Most Recent Note - 6/17/2021 6:22:52 PM
G - Getting extended from the previously noted base, it hit another new all-time high with +47% above average volume behind today's 6th consecutive gain and its color code is changed to green. Prior highs define initial support to watch on pullbacks. Fundamentals remain strong.
>>> FEATURED STOCK ARTICLE : Gap Up Gain With +118% Above Average Volume - 6/8/2021 |
View all notes |
Set NEW NOTE alert |
Company Profile |
SEC
News |
Chart |
Request a new note
C
A
S
I |
CAMT
-
NASDAQ
Camtek Ltd
ELECTRONICS - Scientific and Technical Instrum
|
$36.85
|
-0.11
-0.30% |
$37.22
|
255,700
81.17% of 50 DAV
50 DAV is 315,000
|
$40.47
-8.94%
|
4/28/2021
|
$35.03
|
PP = $35.34
|
|
MB = $37.11
|
Most Recent Note - 6/15/2021 4:07:47 PM
G - Pulling back from its 52-week high. Prior highs in the $35-36 area define initial support to watch above its 50 DMA line ($33.32).
>>> FEATURED STOCK ARTICLE : Perched at 52-Week High After 4th Consecutive Gain - 6/1/2021 |
View all notes |
Set NEW NOTE alert |
Company Profile |
SEC
News |
Chart |
Request a new note
C
A
S
I |
ASML
-
NASDAQ
A S M L Holding N.V. NY
ELECTRONICS - Semiconductor Equipment and Mate
|
$698.83
|
-0.22
-0.03% |
$704.53
|
743,969
89.20% of 50 DAV
50 DAV is 834,000
|
$710.97
-1.71%
|
5/25/2021
|
$669.59
|
PP = $675.75
|
|
MB = $709.54
|
Most Recent Note - 6/16/2021 5:01:41 PM
Y - Stubbornly holding its ground near its all time high with volume totals cooling. Highlighted in yellow with pivot point cited based on its 4/26/21 high plus 10 cents. Subsequent gain and a strong close above its pivot point backed by at least +40% above average volume is needed to trigger a proper technical buy signal. Its 50 DMA line ($655) defines important near-term support to watch. Reported Mar '21 quarterly earnings +264% on +90% sales revenues versus the year-ago period. The 4 latest quarterly comparisons were above the +25% minimum earnings guideline (C criteria). Annual earnings history included a small downturn in FY '19. Dutch Electronics - Semiconductor Equipment firm made an impressive rally from a deep slump in March.
>>> FEATURED STOCK ARTICLE : Perched Near All-Time High After Short Base Above 50-Day Average - 5/26/2021 |
View all notes |
Set NEW NOTE alert |
Company Profile |
SEC
News |
Chart |
Request a new note
C
A
S
I |
BRKS
-
NASDAQ
Brooks Automation
ELECTRONICS - Semiconductor Equipment and Mate
|
$97.16
|
+0.60
0.62% |
$98.04
|
626,185
82.39% of 50 DAV
50 DAV is 760,000
|
$108.72
-10.63%
|
4/5/2021
|
$99.31
|
PP = $91.88
|
|
MB = $96.47
|
Most Recent Note - 6/15/2021 4:02:21 PM
G - Consolidating above its 50 DMA line ($97.52) which defines important near-term support. More damaging losses below the recent low ($86.12 on 5/12/21) would raise serious concerns.
>>> FEATURED STOCK ARTICLE : Consolidating Above 50-Day Moving Average Line and Prior High - 6/3/2021 |
View all notes |
Set NEW NOTE alert |
Company Profile |
SEC
News |
Chart |
Request a new note
C
A
S
I |
Symbol/Exchange
Company Name
Industry Group |
PRICE |
CHANGE
(%Change) |
Day High |
Volume
(% DAV)
(% 50 day avg vol) |
52 Wk Hi
% From Hi |
Featured
Date |
Price
Featured |
Pivot Featured |
|
Max Buy |
OPY
-
NYSE
Oppenheimer Holdings Inc
FINANCIAL SERVICES - Investment Brokerage - Regiona
|
$53.14
|
-1.98
-3.59% |
$55.63
|
239,467
230.26% of 50 DAV
50 DAV is 104,000
|
$55.75
-4.68%
|
6/7/2021
|
$48.74
|
PP = $52.55
|
|
MB = $55.18
|
Most Recent Note - 6/17/2021 6:30:08 PM
Y - Pulled back today after powering into new high territory with heavy volume behind a streak of 5 consecutive gains. Prior highs in the $52 define initial support to watch. Fundamentals remain strong.
>>> FEATURED STOCK ARTICLE : Extended From Any Sound Base After Decent Rally - 5/17/2021 |
View all notes |
Set NEW NOTE alert |
Company Profile |
SEC
News |
Chart |
Request a new note
C
A
S
I |
CRMT
-
NASDAQ
Americas Car-Mart Inc
SPECIALTY RETAIL - Auto Dealerships
|
$138.85
|
-5.76
-3.98% |
$146.44
|
82,176
167.02% of 50 DAV
50 DAV is 49,200
|
$177.45
-21.75%
|
5/25/2021
|
$159.80
|
PP = $165.10
|
|
MB = $173.36
|
Most Recent Note - 6/17/2021 6:17:56 PM
Slumped further below its 50 DMA line with higher volume behind today's 4th consecutive damaging loss, slumping below the prior low ($142) triggering a worrisome technical sell signal. Only a rebound above the 50 DMA line ($151( would help its outlook improve. It will be dropped from the Featured Stocks list tonight.
>>> FEATURED STOCK ARTICLE : Car Dealership Firm Challenging All-Time High - 5/25/2021 |
View all notes |
Set NEW NOTE alert |
Company Profile |
SEC
News |
Chart |
Request a new note
C
A
S
I |
MED
-
NYSE
Medifast Inc
SPECIALTY RETAIL - Specialty Retail, Other
|
$268.86
|
-3.81
-1.40% |
$270.56
|
154,938
133.57% of 50 DAV
50 DAV is 116,000
|
$336.99
-20.22%
|
5/11/2021
|
$285.72
|
PP = $279.56
|
|
MB = $293.54
|
Most Recent Note - 6/14/2021 5:18:20 PM
Y - Pulled back today for a 10th consecutive loss with near average volume. Color code is changed to yellow while testing the prior high in the $279 area which defines initial support to watch above its 50 DMA line ($271). More damaging losses would raise greater concerns.
>>> FEATURED STOCK ARTICLE : Halted 10-Session Losing Streak Near Prior High and 50 DMA - 6/15/2021 |
View all notes |
Set NEW NOTE alert |
Company Profile |
SEC
News |
Chart |
Request a new note
C
A
S
I |
CLFD
-
NASDAQ
Clearfield Inc
TELECOMMUNICATIONS - Cables / Satalite Equipment
|
$34.97
|
-0.44
-1.24% |
$35.90
|
119,563
87.27% of 50 DAV
50 DAV is 137,000
|
$43.64
-19.87%
|
6/4/2021
|
$40.01
|
PP = $40.36
|
|
MB = $42.38
|
Most Recent Note - 6/15/2021 4:12:17 PM
G - Fell abruptly from its 52-week high, and color code is changed to green after violating its 50 DMA line ($35.56) with 2 damaging losses on above average volume. Only a prompt rebound above the 50 DMA line would help its outlook improve. Prior low defines the next important near-term support in the $33 area. Fundamentals remain strong after it reported Mar '21 quarterly earnings +440% on +45% sales revenues versus the year ago period, continuing its strong earnings track record.
>>> FEATURED STOCK ARTICLE : Stalled and Found Support Above 50-Day Moving Average - 5/24/2021 |
View all notes |
Set NEW NOTE alert |
Company Profile |
SEC
News |
Chart |
Request a new note
C
A
S
I |
FSBW
-
NASDAQ
F S Bancorp
Banks-West/Southwest
|
$69.22
|
-1.19
-1.69% |
$70.92
|
14,425
120.21% of 50 DAV
50 DAV is 12,000
|
$73.62
-5.98%
|
5/18/2021
|
$70.16
|
PP = $73.72
|
|
MB = $77.41
|
Most Recent Note - 6/14/2021 5:14:27 PM
Y - This thinly-traded Bank is still perched within close striking distance of the pivot point cited based on its 3/08/21 high plus 10 cents. It has been consolidating above its 50 DMA line ($68.91) where it found prompt support during its ongoing ascent. Subsequent gains above the pivot point backed by at least +40% above average volume are needed to trigger a technical buy signal. Fundamentals remain strong.
>>> FEATURED STOCK ARTICLE : Thinly-Traded Bank Consolidating Above 50-Day Moving Average - 5/18/2021 |
View all notes |
Set NEW NOTE alert |
Company Profile |
SEC
News |
Chart |
Request a new note
C
A
S
I |
Symbol/Exchange
Company Name
Industry Group |
PRICE |
CHANGE
(%Change) |
Day High |
Volume
(% DAV)
(% 50 day avg vol) |
52 Wk Hi
% From Hi |
Featured
Date |
Price
Featured |
Pivot Featured |
|
Max Buy |
SMPL
-
NASDAQ
Simply Good Foods Co
Food-Confectionery
|
$35.84
|
+0.11
0.31% |
$36.02
|
474,696
94.37% of 50 DAV
50 DAV is 503,000
|
$36.96
-3.03%
|
12/28/2020
|
$30.40
|
PP = $31.44
|
|
MB = $33.01
|
Most Recent Note - 6/16/2021 1:09:51 PM
G - Rising into new high territory with ever-increasing volume behind today's 4th consecutive gain. Near-term support to watch is its 50 DMA line ($33.98) and the prior low ($31.09 on 5/18/21). Reported Feb '21 quarterly earnings +9% on +2% sales revenues versus the year ago period, below the +25% minimum earnings guideline (C criteria), raising fundamental concerns.
>>> FEATURED STOCK ARTICLE : Simply Wedging Into New High Territory - 6/14/2021 |
View all notes |
Set NEW NOTE alert |
Company Profile |
SEC
News |
Chart |
Request a new note
C
A
S
I |
QRVO
-
NASDAQ
"Qorvo, Inc"
ELECTRONICS - Semiconductor - Integrated Cir
|
$181.33
|
-0.38
-0.21% |
$183.50
|
783,979
71.52% of 50 DAV
50 DAV is 1,096,200
|
$201.68
-10.09%
|
4/1/2021
|
$190.48
|
PP = $191.92
|
|
MB = $201.52
|
Most Recent Note - 6/15/2021 4:28:58 PM
G - Sputtering below its 50 DMA line ($184) which has been acting as resistance. Its current Relative Strength Rating is 72, below the 80+ minimum for buy candidates.
>>> FEATURED STOCK ARTICLE : Rebound Above 50-Day Moving Average Helped Outlook - 6/2/2021 |
View all notes |
Set NEW NOTE alert |
Company Profile |
SEC
News |
Chart |
Request a new note
C
A
S
I |
SHOP
-
NYSE
Shopify Inc Cl A
Computer Sftwr-Enterprse
|
$1,449.27
|
+82.97
6.07% |
$1,461.00
|
3,141,696
240.74% of 50 DAV
50 DAV is 1,305,000
|
$1,499.75
-3.37%
|
6/16/2021
|
$1,343.80
|
PP = $1,499.85
|
|
MB = $1,574.84
|
Most Recent Note - 6/17/2021 12:47:49 PM
Y - Approaching its prior high with today's big gain, its 6th consecutive gain marked by ever-increasing volume. Color code was changed to yellow with new pivot point cited based on its 2/10/21 high plus 10 cents. Subsequent gains above the pivot point backed by at least +40% above average volume are needed to trigger a technical buy signal. Found support after dipping below its 200 DMA line during the choppy consolidation since dropped from the Featured Stocks list on 3/04/21. Rebound above the 50 DMA line helped its outlook improve. Its Relative Strength Rating of 79 remains just below the 80+ minimum guideline for buy candidates. Reported Mar '21 quarterly earnings +958% on +110% sales revenues versus the year ago period, continuing its strong earnings track record.
>>> FEATURED STOCK ARTICLE : Rebounding After Choppy 4-Month Consolidation - 6/16/2021 |
View all notes |
Set NEW NOTE alert |
Company Profile |
SEC
News |
Chart |
Request a new note
C
A
S
I |
YETI
-
NYSE
Yeti Holdings Inc
Leisure-Products
|
$88.65
|
-1.57
-1.74% |
$90.00
|
1,297,591
90.36% of 50 DAV
50 DAV is 1,436,000
|
$95.76
-7.42%
|
5/13/2021
|
$84.20
|
PP = $90.65
|
|
MB = $95.18
|
Most Recent Note - 6/15/2021 4:16:01 PM
Y - Volume totals have been cooling while hovering near its all-time high. Its 50 DMA line ($86.65) and prior highs in the $80 area define near-term support to watch on pullbacks. Reported Mar 21 quarterly earnings +245% on +42% sales revenues versus the year ago period, continuing its strong earnings track record.
>>> FEATURED STOCK ARTICLE : Hovering Near High After Finding Support at 50-Day Moving Average - 6/4/2021 |
View all notes |
Set NEW NOTE alert |
Company Profile |
SEC
News |
Chart |
Request a new note
C
A
S
I |
MRBK
-
NASDAQ
Meridian Corp
Banks-Northeast
|
$26.70
|
-0.08
-0.30% |
$27.21
|
46,677
172.88% of 50 DAV
50 DAV is 27,000
|
$29.18
-8.50%
|
5/18/2021
|
$25.58
|
PP = $28.06
|
|
MB = $29.46
|
Most Recent Note - 6/17/2021 6:28:02 PM
Y - Churning higher than average volume while still consolidating in a tight range above its 50 DMA line ($26.29). Stalled since reaching a new 52-week high when featured on 5/18/21. Reported Mar '21 earnings +323% on +93% sales revenues versus the year ago period, continuing its strong earnings track record. Recent low ($24.01 on 4/21/21) defines important near-term support where any violation may trigger a worrisome technical sell signal. Its Relative Strength Rating is 76, below the 80 minimum guideline.
>>> FEATURED STOCK ARTICLE : Stalled Yet Found Support at 50-Day Moving Average Line - 6/11/2021 |
View all notes |
Set NEW NOTE alert |
Company Profile |
SEC
News |
Chart |
Request a new note
C
A
S
I |
Symbol/Exchange
Company Name
Industry Group |
PRICE |
CHANGE
(%Change) |
Day High |
Volume
(% DAV)
(% 50 day avg vol) |
52 Wk Hi
% From Hi |
Featured
Date |
Price
Featured |
Pivot Featured |
|
Max Buy |
CLAR
-
NASDAQ
Clarus Corporation
Leisure-Products
|
$22.93
|
-0.84
-3.53% |
$23.53
|
416,309
237.89% of 50 DAV
50 DAV is 175,000
|
$26.07
-12.04%
|
5/12/2021
|
$21.40
|
PP = $19.73
|
|
MB = $20.72
|
Most Recent Note - 6/17/2021 6:12:59 PM
G - Encountering distributional pressure with today's 4th consecutive loss marked by ever-increasing volume. Still extended from the prior base, its 50 DMA line ($21.03) and prior high ($19.63 on 3/09/21) define support to watch. See the latest FSU analysis for more details and a new annotated graph.
>>> FEATURED STOCK ARTICLE : Encountering Distributional Pressure After Recent Rally - 6/17/2021 |
View all notes |
Set NEW NOTE alert |
Company Profile |
SEC
News |
Chart |
Request a new note
C
A
S
I |
AVTR
-
NYSE
Avantor Inc
Medical-Research Eqp/Svc
|
$34.87
|
+0.82
2.41% |
$35.19
|
5,723,814
146.28% of 50 DAV
50 DAV is 3,913,000
|
$34.50
1.07%
|
6/10/2021
|
$32.94
|
PP = $34.09
|
|
MB = $35.79
|
Most Recent Note - 6/17/2021 6:24:37 PM
Y - Posted a 2nd consecutive gain today backed by +45% above average volume triggering a technical buy signal. Prior highs in the $33 area define initial support to watch on pullbacks.
>>> FEATURED STOCK ARTICLE : Medical Research Firm Challenging Prior High - 6/10/2021 |
View all notes |
Set NEW NOTE alert |
Company Profile |
SEC
News |
Chart |
Request a new note
C
A
S
I |
|
|
|
THESE ARE NOT BUY RECOMMENDATIONS!
Comments contained in the body of this report are technical
opinions only. The material herein has been obtained
from sources believed to be reliable and accurate, however,
its accuracy and completeness cannot be guaranteed.
This site is not an investment advisor, hence it does
not endorse or recommend any securities or other investments.
Any recommendation contained in this report may not
be suitable for all investors and it is not to be deemed
an offer or solicitation on our part with respect to
the purchase or sale of any securities. All trademarks,
service marks and trade names appearing in this report
are the property of their respective owners, and are
likewise used for identification purposes only.
This report is a service available
only to active Paid Premium Members.
You may opt-out of receiving report notifications
at any time. Questions or comments may be submitted
by writing to Premium Membership Services 665 S.E. 10 Street, Suite 201 Deerfield Beach, FL 33441-5634 or by calling 1-800-965-8307
or 954-785-1121.
|
|
|