***Last / Change / Volume data in this table is the closing quote data***
Symbol/Exchange
Company Name
Industry Group |
PRICE |
CHANGE
(%Change) |
Day High |
Volume
(% DAV)
(% 50 day avg vol) |
52 Wk Hi
% From Hi |
Featured
Date |
Price
Featured |
Pivot Featured |
|
Max Buy |
 ABCB
-
NASDAQ
ABCB
-
NASDAQ
Ameris Bancorp
BANKING - Regional - Mid-Atlantic Banks
|
$53.74
|
-0.53
-0.98% |
$54.91
|
352,518
85.15% of 50 DAV
50 DAV is 414,000
|
$59.85
-10.21%
|
5/21/2021
|
$58.86
|
PP = $57.91
|
|
MB = $60.81
|
Most Recent Note - 6/10/2021 6:06:19 PM
Y - Testing support at its 50 DMA line ($54.02) with today's 3rd consecutive loss on light volume, still sputtering below the previously cited pivot point. More damaging losses would raise greater concerns and trigger a worrisome technical sell signal.
>>> FEATURED STOCK ARTICLE : Breakout to New All-Time High for Another Regional Bank - 5/21/2021 |
View all notes |
Set NEW NOTE alert |
Company Profile |
SEC
News |
Chart |
Request a new note
C
A
S
I |
SIVB
-
NASDAQ
S V B Financial Group
BANKING - Regional - Pacific Banks
|
$545.74
|
-16.05
-2.86% |
$559.24
|
633,469
153.01% of 50 DAV
50 DAV is 414,000
|
$608.84
-10.36%
|
4/23/2021
|
$579.70
|
PP = $577.16
|
|
MB = $606.02
|
 Most Recent Note - 6/14/2021 12:23:18 PM
G - Undercutting its 50 DMA line ($556.17) with today's 4th consecutive loss raising concerns and its color code is changed to green. A prompt rebound above its 50 DMA line is needed for its outlook to improve. Confirming gains above the pivot point backed by at least +40% above average volume are still needed to help clinch a convincing technical buy signal. Reported earnings +293% on +64% sales revenues for the Mar '21 quarter versus the year ago period, its 3rd strong comparison. Completed a new Public Offering on 3/24/21.
>>> FEATURED STOCK ARTICLE : Sputtering Since Featured Without Confirming Gains - 5/20/2021 |
View all notes |
Set NEW NOTE alert |
Company Profile |
SEC
News |
Chart |
Request a new note
C
A
S
I |
LOGI
-
NASDAQ
Logitech Intl Sa
COMPUTER HARDWARE - Computer Peripherals
|
$128.99
|
+0.75
0.58% |
$129.74
|
726,686
87.87% of 50 DAV
50 DAV is 827,000
|
$140.17
-7.98%
|
5/26/2021
|
$119.13
|
PP = $120.34
|
|
MB = $126.36
|
Most Recent Note - 6/11/2021 12:43:28 PM
G - Pulling back from its all-time high with today's 2nd consecutive gap down and loss on higher volume. It is extended from the previously noted base. Prior highs in the $120-117 area define support to watch on pullbacks along with its 50 DMA line ($115).
>>> FEATURED STOCK ARTICLE : Streak of Gains to New Highs Lacked Great Volume Conviction - 5/27/2021 |
View all notes |
Set NEW NOTE alert |
Company Profile |
SEC
News |
Chart |
Request a new note
C
A
S
I |
CROX
-
NASDAQ
Crocs Inc
CONSUMER NON-DURABLES - Textile - Apparel Footwear
|
$112.58
|
+3.94
3.63% |
$115.37
|
2,490,019
146.56% of 50 DAV
50 DAV is 1,699,000
|
$109.91
2.43%
|
6/14/2021
|
$112.64
|
PP = $110.01
|
|
MB = $115.51
|
Most Recent Note - 6/14/2021 12:00:48 PM
Y - Gapped up today for a new all-time high clearing a short 5-week base. Color code is changed to yellow with new pivot point cited based on its 5/10/21 high plus 10 cents. A gain and strong close above its pivot point backed by at least +40% above average volume may clinch a proper new (or add-on) technical buy signal. Its 50 DMA line ($95.64) defines initial support above prior highs in the $86 area.
>>> FEATURED STOCK ARTICLE : Encountered Distributional Pressure Late This Week - 5/28/2021 |
View all notes |
Set NEW NOTE alert |
Company Profile |
SEC
News |
Chart |
Request a new note
C
A
S
I |
RCKY
-
NASDAQ
Rocky Brands Inc
CONSUMER NON-DURABLES - Textile - Apparel Footwear
|
$53.68
|
-1.10
-2.01% |
$55.00
|
63,723
68.52% of 50 DAV
50 DAV is 93,000
|
$69.00
-22.20%
|
5/5/2021
|
$61.65
|
PP = $61.55
|
|
MB = $64.63
|
Most Recent Note - 6/14/2021 5:26:49 PM
G - Still sputtering below its 50 DMA line ($56.50). A rebound above that short-term average is needed for its outlook to improve. The prior low ($50.52 on 5/19/21) defines the next important support where any violation may trigger a more worrisome technical sell signal. Fundamentals remain strong.
>>> FEATURED STOCK ARTICLE : Still Sputtering After Slump Below 50-Day Moving Average - 6/7/2021 |
View all notes |
Set NEW NOTE alert |
Company Profile |
SEC
News |
Chart |
Request a new note
C
A
S
I |
Symbol/Exchange
Company Name
Industry Group |
PRICE |
CHANGE
(%Change) |
Day High |
Volume
(% DAV)
(% 50 day avg vol) |
52 Wk Hi
% From Hi |
Featured
Date |
Price
Featured |
Pivot Featured |
|
Max Buy |
CRL
-
NYSE
Charles River Labs Intl
DRUGS - Biotechnology
|
$355.33
|
+3.24
0.92% |
$355.69
|
257,994
37.61% of 50 DAV
50 DAV is 686,000
|
$354.92
0.12%
|
6/9/2021
|
$345.91
|
PP = $349.23
|
|
MB = $366.69
|
Most Recent Note - 6/9/2021 6:04:03 PM
Y - Posted a 5th consecutive gain with below average volume, wedging toward the prior high. Its 50 DMA line ($323) defines near-term support to watch on pullbacks. Color code is changed to yellow with new pivot point cited based on its 5/05/21 high plus 10 cents. Subsequent gains above the pivot point backed by at least +40% above average volume may trigger a new (or add-on) technical buy signal. Reported Mar '21 quarterly earnings +38% on +17% sales revenues versus the year ago period. Two of the past 3 quarterly comparisons have been above the +25% minimum earnings guideline (C criteria). See the latest FSU analysis for more details and a new annotated graph.
>>> FEATURED STOCK ARTICLE : Building New Base After Strong Quarterly Earnings Report - 6/9/2021 |
View all notes |
Set NEW NOTE alert |
Company Profile |
SEC
News |
Chart |
Request a new note
C
A
S
I |
GNRC
-
NYSE
Generac Hldgs Inc
Electrical-Power/Equipmt
|
$355.09
|
+5.91
1.69% |
$356.36
|
523,370
82.03% of 50 DAV
50 DAV is 638,000
|
$364.00
-2.45%
|
6/8/2021
|
$348.46
|
PP = $342.38
|
|
MB = $359.50
|
Most Recent Note - 6/14/2021 5:15:50 PM
Y - Posted a 3rd consecutive gain today with below average volume. Reported earnings +174% on +70% sales revenues for the Mar '21 quarter versus the year ago period, its 3rd strong quarterly comparison above the +25% minimum guideline (C criteria). Annual earnings (A criteria) growth has been strong and steady.
>>> FEATURED STOCK ARTICLE : Gap Up Gain With +118% Above Average Volume - 6/8/2021 |
View all notes |
Set NEW NOTE alert |
Company Profile |
SEC
News |
Chart |
Request a new note
C
A
S
I |
CAMT
-
NASDAQ
Camtek Ltd
ELECTRONICS - Scientific and Technical Instrum
|
$38.64
|
-0.17
-0.44% |
$39.24
|
253,193
79.62% of 50 DAV
50 DAV is 318,000
|
$40.47
-4.52%
|
4/28/2021
|
$35.03
|
PP = $35.34
|
|
MB = $37.11
|
Most Recent Note - 6/14/2021 5:19:55 PM
G - Stubbornly holding its ground near its 52-week high. It abruptly rebounded above its 50 DMA line ($33.25) after a deep pullback in recent weeks.
>>> FEATURED STOCK ARTICLE : Perched at 52-Week High After 4th Consecutive Gain - 6/1/2021 |
View all notes |
Set NEW NOTE alert |
Company Profile |
SEC
News |
Chart |
Request a new note
C
A
S
I |
ASML
-
NASDAQ
A S M L Holding N.V. NY
ELECTRONICS - Semiconductor Equipment and Mate
|
$709.33
|
+12.30
1.76% |
$709.63
|
635,946
71.21% of 50 DAV
50 DAV is 893,000
|
$704.78
0.65%
|
5/25/2021
|
$669.59
|
PP = $675.75
|
|
MB = $709.54
|
Most Recent Note - 6/10/2021 6:07:25 PM
Y - Hit another new all time high with light volume behind today's gain. Highlighted in yellow with pivot point cited based on its 4/26/21 high plus 10 cents. Subsequent gain and a strong close above its pivot point backed by at least +40% above average volume is needed to trigger a proper technical buy signal. Its 50 DMA line ($649) defines important near-term support to watch. Reported Mar '21 quarterly earnings +264% on +90% sales revenues versus the year-ago period. The 4 latest quarterly comparisons were above the +25% minimum earnings guideline (C criteria). Annual earnings history included a small downturn in FY '19. Dutch Electronics - Semiconductor Equipment firm made an impressive rally from a deep slump in March.
>>> FEATURED STOCK ARTICLE : Perched Near All-Time High After Short Base Above 50-Day Average - 5/26/2021 |
View all notes |
Set NEW NOTE alert |
Company Profile |
SEC
News |
Chart |
Request a new note
C
A
S
I |
BRKS
-
NASDAQ
Brooks Automation
ELECTRONICS - Semiconductor Equipment and Mate
|
$100.95
|
+1.33
1.34% |
$104.31
|
894,861
114.14% of 50 DAV
50 DAV is 784,000
|
$108.72
-7.15%
|
4/5/2021
|
$99.31
|
PP = $91.88
|
|
MB = $96.47
|
Most Recent Note - 6/9/2021 6:11:02 PM
G - Pulled back with below average volume testing its its 50 DMA line ($96.56) which defines important near-term support. More damaging losses below the recent low ($86.12 on 5/12/21) would raise serious concerns.
>>> FEATURED STOCK ARTICLE : Consolidating Above 50-Day Moving Average Line and Prior High - 6/3/2021 |
View all notes |
Set NEW NOTE alert |
Company Profile |
SEC
News |
Chart |
Request a new note
C
A
S
I |
Symbol/Exchange
Company Name
Industry Group |
PRICE |
CHANGE
(%Change) |
Day High |
Volume
(% DAV)
(% 50 day avg vol) |
52 Wk Hi
% From Hi |
Featured
Date |
Price
Featured |
Pivot Featured |
|
Max Buy |
OPY
-
NYSE
Oppenheimer Holdings Inc
FINANCIAL SERVICES - Investment Brokerage - Regiona
|
$51.11
|
+0.19
0.37% |
$51.46
|
117,617
120.02% of 50 DAV
50 DAV is 98,000
|
$52.45
-2.55%
|
6/7/2021
|
$48.74
|
PP = $52.55
|
|
MB = $55.18
|
Most Recent Note - 6/11/2021 5:43:11 PM
Y - Posted a solid gain with above average volume today. Color code was changed to yellow with new pivot point cited based on its 5/03/21 high plus 10 cents. Still perched near its 52-week high, consolidating in an orderly fashion above its 50 DMA line ($47.38). Subsequent gains above its pivot point backed by at least +40% may trigger a new (or add-on) technical buy signal. Fundamentals remain strong.
>>> FEATURED STOCK ARTICLE : Extended From Any Sound Base After Decent Rally - 5/17/2021 |
View all notes |
Set NEW NOTE alert |
Company Profile |
SEC
News |
Chart |
Request a new note
C
A
S
I |
MTH
-
NYSE
Meritage Homes Corp
MATERIALS and CONSTRUCTION - Residential Construction
|
$95.29
|
-3.31
-3.36% |
$99.12
|
501,125
127.71% of 50 DAV
50 DAV is 392,400
|
$120.19
-20.72%
|
5/12/2021
|
$108.84
|
PP = $117.16
|
|
MB = $123.02
|
Most Recent Note - 6/14/2021 5:25:14 PM
Sank further below its 50 DMA line ($102.70) with heavier volume behind today's damaging loss testing its 200 DMA line ($94.93). A prompt rebound above the 50 DMA line is needed for its outlook to improve. Relative Strength Rating has slumped to 37. It will be dropped from the Featured Stocks list tonight.
>>> FEATURED STOCK ARTICLE : Homebuilder Pulled Back After Hitting New High - 5/13/2021 |
View all notes |
Set NEW NOTE alert |
Company Profile |
SEC
News |
Chart |
Request a new note
C
A
S
I |
CRMT
-
NASDAQ
Americas Car-Mart Inc
SPECIALTY RETAIL - Auto Dealerships
|
$146.86
|
-2.52
-1.69% |
$151.16
|
47,586
96.72% of 50 DAV
50 DAV is 49,200
|
$177.45
-17.24%
|
5/25/2021
|
$159.80
|
PP = $165.10
|
|
MB = $173.36
|
Most Recent Note - 6/9/2021 6:06:42 PM
G - Color code is changed to green after slumping below its 50 DMA line ($151.76) with today's loss on above average volume raising concerns. More damaging losses below the prior low ($142) trigger a worrisome technical sell signal.
>>> FEATURED STOCK ARTICLE : Car Dealership Firm Challenging All-Time High - 5/25/2021 |
View all notes |
Set NEW NOTE alert |
Company Profile |
SEC
News |
Chart |
Request a new note
C
A
S
I |
MED
-
NYSE
Medifast Inc
SPECIALTY RETAIL - Specialty Retail, Other
|
$279.97
|
-9.52
-3.29% |
$291.00
|
115,822
99.85% of 50 DAV
50 DAV is 116,000
|
$336.99
-16.92%
|
5/11/2021
|
$285.72
|
PP = $279.56
|
|
MB = $293.54
|
Most Recent Note - 6/14/2021 5:18:20 PM
Y - Pulled back today for a 10th consecutive loss with near average volume. Color code is changed to yellow while testing the prior high in the $279 area which defines initial support to watch above its 50 DMA line ($271). More damaging losses would raise greater concerns.
>>> FEATURED STOCK ARTICLE : Held Ground Following Breakout Gain on Prior Session - 5/11/2021 |
View all notes |
Set NEW NOTE alert |
Company Profile |
SEC
News |
Chart |
Request a new note
C
A
S
I |
CLFD
-
NASDAQ
Clearfield Inc
TELECOMMUNICATIONS - Cables / Satalite Equipment
|
$36.50
|
-5.35
-12.78% |
$41.97
|
482,776
386.22% of 50 DAV
50 DAV is 125,000
|
$43.64
-16.36%
|
6/4/2021
|
$40.01
|
PP = $40.36
|
|
MB = $42.38
|
Most Recent Note - 6/14/2021 5:22:42 PM
Y - Fell abruptly from its 52-week high, testing its 50 DMA line ($35.49) with today's damaging loss on heavy volume. Prior low defines the next important near-term support in the $33 area. Fundamentals remain strong after it reported Mar '21 quarterly earnings +440% on +45% sales revenues versus the year ago period, continuing its strong earnings track record.
>>> FEATURED STOCK ARTICLE : Stalled and Found Support Above 50-Day Moving Average - 5/24/2021 |
View all notes |
Set NEW NOTE alert |
Company Profile |
SEC
News |
Chart |
Request a new note
C
A
S
I |
Symbol/Exchange
Company Name
Industry Group |
PRICE |
CHANGE
(%Change) |
Day High |
Volume
(% DAV)
(% 50 day avg vol) |
52 Wk Hi
% From Hi |
Featured
Date |
Price
Featured |
Pivot Featured |
|
Max Buy |
FSBW
-
NASDAQ
F S Bancorp
Banks-West/Southwest
|
$70.03
|
-0.67
-0.95% |
$70.58
|
6,961
58.01% of 50 DAV
50 DAV is 12,000
|
$73.62
-4.88%
|
5/18/2021
|
$70.16
|
PP = $73.72
|
|
MB = $77.41
|
Most Recent Note - 6/14/2021 5:14:27 PM
Y - This thinly-traded Bank is still perched within close striking distance of the pivot point cited based on its 3/08/21 high plus 10 cents. It has been consolidating above its 50 DMA line ($68.91) where it found prompt support during its ongoing ascent. Subsequent gains above the pivot point backed by at least +40% above average volume are needed to trigger a technical buy signal. Fundamentals remain strong.
>>> FEATURED STOCK ARTICLE : Thinly-Traded Bank Consolidating Above 50-Day Moving Average - 5/18/2021 |
View all notes |
Set NEW NOTE alert |
Company Profile |
SEC
News |
Chart |
Request a new note
C
A
S
I |
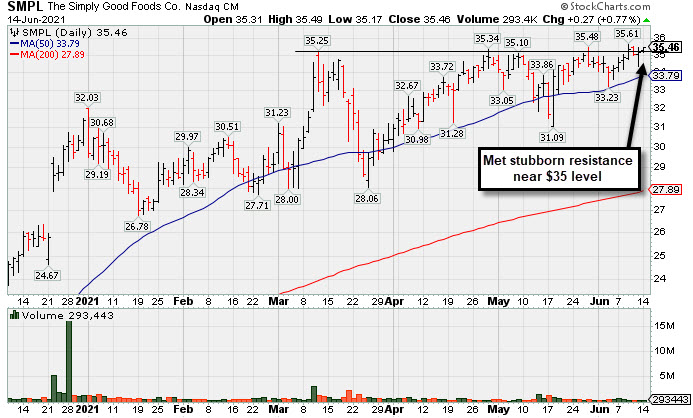
SMPL
-
NASDAQ
Simply Good Foods Co
Food-Confectionery
|
$35.46
|
+0.27
0.77% |
$35.49
|
293,443
58.11% of 50 DAV
50 DAV is 505,000
|
$35.61
-0.42%
|
12/28/2020
|
$30.40
|
PP = $31.44
|
|
MB = $33.01
|
Most Recent Note - 6/14/2021 5:13:10 PM
G - Posted a small gain today with light volume, quietly wedging into new high territory. Near-term support to watch is its 50 DMA line ($33.79) and the prior low ($31.09 on 5/18/21). Reported Feb '21 quarterly earnings +9% on +2% sales revenues versus the year ago period, below the +25% minimum earnings guideline (C criteria), raising fundamental concerns. See the latest FSU analysis for more details and a new annotated graph.
>>> FEATURED STOCK ARTICLE : Simply Wedging Into New High Territory - 6/14/2021 |
View all notes |
Set NEW NOTE alert |
Company Profile |
SEC
News |
Chart |
Request a new note
C
A
S
I |
QRVO
-
NASDAQ
"Qorvo, Inc"
ELECTRONICS - Semiconductor - Integrated Cir
|
$184.94
|
+1.63
0.89% |
$185.85
|
607,632
53.27% of 50 DAV
50 DAV is 1,140,700
|
$201.68
-8.30%
|
4/1/2021
|
$190.48
|
PP = $191.92
|
|
MB = $201.52
|
Most Recent Note - 6/10/2021 6:12:20 PM
G - Consolidating in a tight range near its 50 DMA line ($184). Its current Relative Strength Rating is 70, below the 80+ minimum for buy candidates.
>>> FEATURED STOCK ARTICLE : Rebound Above 50-Day Moving Average Helped Outlook - 6/2/2021 |
View all notes |
Set NEW NOTE alert |
Company Profile |
SEC
News |
Chart |
Request a new note
C
A
S
I |
YETI
-
NYSE
Yeti Holdings Inc
Leisure-Products
|
$94.46
|
-0.51
-0.54% |
$95.75
|
1,109,406
75.93% of 50 DAV
50 DAV is 1,461,000
|
$95.76
-1.36%
|
5/13/2021
|
$84.20
|
PP = $90.65
|
|
MB = $95.18
|
Most Recent Note - 6/11/2021 5:45:42 PM
Y - Perched at its all-time high following with today's gain with light volume. Its 50 DMA line ($85.84) and prior highs in the $80 area define near-term support to watch on pullbacks. Reported Mar 21 quarterly earnings +245% on +42% sales revenues versus the year ago period, continuing its strong earnings track record.
>>> FEATURED STOCK ARTICLE : Hovering Near High After Finding Support at 50-Day Moving Average - 6/4/2021 |
View all notes |
Set NEW NOTE alert |
Company Profile |
SEC
News |
Chart |
Request a new note
C
A
S
I |
MRBK
-
NASDAQ
Meridian Corp
Banks-Northeast
|
$26.71
|
-0.30
-1.11% |
$27.22
|
38,288
141.81% of 50 DAV
50 DAV is 27,000
|
$29.18
-8.46%
|
5/18/2021
|
$25.58
|
PP = $28.06
|
|
MB = $29.46
|
Most Recent Note - 6/11/2021 5:38:07 PM
Y - Still consolidating in a tight range above its 50 DMA line ($26.20). Stalled since reaching a new 52-week high when featured on 5/18/21. Reported Mar '21 earnings +323% on +93% sales revenues versus the year ago period, continuing its strong earnings track record. Recent low ($24.01 on 4/21/21) defines important near-term support where any violation may trigger a worrisome technical sell signal. Its Relative Strength Rating is 78, below the 80 minimum guideline. See the latest FSU analysis for more details and a new annotated graph.
>>> FEATURED STOCK ARTICLE : Stalled Yet Found Support at 50-Day Moving Average Line - 6/11/2021 |
View all notes |
Set NEW NOTE alert |
Company Profile |
SEC
News |
Chart |
Request a new note
C
A
S
I |
Symbol/Exchange
Company Name
Industry Group |
PRICE |
CHANGE
(%Change) |
Day High |
Volume
(% DAV)
(% 50 day avg vol) |
52 Wk Hi
% From Hi |
Featured
Date |
Price
Featured |
Pivot Featured |
|
Max Buy |
CLAR
-
NASDAQ
Clarus Corporation
Leisure-Products
|
$24.91
|
-0.55
-2.16% |
$25.42
|
124,765
72.12% of 50 DAV
50 DAV is 173,000
|
$26.07
-4.45%
|
5/12/2021
|
$21.40
|
PP = $19.73
|
|
MB = $20.72
|
Most Recent Note - 6/14/2021 4:57:44 PM
G - Perched near its 52-week high, very extended from the previously noted base. Its 50 DMA line ($20.69) and prior high ($19.63 on 3/09/21) define support to watch.
>>> FEATURED STOCK ARTICLE : 4 Volume-Driven Gains Into New High Territory - 5/12/2021 |
View all notes |
Set NEW NOTE alert |
Company Profile |
SEC
News |
Chart |
Request a new note
C
A
S
I |
AVTR
-
NYSE
Avantor Inc
Medical-Research Eqp/Svc
|
$33.34
|
-0.08
-0.24% |
$33.54
|
3,544,759
91.12% of 50 DAV
50 DAV is 3,890,000
|
$33.99
-1.91%
|
6/10/2021
|
$32.94
|
PP = $34.09
|
|
MB = $35.79
|
Most Recent Note - 6/10/2021 6:03:23 PM
Y - Finished strong and at the session high with +27% above average volume behind today's big gain after highlighted in yellow in the earlier mid-day report with a pivot point cited based on its 4/29/21 high plus 10 cents. Found support at its 50 DMA line during the recent consolidation. Subsequent gains above the pivot point backed by at least +40% are needed to trigger a proper technical buy signal. The Mar '21 quarter marked its 3rd consecutive quarterly comparison with earnings above the year ago period by at least +25% (C criteria). Annual earnings growth has been strong (A criteria). Following its $14 IPO on 5/17/19 it completed Secondary Offerings on 5/21/20, 8/21/20 and 11/09/20. See the latest FSU analysis for more details and a new annotated graph.
>>> FEATURED STOCK ARTICLE : Medical Research Firm Challenging Prior High - 6/10/2021 |
View all notes |
Set NEW NOTE alert |
Company Profile |
SEC
News |
Chart |
Request a new note
C
A
S
I |