You are not logged in.
This means you
CAN ONLY VIEW reports that were published prior to Thursday, March 20, 2025.
You
MUST UPGRADE YOUR MEMBERSHIP if you want to see any current reports.
AFTER MARKET UPDATE - THURSDAY, APRIL 5TH, 2018
Previous After Market Report Next After Market Report >>>
|
|
|
|
DOW |
+240.92 |
24,505.22 |
+0.99% |
|
Volume |
753,591,060 |
-12% |
|
Volume |
2,111,640,748 |
-6% |
|
NASDAQ |
+34.44 |
7,076.55 |
+0.49% |
|
Advancers |
2,129 |
73% |
|
Advancers |
1,822 |
63% |
|
S&P 500 |
+18.15 |
2,662.84 |
+0.69% |
|
Decliners |
776 |
27% |
|
Decliners |
1,078 |
37% |
|
Russell 2000 |
+11.26 |
1,542.93 |
+0.74% |
|
52 Wk Highs |
49 |
|
|
52 Wk Highs |
55 |
|
|
S&P 600 |
+9.41 |
951.47 |
+1.00% |
|
52 Wk Lows |
24 |
|
|
52 Wk Lows |
26 |
|
|
 |
Volume on Exchanges Was Lighter Again as Major Indices Rose
Kenneth J. Gruneisen - Passed the CAN SLIM® Master's Exam
Stocks closed higher Thursday. The Dow climbed 240 points to 24505 while the S&P 500 gained 18 points to 2662. The Nasdaq Composite was up 34 points to 7076. The volume totals reported were again lighter than the prior session totals on the NYSE and on the Nasdaq exchange, indicative of less institutional buying demand. Breadth was positive as advancers led decliners by nearly a 3-1 margin on the NYSE and by a 3-2 margin on the Nasdaq exchange. Leadership improved as there were 20 high-ranked companies from the Leaders List that made new 52-week highs and were listed on the BreakOuts Page, versus the total of 7 on the prior session. For the first time since March 13th the new 52-week highs totals outnumbered new 52-week lows totals on both the NYSE and the Nasdaq exchange. Charts used courtesy of www.stockcharts.com
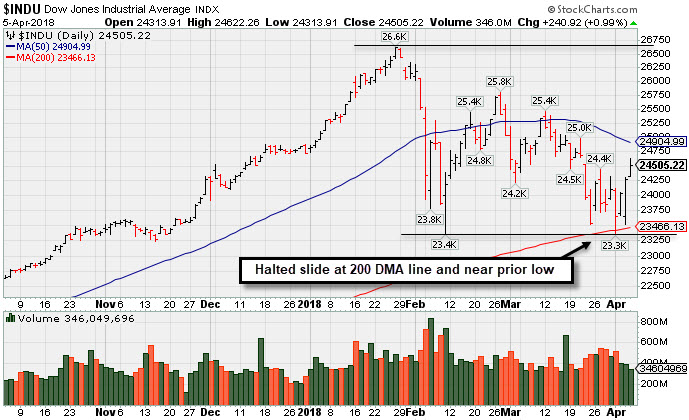 PICTURED: The Dow Jones Industrial Average halted its slide near the prior low and its 200-day moving average (DMA) line (23,466) defining important near-term support.
The major indices (M criteria) have shown weakness indicative of a correction. Once a new confirmed rally with a solid follow through day occurs it will be noted and new buying efforts will again be justified only when all key criteria of the fact-based investment system are satisfied. Investors following the fact-based investment system reduce market exposure during weak market periods by selling any stocks triggering technical sell signals on a case-by-case basis. The Featured Stocks Page provides the most timely analysis on high-ranked leaders.
The major averages advanced for a third straight day as trade tensions between the U.S. and China appeared to ease. Yesterday, stocks fell after China announced retaliatory tariffs, but later rebounded following news that officials from China and the U.S. were open to negotiations. On the data front, a release this morning revealed the U.S. trade deficit widened for the sixth consecutive month in February to $57.6 billion, its highest level in nine and a half years. In a separate release, weekly initial jobless claims increased to 242,000, the highest in nearly three months.
Ten of 11 sectors in the S&P 500 finished in positive territory, with Health Care the sole laggard. Energy and Materials shares led advancers with Chevron (CVX +2.45%) and Albemarle (ALB +4.55%) rising. Industrial shares also outperformed as Boeing (BA +2.74%) and Caterpillar (CAT +2.03%) rose. In earnings news, the agrochemical company Monsanto (MON +1.11%) rose despite missing second quarter profit forecasts.
Treasuries declined with the yield on the benchmark 10-year note rising three basis points to 2.83%. In commodities, NYMEX WTI crude added 0.4% to $63.64/barrel. COMEX Gold was off 0.9% to $1324.30/ounce amid a stronger dollar. |
 Kenneth J. Gruneisen started out as a licensed stockbroker in August 1987, a couple of months prior to the historic stock market crash that took the Dow Jones Industrial Average down -22.6% in a single day. He has published daily fact-based fundamental and technical analysis on high-ranked stocks online for two decades. Through FACTBASEDINVESTING.COM, Kenneth provides educational articles, news, market commentary, and other information regarding proven investment systems that work in good times and bad.
Comments contained in the body of this report are technical opinions only and are not necessarily those of Gruneisen Growth Corp. The material herein has been obtained from sources believed to be reliable and accurate, however, its accuracy and completeness cannot be guaranteed. Our firm, employees, and customers may effect transactions, including transactions contrary to any recommendation herein, or have positions in the securities mentioned herein or options with respect thereto. Any recommendation contained in this report may not be suitable for all investors and it is not to be deemed an offer or solicitation on our part with respect to the purchase or sale of any securities. |
|
 |
Energy-Linked Groups and Retail Index Led Gainers
Kenneth J. Gruneisen - Passed the CAN SLIM® Master's Exam
On Thursday the Retail Index ($RLX +1.79%) and the Broker/Dealer Index ($XBD +1.71%) outpaced the Bank Index ($BKX +0.67%) as the major indices rebounded from recent lows. Energy-linked groups were standout gainers as the Integrated Oil Index ($XOI +1.86%) and the Oil Services Index ($OSX +3.42%) both rallied. The Gold & Silver Index ($XAU +0.77%) also edged higher. The tech sector had a negative bias as the Semiconductor Index ($SOX -1.04%) and the Biotech Index ($BTK -0.96%) both fell while the Networking Index ($NWX +0.69%) edged higher. Charts courtesy wwwstockcharts.com
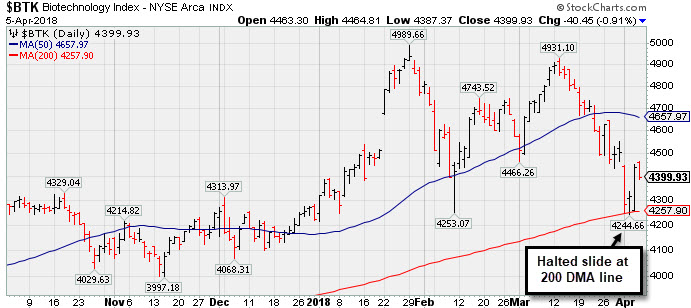 PICTURED: The Biotechnology Index ($BTK -0.96%) ended lower for the session. It recently found support at its 200-day moving average (DMA) line.
| Oil Services |
$OSX |
139.41 |
+4.60 |
+3.41% |
-6.78% |
| Integrated Oil |
$XOI |
1,353.53 |
+24.72 |
+1.86% |
+1.35% |
| Semiconductor |
$SOX |
1,305.24 |
-13.77 |
-1.04% |
+4.17% |
| Networking |
$NWX |
535.50 |
+3.67 |
+0.69% |
+9.17% |
| Broker/Dealer |
$XBD |
288.33 |
+4.84 |
+1.71% |
+8.70% |
| Retail |
$RLX |
1,944.63 |
+34.29 |
+1.79% |
+12.16% |
| Gold & Silver |
$XAU |
81.47 |
+0.63 |
+0.78% |
-4.46% |
| Bank |
$BKX |
107.99 |
+0.71 |
+0.66% |
+1.20% |
| Biotech |
$BTK |
4,397.55 |
-42.83 |
-0.96% |
+4.15% |
|
|
|
 |
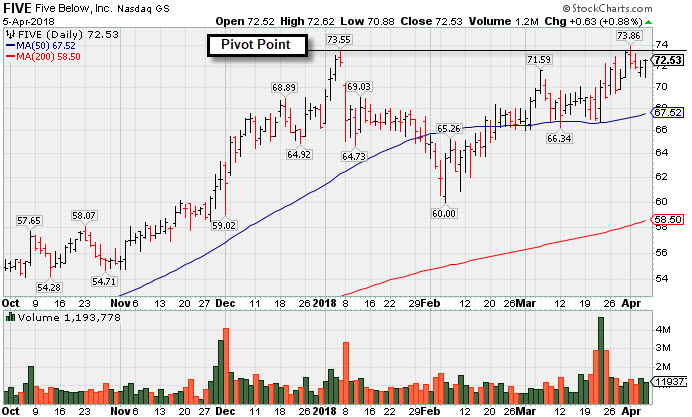
Quietly Hovering Near All-Time High
Kenneth J. Gruneisen - Passed the CAN SLIM® Master's Exam
Five Below Inc (FIVE +$0.63 or +0.88% to $72.53) is quietly perched near its all-time high. It touched a new high on 4/02/18 but finished lower. A new pivot point has been cited based on its 1/05/18 high plus 10 cents. Gains above the stock's pivot point with at least +40% above average volume are needed to trigger a proper new (or add-on) technical buy signal. The 50-day moving average (DMA) line ($67.52) and then the recent low ($60.00 on 2/06/18) define the next important near-term support levels to watch on pullbacks.
FIVE has made gradual progress since last shown in this FSU section on 3/09/18 with an annotated graph under the headline, "Retailer Rebounding Within Striking Distance of Prior High" . It has traded up as much as +29.2% since highlighted in yellow with new pivot point cited based on its 5/19/17 high plus 10 cents in the 10/06/17 mid-day report (read here).
Recently it reported earnings +31% on +30% sales revenues for the Jan '18 quarter, continuing its strong earnings track record. Fundamentals have been very strong as it reported earnings +80% on +29% sales revenues for the Oct '17 quarter. The Retail - Discount & Variety firm has a 98 Earnings Per Share Rating and matches the fact-based investment system's winning models with a good annual earnings (A criteria) track record.
FIVE had a choppy history since its $17 IPO in July 2012 and 3 subsequent Secondary Offerings. It has a small supply of 55.5 million shares outstanding (S criteria). Its current Timeliness Rating is B and its Sponsorship Rating is B.
The number of top-rated funds owning its shares rose from 465 in Sep '17 to 472 in Mar '18, a reassuring sign concerning the I criteria. Its current Up/Down Volume Ratio of 1.0 is an unbiased indication its shares have been neutral concerning accumulation/distribution over the past 50 days.
|
|
|
Color Codes Explained :
Y - Better candidates highlighted by our
staff of experts.
G - Previously featured
in past reports as yellow but may no longer be buyable under the
guidelines.
***Last / Change / Volume data in this table is the closing quote data***
Symbol/Exchange
Company Name
Industry Group |
PRICE |
CHANGE
(%Change) |
Day High |
Volume
(% DAV)
(% 50 day avg vol) |
52 Wk Hi
% From Hi |
Featured
Date |
Price
Featured |
Pivot Featured |
|
Max Buy |
SIVB
-
NASDAQ
S V B Financial Group
BANKING - Regional - Pacific Banks
|
$242.28
|
+1.47
0.61% |
$244.98
|
407,193
55.78% of 50 DAV
50 DAV is 730,000
|
$271.79
-10.86%
|
3/12/2018
|
$267.79
|
PP = $263.19
|
|
MB = $276.35
|
Most Recent Note - 4/3/2018 6:43:17 PM
G - Sputtering near the prior low ($226.61 on 2/06/18) defining important near-term support. Only a prompt rebound above the 50 DMA line ($251.22) would help its outlook improve.
>>> FEATURED STOCK ARTICLE : Endured Distributional Pressure After Wedging Higher - 3/12/2018 |
View all notes |
Set NEW NOTE alert |
Company Profile |
SEC
News |
Chart |
Request a new note
C
A
S
I |
TPL
-
NYSE
Texas Pacific Land Trust
FINANCIAL SERVICES - Diversified Investments
|
$521.77
|
+4.78
0.92% |
$540.00
|
20,081
143.44% of 50 DAV
50 DAV is 14,000
|
$569.99
-8.46%
|
2/20/2018
|
$517.00
|
PP = $569.99
|
|
MB = $598.49
|
Most Recent Note - 4/3/2018 6:46:15 PM
G - Meeting resistance, but a rebound above the 50 DMA line ($517.78) is needed for its outlook to improve. Recent lows ($480) define important support where damaging losses may trigger a worrisome technical sell signal.
>>> FEATURED STOCK ARTICLE : Slump Under 50-Day Average Line Hurt Near Term Outlook - 3/23/2018 |
View all notes |
Set NEW NOTE alert |
Company Profile |
SEC
News |
Chart |
Request a new note
C
A
S
I |
LMAT
-
NASDAQ
Lemaitre Vascular Inc
Medical-Products
|
$37.89
|
-0.03
-0.08% |
$38.39
|
97,114
71.41% of 50 DAV
50 DAV is 136,000
|
$39.88
-4.99%
|
3/19/2018
|
$36.77
|
PP = $39.98
|
|
MB = $41.98
|
Most Recent Note - 4/4/2018 5:44:32 PM
Y - Posted a solid gain today with above average volume, rising within striking distance of the new pivot point cited based on its 10/20/17 high plus 10 cents. Subsequent volume-driven gains for new highs are needed to trigger a technical buy signal. Found support recently near its 50 DMA line ($35.56).
>>> FEATURED STOCK ARTICLE : Rebounding Near High After Choppy Consolidation - 3/19/2018 |
View all notes |
Set NEW NOTE alert |
Company Profile |
SEC
News |
Chart |
Request a new note
C
A
S
I |
DPZ
-
NYSE
Dominos Pizza Inc
WHOLESALE - Food Wholesale
|
$235.79
|
+4.34
1.88% |
$236.24
|
602,153
59.62% of 50 DAV
50 DAV is 1,010,000
|
$236.93
-0.48%
|
2/20/2018
|
$224.86
|
PP = $222.01
|
|
MB = $233.11
|
Most Recent Note - 4/4/2018 10:03:47 AM
Y - Gapped down today. There was a "negative reversal" on 4/02/18 after touching a new all-time high. Stalled soon after highlighted in the 2/20/18 mid-day report with pivot point cited based on its 1/25/18 high plus 10 cents. Its 50 DMA line ($222) defines near-term support to watch.
>>> FEATURED STOCK ARTICLE : Popular Pizza Firm Perched Near All Time High - 3/21/2018 |
View all notes |
Set NEW NOTE alert |
Company Profile |
SEC
News |
Chart |
Request a new note
C
A
S
I |
FIVE
-
NASDAQ
Five Below Inc
Retail-DiscountandVariety
|
$72.53
|
+0.63
0.88% |
$72.62
|
1,193,778
101.95% of 50 DAV
50 DAV is 1,171,000
|
$73.86
-1.80%
|
3/9/2018
|
$68.58
|
PP = $73.65
|
|
MB = $77.33
|
 Most Recent Note - 4/5/2018 5:03:59 PM
Y - Hovering near its all-time high. Reported earnings +31% on +30% sales revenues for the Jan '18 quarter, continuing its strong earnings track record. New pivot point was cited based on its 1/05/18 high plus 10 cents. Subsequent volume-driven gains above the pivot point may trigger a new (or add-on) technical buy signal. See the latest FSU analysis for more details and a new annotated graph.
>>> FEATURED STOCK ARTICLE : Quietly Hovering Near All-Time High - 4/5/2018 |
View all notes |
Set NEW NOTE alert |
Company Profile |
SEC
News |
Chart |
Request a new note
C
A
S
I |
Symbol/Exchange
Company Name
Industry Group |
PRICE |
CHANGE
(%Change) |
Day High |
Volume
(% DAV)
(% 50 day avg vol) |
52 Wk Hi
% From Hi |
Featured
Date |
Price
Featured |
Pivot Featured |
|
Max Buy |
SPLK
-
NASDAQ
Splunk Inc
Computer Sftwr-Database
|
$99.45
|
+0.23
0.23% |
$101.15
|
1,448,125
71.34% of 50 DAV
50 DAV is 2,030,000
|
$112.66
-11.73%
|
2/15/2018
|
$96.06
|
PP = $93.68
|
|
MB = $98.36
|
Most Recent Note - 4/4/2018 10:01:41 AM
G - Gapped down today undercutting its 50 DMA ($97.29) line and slumping below the prior high in the $97 area raising concerns and triggering a technical sell signal. Color code is changed to green. Only a prompt rebound above the 50 DMA line would help it outlook improve.
>>> FEATURED STOCK ARTICLE : Extended After Rallying from Secondary Buy Point - 3/20/2018 |
View all notes |
Set NEW NOTE alert |
Company Profile |
SEC
News |
Chart |
Request a new note
C
A
S
I |
PAYC
-
NYSE
Paycom Software Inc
COMPUTER SOFTWARE and SERVICES - Application Software
|
$108.60
|
+0.73
0.68% |
$110.13
|
539,972
68.09% of 50 DAV
50 DAV is 793,000
|
$115.48
-5.96%
|
2/15/2018
|
$95.01
|
PP = $93.61
|
|
MB = $98.29
|
Most Recent Note - 4/4/2018 5:42:20 PM
G - Extended from any sound base and consolidating above its 50 DMA line ($99.40) which defines near-term support above prior highs in the $93 area. Fundamentals remain strong. See the latest FSU analysis for more details and a new annotated graph.
>>> FEATURED STOCK ARTICLE : Pulling Back After Negative Reversal at All-Time High Last Week - 4/4/2018 |
View all notes |
Set NEW NOTE alert |
Company Profile |
SEC
News |
Chart |
Request a new note
C
A
S
I |
GRUB
-
NYSE
Grubhub Inc
COMPUTER SOFTWARE and SERVICES - Technical and System Software
|
$100.18
|
+0.65
0.65% |
$101.25
|
1,376,778
68.70% of 50 DAV
50 DAV is 2,004,000
|
$112.41
-10.88%
|
6/21/2017
|
$47.33
|
PP = $46.94
|
|
MB = $49.29
|
Most Recent Note - 4/4/2018 10:05:25 AM
G - Sputtering near its 50 DMA line ($93.96) which defines near-term support. More damaging losses would raise greater concerns.
>>> FEATURED STOCK ARTICLE : Very Extended and Enduring Distributional Pressure - 3/29/2018 |
View all notes |
Set NEW NOTE alert |
Company Profile |
SEC
News |
Chart |
Request a new note
C
A
S
I |
HQY
-
NASDAQ
Healthequity Inc
COMPUTER SOFTWARE and SERVICES - Healthcare Information Service
|
$63.62
|
+0.51
0.81% |
$64.20
|
469,276
59.93% of 50 DAV
50 DAV is 783,000
|
$68.75
-7.46%
|
2/20/2018
|
$56.37
|
PP = $55.41
|
|
MB = $58.18
|
Most Recent Note - 4/3/2018 6:39:48 PM
G - Still hovering near its all-time high, extended from any sound base. Prior highs in the $55 area define initial support along with its 50 DMA line.
>>> FEATURED STOCK ARTICLE : Bullish Action Followed Latest Earnings Report - 3/22/2018 |
View all notes |
Set NEW NOTE alert |
Company Profile |
SEC
News |
Chart |
Request a new note
C
A
S
I |
LOB
-
NASDAQ
Live Oak Bancshares Inc
Banks-Southeast
|
$29.35
|
+0.85
2.98% |
$29.45
|
185,095
125.06% of 50 DAV
50 DAV is 148,000
|
$30.05
-2.33%
|
3/16/2018
|
$28.63
|
PP = $28.30
|
|
MB = $29.72
|
Most Recent Note - 4/5/2018 5:10:05 PM
Y - Posted a 3rd consecutive gain today with +25% above average volume, rising above its pivot point. After testing its 50 DMA line ($27.24) any more damaging losses would raise greater concerns.
>>> FEATURED STOCK ARTICLE : Tallied Volume-Driven Gain for New High - 3/16/2018 |
View all notes |
Set NEW NOTE alert |
Company Profile |
SEC
News |
Chart |
Request a new note
C
A
S
I |
Symbol/Exchange
Company Name
Industry Group |
PRICE |
CHANGE
(%Change) |
Day High |
Volume
(% DAV)
(% 50 day avg vol) |
52 Wk Hi
% From Hi |
Featured
Date |
Price
Featured |
Pivot Featured |
|
Max Buy |
PYPL
-
NASDAQ
Paypal Holdings Inc
Finance-CrdtCard/PmtPr
|
$76.95
|
+2.17
2.90% |
$77.82
|
9,549,066
91.38% of 50 DAV
50 DAV is 10,450,000
|
$86.32
-10.85%
|
2/1/2018
|
$80.35
|
PP = $79.49
|
|
MB = $83.46
|
Most Recent Note - 4/5/2018 5:08:17 PM
G - Gapped up today, however a rebound above its 50 DMA line ($78.75) is still needed for its outlook to improve. Halted its slide above the prior low ($71.63 on 2/09/18) which defines the next important support level.
>>> FEATURED STOCK ARTICLE : Sputtering Below 50-Day Moving Average Again - 3/27/2018 |
View all notes |
Set NEW NOTE alert |
Company Profile |
SEC
News |
Chart |
Request a new note
C
A
S
I |
OLLI
-
NASDAQ
Ollie's Bargain Outlet
Retail-DiscountandVariety
|
$59.45
|
-1.00
-1.65% |
$60.08
|
4,816,235
951.83% of 50 DAV
50 DAV is 506,000
|
$62.05
-4.19%
|
11/21/2017
|
$46.78
|
PP = $47.00
|
|
MB = $49.35
|
Most Recent Note - 4/5/2018 12:33:29 PM
G - Reported earnings +31% on +26% sales revenues for the Jan '18 quarter, continuing its strong earnings track record. Pulled back from its all-time high yet found prompt support after undercutting its 50 DMA line ($57.97) and nearly testing the prior low ($54.44 on 3/09/18).
>>> FEATURED STOCK ARTICLE : Bargain Outlet's Shares Perched Near All-Time Price High - 3/13/2018 |
View all notes |
Set NEW NOTE alert |
Company Profile |
SEC
News |
Chart |
Request a new note
C
A
S
I |
WB
-
NASDAQ
Weibo Corp Cl A Ads
INTERNET - Content
|
$116.13
|
-0.40
-0.34% |
$120.60
|
1,231,100
60.26% of 50 DAV
50 DAV is 2,043,000
|
$142.12
-18.29%
|
1/16/2018
|
$126.33
|
PP = $122.21
|
|
MB = $128.32
|
Most Recent Note - 4/2/2018 5:09:33 PM
G - Still sputtering below its 50 DMA line ($129) after damaging volume-driven losses. A rebound above that short-term average is needed for its outlook to improve.
>>> FEATURED STOCK ARTICLE : Recent Consolidation is Not a New Base of Sufficient Length - 3/8/2018 |
View all notes |
Set NEW NOTE alert |
Company Profile |
SEC
News |
Chart |
Request a new note
C
A
S
I |
SQ
-
NYSE
Square Inc Cl A
Finance-CrdtCard/PmtPr
|
$48.02
|
+0.35
0.73% |
$48.88
|
9,307,004
61.63% of 50 DAV
50 DAV is 15,102,000
|
$58.46
-17.86%
|
3/5/2018
|
$49.70
|
PP = $49.66
|
|
MB = $52.14
|
Most Recent Note - 4/4/2018 9:58:59 AM
G - Gapped down today slumping below its 50 DMA line ($47.50) and below prior highs in the $47-49 area raising greater concerns and triggering technical sell signals. Color code is changed to green. Only a prompt rebound above the 50 DMA line would help its outlook improve. See the latest FSU analysis for more details and an annotated graph.
>>> FEATURED STOCK ARTICLE : Slumped Back Into Prior Base Testing 50-Day Average - 4/2/2018 |
View all notes |
Set NEW NOTE alert |
Company Profile |
SEC
News |
Chart |
Request a new note
C
A
S
I |
SEND
-
NYSE
Sendgrid Inc
INTERNET - Content
|
$24.54
|
-0.12
-0.49% |
$25.80
|
810,260
358.52% of 50 DAV
50 DAV is 226,000
|
$32.03
-23.38%
|
3/6/2018
|
$28.00
|
PP = $28.37
|
|
MB = $29.79
|
Most Recent Note - 4/4/2018 9:56:22 AM
G - Gapped down and violated its 50 DMA line triggering a technical sell signal with a damaging loss today after announcing a Secondary Offering. Color code is changed to green. Disciplined investors always limit losses by selling any stock that falls more than -7% from their purchase price. See the latest FSU analysis for more details and an annotated graph.
>>> FEATURED STOCK ARTICLE : Slumped Into Prior Base Testing 50-Day Average - 4/3/2018 |
View all notes |
Set NEW NOTE alert |
Company Profile |
SEC
News |
Chart |
Request a new note
C
A
S
I |
Symbol/Exchange
Company Name
Industry Group |
PRICE |
CHANGE
(%Change) |
Day High |
Volume
(% DAV)
(% 50 day avg vol) |
52 Wk Hi
% From Hi |
Featured
Date |
Price
Featured |
Pivot Featured |
|
Max Buy |
|
|
|
THESE ARE NOT BUY RECOMMENDATIONS!
Comments contained in the body of this report are technical
opinions only. The material herein has been obtained
from sources believed to be reliable and accurate, however,
its accuracy and completeness cannot be guaranteed.
This site is not an investment advisor, hence it does
not endorse or recommend any securities or other investments.
Any recommendation contained in this report may not
be suitable for all investors and it is not to be deemed
an offer or solicitation on our part with respect to
the purchase or sale of any securities. All trademarks,
service marks and trade names appearing in this report
are the property of their respective owners, and are
likewise used for identification purposes only.
This report is a service available
only to active Paid Premium Members.
You may opt-out of receiving report notifications
at any time. Questions or comments may be submitted
by writing to Premium Membership Services 665 S.E. 10 Street, Suite 201 Deerfield Beach, FL 33441-5634 or by calling 1-800-965-8307
or 954-785-1121.
|
|
|