You are not logged in.
This means you
CAN ONLY VIEW reports that were published prior to Sunday, October 20, 2024.
You
MUST UPGRADE YOUR MEMBERSHIP if you want to see any current reports.
AFTER MARKET UPDATE - TUESDAY, MARCH 27TH, 2018
Previous After Market Report Next After Market Report >>>
|
|
|
|
DOW |
-344.89 |
23,857.71 |
-1.43% |
|
Volume |
935,577,690 |
+4% |
|
Volume |
2,310,407,610 |
-1% |
|
NASDAQ |
-211.73 |
7,008.81 |
-2.93% |
|
Advancers |
958 |
32% |
|
Advancers |
675 |
23% |
|
S&P 500 |
-45.93 |
2,612.62 |
-1.73% |
|
Decliners |
2,029 |
68% |
|
Decliners |
2,274 |
77% |
|
Russell 2000 |
-30.15 |
1,513.57 |
-1.95% |
|
52 Wk Highs |
38 |
|
|
52 Wk Highs |
54 |
|
|
S&P 600 |
-15.89 |
927.86 |
-1.68% |
|
52 Wk Lows |
126 |
|
|
52 Wk Lows |
90 |
|
|
 |
Breadth Negative as Indices Endure More Distributional Pressure
Kenneth J. Gruneisen - Passed the CAN SLIM® Master's Exam
Stocks finished lower Tuesday. The Dow lost 344 points to 23857 while the S&P 500 fell 45 points to 2612. The Nasdaq Composite declined 211 points to 7008. The volume totals reported were mixed, higher than the prior session total on the NYSE and slightly lower on the Nasdaq exchange. Breadth was solidly negative as decliners led advancers by more than a 2-1 margin on the NYSE and more than 3-1 on the Nasdaq exchange. There were 19 high-ranked companies from the Leaders List that made new 52-week highs and were listed on the BreakOuts Page, versus the total of 9 on the prior session. New 52-week lows totals again solidly outnumbered new 52-week highs totals on the NYSE and on the Nasdaq exchange. Charts used courtesy of www.stockcharts.com
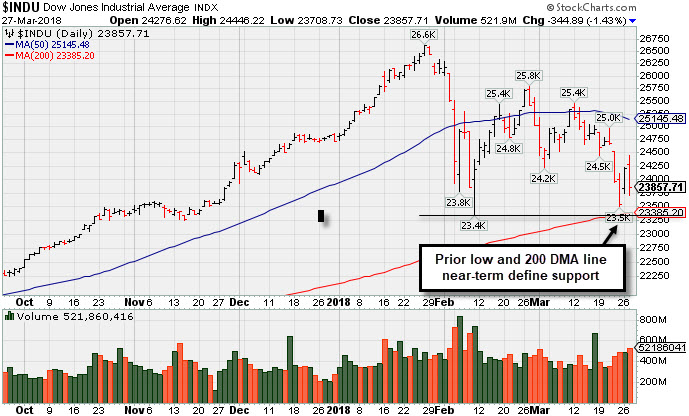 PICTURED: The Dow Jones Industrial Average fell toward its prior low and 200-day moving average (DMA) line. It ended the session -10.4% off its record high hit on March 13th. The prior low and 200 DMA line define important near-term support.
The major indices (M criteria) prior uptrend has come under greater pressure in the past week. New buying efforts are only justified when all key criteria of the fact-based investment system are satisfied. The Featured Stocks Page provides the most timely analysis on high-ranked leaders that are noteworthy and action worthy.
The major averages retreated as a slide in the Tech sector erased earlier gains. The Dow had risen as much as 240 points before turning sharply negative in afternoon trading. On the data front, a report from the Conference Board showed U.S. Consumer Confidence fell from an 18-year high in March. Meanwhile, S&P CoreLogic Case-Shiller 20-city home price index showed a higher than expected increase.
Seven of 11 sectors of the S&P 500 finished in negative with Tech and Financial shares lagging. Facebook (FB -4.92%) dropped and closed near its early-July 2017 level amid news CEO Mark Zuckerberg will testify before Congress regarding the mishandling of user data. Nvidia (NVDA -7.76%) fell and violated its 50 DMA line as the company announced suspension of their self-driving tests after the recent Uber fatality. In other corporate news, General Electric (GE +4.27%) rose amid speculation that Warren Buffett’s Berkshire Hathaway (BRKB -1.60%) is building a stake in the company. In M&A news, GlaxoSmithKline (GSK +2.56%) rose after the pharmaceutical company announced it will buy a 36.5% stake in Novartis’s consumer healthcare joint venture.
Treasuries strengthen along the curve, with the yield on the benchmark 10-year note down seven basis points to 2.78%. In commodities, NYMEX WTI crude lost 1.3% to $64.72/barrel. COMEX Gold fell 0.8% to $1343.90/ounce amid a stronger dollar. |
 Kenneth J. Gruneisen started out as a licensed stockbroker in August 1987, a couple of months prior to the historic stock market crash that took the Dow Jones Industrial Average down -22.6% in a single day. He has published daily fact-based fundamental and technical analysis on high-ranked stocks online for two decades. Through FACTBASEDINVESTING.COM, Kenneth provides educational articles, news, market commentary, and other information regarding proven investment systems that work in good times and bad.
Comments contained in the body of this report are technical opinions only and are not necessarily those of Gruneisen Growth Corp. The material herein has been obtained from sources believed to be reliable and accurate, however, its accuracy and completeness cannot be guaranteed. Our firm, employees, and customers may effect transactions, including transactions contrary to any recommendation herein, or have positions in the securities mentioned herein or options with respect thereto. Any recommendation contained in this report may not be suitable for all investors and it is not to be deemed an offer or solicitation on our part with respect to the purchase or sale of any securities. |
|
 |
Financial, Retail, Tech, and Commodity-Linked Groups Fell
Kenneth J. Gruneisen - Passed the CAN SLIM® Master's Exam
On Tuesday financial shares retreated as the Broker/Dealer Index ($XBD -1.70%) and Bank Index ($BKX -2.42%) both ended solidly lower. The Retail Index ($RLX -2.92%) also fell. The Semiconductor Index ($SOX -3.78%), Networking Index ($NWX -2.01%), and the Biotechnology Index ($BTK -3.26%) suffered unanimous losses. Commodity linked groups had a negative bias as the Gold & Silver Index ($XAU -1.52%), Oil Services Index ($OSX -2.04%), and Integrated Oil Index ($XOI -1.19%) each ended lower. Charts courtesy wwwstockcharts.com
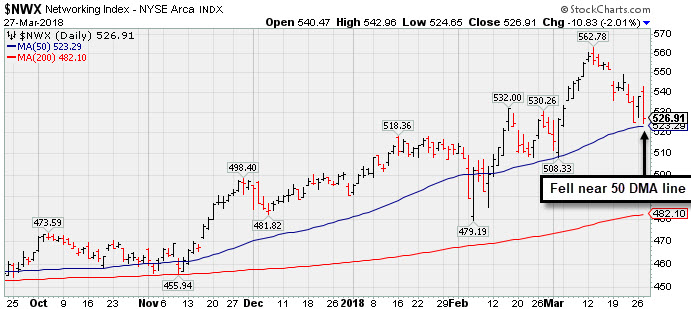 PICTURED: The Networking Index ($NWX -2.01%) has slumped near its 50-day moving average (DMA) line.
| Oil Services |
$OSX |
135.22 |
-2.81 |
-2.04% |
-9.58% |
| Integrated Oil |
$XOI |
1,323.30 |
-15.99 |
-1.19% |
-0.92% |
| Semiconductor |
$SOX |
1,327.94 |
-52.16 |
-3.78% |
+5.98% |
| Networking |
$NWX |
526.91 |
-10.83 |
-2.01% |
+7.42% |
| Broker/Dealer |
$XBD |
278.85 |
-4.83 |
-1.70% |
+5.13% |
| Retail |
$RLX |
1,941.57 |
-58.33 |
-2.92% |
+11.99% |
| Gold & Silver |
$XAU |
81.25 |
-1.25 |
-1.52% |
-4.71% |
| Bank |
$BKX |
105.05 |
-2.61 |
-2.42% |
-1.56% |
| Biotech |
$BTK |
4,476.03 |
-151.01 |
-3.26% |
+6.01% |
|
|
|
 |
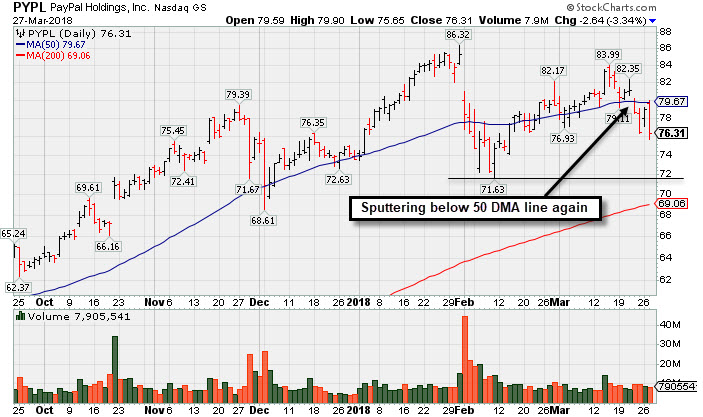
Sputtering Below 50-Day Moving Average Again
Kenneth J. Gruneisen - Passed the CAN SLIM® Master's Exam
Paypal Holdings Inc (PYPL -$2.64 or -3.34% to $76.31) met resistance and slumped further below its 50-day moving average (DMA) line ($79.67) with a big loss on light volume today. The prior low ($71.63 on 2/09/18) defines the next important support level where a violation would raise concerns and trigger a more worrisome technical sell signal.
Fundamentals remain strong. It was last shown in this FSU section on 2/26/18 with an annotated graph under the headline, "Quietly Consolidating Back Above 50-Day Moving Average". It was highlighted in yellow in the 2/01/18 mid-day report (read here) while testing support at prior highs and its 10 week moving average line.
Sales revenues rose by +17%, +18%, +21%, and +26% in the Mar, Jun, Sep, Dec '17 quarters, respectively, versus the year ago periods. This is very encouraging sales revenues and earnings growth rate acceleration in sequential quarterly comparisons, making it a better match with the fact-based investment system's winning models. Its annual earnings (A criteria) history has been very strong and steady. It reported earnings +31% on +26% sales revenues for the Dec '17 quarter, its 3rd consecutive quarterly earnings increase above the +25% minimum guideline (C criteria).
The high-ranked Finance - Credit Card/Payment Processing firm saw the number of top-rated funds owning its shares rise from 2,054 in Mar '17 to 2,413 in Dec '17, a reassuring sign concerning the I criteria. Its current Up/Down Volume Ratio of 1.0 is an unbiased indication its shares have been neutral concerning accumulation/distribution over the past 50 days. It has a Timeliness Rating of A and Sponsorship Rating of B. Charts courtesy wwwstockcharts.com
 |
|
|
Color Codes Explained :
Y - Better candidates highlighted by our
staff of experts.
G - Previously featured
in past reports as yellow but may no longer be buyable under the
guidelines.
***Last / Change / Volume data in this table is the closing quote data***
Symbol/Exchange
Company Name
Industry Group |
PRICE |
CHANGE
(%Change) |
Day High |
Volume
(% DAV)
(% 50 day avg vol) |
52 Wk Hi
% From Hi |
Featured
Date |
Price
Featured |
Pivot Featured |
|
Max Buy |
SIVB
-
NASDAQ
S V B Financial Group
BANKING - Regional - Pacific Banks
|
$239.21
|
-10.26
-4.11% |
$250.93
|
617,654
90.17% of 50 DAV
50 DAV is 685,000
|
$271.79
-11.99%
|
3/12/2018
|
$267.79
|
PP = $263.19
|
|
MB = $276.35
|
 Most Recent Note - 3/27/2018 4:02:57 PM
G - Ended near the session low today, and it met resistance after violating its 50 DMA line ($252) triggering a technical sell signal. Only a prompt rebound above the 50 DMA line would help its outlook improve.
>>> FEATURED STOCK ARTICLE : Endured Distributional Pressure After Wedging Higher - 3/12/2018 |
View all notes |
Set NEW NOTE alert |
Company Profile |
SEC
News |
Chart |
Request a new note
C
A
S
I |
TPL
-
NYSE
Texas Pacific Land Trust
FINANCIAL SERVICES - Diversified Investments
|
$495.07
|
-8.67
-1.72% |
$505.00
|
18,103
120.69% of 50 DAV
50 DAV is 15,000
|
$569.99
-13.14%
|
2/20/2018
|
$517.00
|
PP = $569.99
|
|
MB = $598.49
|
Most Recent Note - 3/23/2018 5:09:25 PM
G - Color code was changed to green after slumping and closing below its 50 DMA line. A prompt rebound above the 50 DMA line is needed for its outlook to improve. The prior low is the next important support level. Reported earnings +29% on +118% sales revenues for the Dec '17 quarter. See the latest FSU analysis for more details and a new annotated graph.
>>> FEATURED STOCK ARTICLE : Slump Under 50-Day Average Line Hurt Near Term Outlook - 3/23/2018 |
View all notes |
Set NEW NOTE alert |
Company Profile |
SEC
News |
Chart |
Request a new note
C
A
S
I |
YY
-
NASDAQ
YY Inc
INTERNET - Internet Service Providers
|
$103.24
|
-13.96
-11.91% |
$118.97
|
3,498,211
198.76% of 50 DAV
50 DAV is 1,760,000
|
$142.97
-27.79%
|
12/29/2017
|
$113.06
|
PP = $123.58
|
|
MB = $129.76
|
Most Recent Note - 3/27/2018 3:48:30 PM
Violating the prior low ($109.06 on 2/09/18) with a big volume-driven loss today triggering a more worrisome technical sell signal. It will be dropped from the Featured Stocks list tonight. A rebound above the 50 DMA line ($126) is needed for its outlook to improve.
>>> FEATURED STOCK ARTICLE : Earnings News Due Next Week for Chinese Social Platform - 2/27/2018 |
View all notes |
Set NEW NOTE alert |
Company Profile |
SEC
News |
Chart |
Request a new note
C
A
S
I |
LOGM
-
NASDAQ
Logmein Inc
INTERNET - Internet Software andamp; Services
|
$115.60
|
-4.20
-3.51% |
$121.25
|
554,183
94.60% of 50 DAV
50 DAV is 585,800
|
$134.80
-14.24%
|
2/15/2018
|
$132.35
|
PP = $129.61
|
|
MB = $136.09
|
Most Recent Note - 3/27/2018 4:12:22 PM
It will be dropped from the Featured Stocks list tonight. Slumped to a close below its 200 DMA line ($116.44) today. Its Relative Strength rating is 76, below the 80+ minimum guideline for buy candidates. A rebound above the 50 DMA line ($122) is needed for its outlook to improve.
>>> FEATURED STOCK ARTICLE : Rebounding After Finding Support at 200-Day Average - 3/14/2018 |
View all notes |
Set NEW NOTE alert |
Company Profile |
SEC
News |
Chart |
Request a new note
C
A
S
I |
HTHT
-
NASDAQ
China Lodging Group Ads
LEISURE - Lodging
|
$123.14
|
-7.88
-6.01% |
$132.00
|
629,147
108.10% of 50 DAV
50 DAV is 582,000
|
$166.19
-25.90%
|
12/22/2017
|
$138.07
|
PP = $142.90
|
|
MB = $150.05
|
Most Recent Note - 3/27/2018 3:57:49 PM
Slumped further below its February low ($128.60) and today's loss is testing its 200 DMA line ($121.84). A rebound above the 50 DMA line ($145) is needed for its outlook to improve. It will be dropped from the Featured Stocks list tonight. See the latest FSU analysis for more details and an annotated graph.
>>> FEATURED STOCK ARTICLE : Technical Damage and Slump Nears 200-Day Moving Average - 3/26/2018 |
View all notes |
Set NEW NOTE alert |
Company Profile |
SEC
News |
Chart |
Request a new note
C
A
S
I |
Symbol/Exchange
Company Name
Industry Group |
PRICE |
CHANGE
(%Change) |
Day High |
Volume
(% DAV)
(% 50 day avg vol) |
52 Wk Hi
% From Hi |
Featured
Date |
Price
Featured |
Pivot Featured |
|
Max Buy |
LMAT
-
NASDAQ
Lemaitre Vascular Inc
Medical-Products
|
$35.56
|
-0.14
-0.39% |
$35.89
|
146,118
111.54% of 50 DAV
50 DAV is 131,000
|
$39.88
-10.83%
|
3/19/2018
|
$36.77
|
PP = $39.98
|
|
MB = $41.98
|
Most Recent Note - 3/26/2018 6:28:10 PM
Y - Suffered a 4th consecutive small loss on near average volume. Remains perched within striking distance of the new pivot point cited based on its 10/20/17 high plus 10 cents. Subsequent volume-driven gains for new highs are needed to trigger a technical buy signal. Fundamentals remain strong.
>>> FEATURED STOCK ARTICLE : Rebounding Near High After Choppy Consolidation - 3/19/2018 |
View all notes |
Set NEW NOTE alert |
Company Profile |
SEC
News |
Chart |
Request a new note
C
A
S
I |
PETS
-
NASDAQ
Petmed Express Inc
RETAIL - Drug Stores
|
$41.93
|
-1.22
-2.83% |
$43.88
|
460,107
65.45% of 50 DAV
50 DAV is 703,000
|
$57.80
-27.46%
|
1/19/2018
|
$53.59
|
PP = $51.00
|
|
MB = $53.55
|
Most Recent Note - 3/23/2018 5:07:29 PM
G - Big loss today led to a close below the 200 DMA line triggering a technical sell signal. A rebound above the 50 DMA line ($46.19) is needed for its outlook to improve. Faces near-term resistance due to overhead supply up to the $57 level. Recently reported earnings +83% on +14% sales revenues, continuing its strong earnings track record.
>>> FEATURED STOCK ARTICLE : Recently Endured Distributional Pressure - 3/15/2018 |
View all notes |
Set NEW NOTE alert |
Company Profile |
SEC
News |
Chart |
Request a new note
C
A
S
I |
DPZ
-
NYSE
Dominos Pizza Inc
WHOLESALE - Food Wholesale
|
$231.58
|
+0.30
0.13% |
$233.78
|
791,787
77.78% of 50 DAV
50 DAV is 1,018,000
|
$236.00
-1.87%
|
2/20/2018
|
$224.86
|
PP = $222.01
|
|
MB = $233.11
|
Most Recent Note - 3/21/2018 5:56:40 PM
Y - Volume totals have been cooling while hovering near its high. Stalled soon after highlighted in the 2/20/18 mid-day report with pivot point cited based on its 1/25/18 high plus 10 cents. See the latest FSU analysis for more details and a new annotated graph.
>>> FEATURED STOCK ARTICLE : Popular Pizza Firm Perched Near All Time High - 3/21/2018 |
View all notes |
Set NEW NOTE alert |
Company Profile |
SEC
News |
Chart |
Request a new note
C
A
S
I |
FIVE
-
NASDAQ
Five Below Inc
Retail-DiscountandVariety
|
$69.72
|
-1.99
-2.78% |
$72.92
|
1,385,727
123.84% of 50 DAV
50 DAV is 1,119,000
|
$73.55
-5.21%
|
3/9/2018
|
$68.58
|
PP = $73.65
|
|
MB = $77.33
|
Most Recent Note - 3/23/2018 12:49:20 PM
Y - Early gain today challenged its all-time high. Posted a solid volume-driven gain on the prior session after reporting earnings +31% on +30% sales revenues for the Jan '18 quarter, continuing its strong earnings track record. New pivot point was cited based on its 1/05/18 high plus 10 cents. Subsequent volume-driven gains above the pivot point may trigger a new (or add-on) technical buy signal. Consolidating above its 50 DMA line ($66.80). The recent low ($60.00 on 2/06/18) defines important near-term support to watch on pullbacks.
>>> FEATURED STOCK ARTICLE : Retailer Rebounding Within Striking Distance of Prior High - 3/9/2018 |
View all notes |
Set NEW NOTE alert |
Company Profile |
SEC
News |
Chart |
Request a new note
C
A
S
I |
SPLK
-
NASDAQ
Splunk Inc
Computer Sftwr-Database
|
$99.79
|
-5.09
-4.85% |
$106.19
|
2,639,439
137.33% of 50 DAV
50 DAV is 1,922,000
|
$112.66
-11.42%
|
2/15/2018
|
$96.06
|
PP = $93.68
|
|
MB = $98.36
|
Most Recent Note - 3/27/2018 4:04:23 PM
G - Suffered a large loss today on near average volume, retreating near its "max buy" level. Its 50 DMA ($96.60) line and prior highs define support to watch on pullbacks.
>>> FEATURED STOCK ARTICLE : Extended After Rallying from Secondary Buy Point - 3/20/2018 |
View all notes |
Set NEW NOTE alert |
Company Profile |
SEC
News |
Chart |
Request a new note
C
A
S
I |
Symbol/Exchange
Company Name
Industry Group |
PRICE |
CHANGE
(%Change) |
Day High |
Volume
(% DAV)
(% 50 day avg vol) |
52 Wk Hi
% From Hi |
Featured
Date |
Price
Featured |
Pivot Featured |
|
Max Buy |
PAYC
-
NYSE
Paycom Software Inc
COMPUTER SOFTWARE and SERVICES - Application Software
|
$107.62
|
-6.24
-5.48% |
$115.48
|
944,558
118.37% of 50 DAV
50 DAV is 798,000
|
$114.14
-5.71%
|
2/15/2018
|
$95.01
|
PP = $93.61
|
|
MB = $98.29
|
Most Recent Note - 3/27/2018 3:59:04 PM
G - There was a "negative reversal" today after hitting another new all-time high. Very extended from any sound base. Its 50 DMA line ($97.77) defines near-term support above prior highs in the $93 area. Fundamentals remain strong.
>>> FEATURED STOCK ARTICLE : Extended From Prior Base After Streak of Gains - 3/7/2018 |
View all notes |
Set NEW NOTE alert |
Company Profile |
SEC
News |
Chart |
Request a new note
C
A
S
I |
GRUB
-
NYSE
Grubhub Inc
COMPUTER SOFTWARE and SERVICES - Technical and System Software
|
$103.34
|
-5.12
-4.72% |
$109.16
|
2,125,727
110.60% of 50 DAV
50 DAV is 1,922,000
|
$112.41
-8.07%
|
6/21/2017
|
$47.33
|
PP = $46.94
|
|
MB = $49.29
|
Most Recent Note - 3/27/2018 3:54:35 PM
G - Pulling back after getting very extended from any sound base. Its 50 DMA line ($91) defines near-term support. Recently reported earnings +61% on +49% sales revenues for the Dec '17 quarter.
>>> FEATURED STOCK ARTICLE : Bullish Action Followed Last Earnings Report - 3/1/2018 |
View all notes |
Set NEW NOTE alert |
Company Profile |
SEC
News |
Chart |
Request a new note
C
A
S
I |
HQY
-
NASDAQ
Healthequity Inc
COMPUTER SOFTWARE and SERVICES - Healthcare Information Service
|
$61.72
|
-1.78
-2.80% |
$63.85
|
617,982
82.84% of 50 DAV
50 DAV is 746,000
|
$68.75
-10.23%
|
2/20/2018
|
$56.37
|
PP = $55.41
|
|
MB = $58.18
|
Most Recent Note - 3/23/2018 1:00:50 PM
G - Pulling back today following 3 consecutive volume-driven gains hitting new all-time highs and getting very extended from any sound base. Prior highs in the $55 area define initial support along with its 50 DMA line. Reported earnings +57% on +29% sales revenues for the Jan '18 quarter versus the year ago period.
>>> FEATURED STOCK ARTICLE : Bullish Action Followed Latest Earnings Report - 3/22/2018 |
View all notes |
Set NEW NOTE alert |
Company Profile |
SEC
News |
Chart |
Request a new note
C
A
S
I |
LOB
-
NASDAQ
Live Oak Bancshares Inc
Banks-Southeast
|
$27.80
|
-1.00
-3.47% |
$29.00
|
127,505
87.93% of 50 DAV
50 DAV is 145,000
|
$30.05
-7.49%
|
3/16/2018
|
$28.63
|
PP = $28.30
|
|
MB = $29.72
|
Most Recent Note - 3/27/2018 4:10:01 PM
Y - Pulled back below its pivot point with today's loss on light volume. Rallied above the pivot point cited based on its 1/25/18 high plus 10 cents when highlighted in yellow in the 3/16/18 mid-day report (read here). The gain and close above the pivot point was backed by +393% above average volume as it triggered a technical buy signal. Reported very strong sales revenues and earnings increases for the Sep and Dec '17 quarters. Completed a new Public Offering on 8/09/17. Prior quarterly and annual earnings (C and A criteria) history is a good match with the fact-based investment system's guidelines.
>>> FEATURED STOCK ARTICLE : Tallied Volume-Driven Gain for New High - 3/16/2018 |
View all notes |
Set NEW NOTE alert |
Company Profile |
SEC
News |
Chart |
Request a new note
C
A
S
I |
PYPL
-
NASDAQ
Paypal Holdings Inc
Finance-CrdtCard/PmtPr
|
$76.31
|
-2.64
-3.34% |
$79.90
|
7,885,779
77.63% of 50 DAV
50 DAV is 10,158,000
|
$86.32
-11.60%
|
2/1/2018
|
$80.35
|
PP = $79.49
|
|
MB = $83.46
|
Most Recent Note - 3/27/2018 4:05:52 PM
G - Met resistance and slumped further below its 50 DMA line ($79.67) with a big loss on light volume today. The prior low ($71.63 on 2/09/18) defines the next important support level where a violation would raise concerns and trigger a more worrisome technical sell signal. Fundamentals remain strong.
>>> FEATURED STOCK ARTICLE : Sputtering Below 50-Day Moving Average Again - 3/27/2018 |
View all notes |
Set NEW NOTE alert |
Company Profile |
SEC
News |
Chart |
Request a new note
C
A
S
I |
Symbol/Exchange
Company Name
Industry Group |
PRICE |
CHANGE
(%Change) |
Day High |
Volume
(% DAV)
(% 50 day avg vol) |
52 Wk Hi
% From Hi |
Featured
Date |
Price
Featured |
Pivot Featured |
|
Max Buy |
OLLI
-
NASDAQ
Ollie's Bargain Outlet
Retail-DiscountandVariety
|
$58.45
|
-1.85
-3.07% |
$60.40
|
507,821
103.22% of 50 DAV
50 DAV is 492,000
|
$62.05
-5.80%
|
11/21/2017
|
$46.78
|
PP = $47.00
|
|
MB = $49.35
|
Most Recent Note - 3/26/2018 6:31:32 PM
G - Posted a big gain today with near average volume, rebounding near its all-time high. Near-term support is defined by its 50 DMA line ($57.51) and prior low ($54.44 on 3/09/18).
>>> FEATURED STOCK ARTICLE : Bargain Outlet's Shares Perched Near All-Time Price High - 3/13/2018 |
View all notes |
Set NEW NOTE alert |
Company Profile |
SEC
News |
Chart |
Request a new note
C
A
S
I |
WB
-
NASDAQ
Weibo Corp Cl A Ads
INTERNET - Content
|
$118.23
|
-10.55
-8.19% |
$129.50
|
2,750,115
137.99% of 50 DAV
50 DAV is 1,993,000
|
$142.12
-16.81%
|
1/16/2018
|
$126.33
|
PP = $122.21
|
|
MB = $128.32
|
Most Recent Note - 3/27/2018 3:53:23 PM
G - Met resistance and today's big loss on higher volume has it slumping further below its 50 DMA line ($129.67). Recently reported earnings +88% on +77% sales revenues for the Dec '17 quarter, continuing its strong earnings track record.
>>> FEATURED STOCK ARTICLE : Recent Consolidation is Not a New Base of Sufficient Length - 3/8/2018 |
View all notes |
Set NEW NOTE alert |
Company Profile |
SEC
News |
Chart |
Request a new note
C
A
S
I |
HLI
-
NYSE
Houlihan Lokey Inc Cl A
Finance-Invest Bnk/Bkrs
|
$43.75
|
-1.37
-3.04% |
$45.23
|
206,441
66.59% of 50 DAV
50 DAV is 310,000
|
$52.81
-17.16%
|
1/3/2018
|
$45.88
|
PP = $47.09
|
|
MB = $49.44
|
Most Recent Note - 3/22/2018 7:05:18 PM
G - Completed a new Public Offering on 3/12/18 and it has slumped below its 50 DMA line ($47.76) raising concerns. The recent low ($43.73 on 2/06/18) defines near term support where a violation would raise greater concerns. Earnings +21% for the Dec '17 quarter were below the +25% minimum earnings guideline (C criteria).
>>> FEATURED STOCK ARTICLE : Recently Met Resistance at 50-Day Moving Average - 2/28/2018 |
View all notes |
Set NEW NOTE alert |
Company Profile |
SEC
News |
Chart |
Request a new note
C
A
S
I |
SQ
-
NYSE
Square Inc Cl A
Finance-CrdtCard/PmtPr
|
$51.06
|
-2.49
-4.65% |
$55.15
|
13,457,551
87.76% of 50 DAV
50 DAV is 15,335,000
|
$58.46
-12.66%
|
3/5/2018
|
$49.70
|
PP = $49.66
|
|
MB = $52.14
|
Most Recent Note - 3/27/2018 4:00:44 PM
Y - There was a "negative reversal" today after early gains. Prior highs in the $47-49 area define initial support to watch on pullbacks. Fundamentals remain strong.
>>> FEATURED STOCK ARTICLE : New High & Considerable Gain Backed By Twice Average Volume - 3/5/2018 |
View all notes |
Set NEW NOTE alert |
Company Profile |
SEC
News |
Chart |
Request a new note
C
A
S
I |
SEND
-
NYSE
Sendgrid Inc
INTERNET - Content
|
$28.50
|
-1.86
-6.13% |
$30.88
|
282,675
126.76% of 50 DAV
50 DAV is 223,000
|
$32.03
-11.01%
|
3/6/2018
|
$28.00
|
PP = $28.37
|
|
MB = $29.79
|
Most Recent Note - 3/27/2018 4:08:15 PM
Y - Erased an early gain today and ended near the session low with a big loss on higher (below average) volume. Retreated below its "max buy" level and its color code is changed to yellow. Prior highs in the $27-28 area define initial support to watch on pullbacks.
>>> FEATURED STOCK ARTICLE : Recently Profitable Internet - Content Firm Rallied to New High - 3/6/2018 |
View all notes |
Set NEW NOTE alert |
Company Profile |
SEC
News |
Chart |
Request a new note
C
A
S
I |
Symbol/Exchange
Company Name
Industry Group |
PRICE |
CHANGE
(%Change) |
Day High |
Volume
(% DAV)
(% 50 day avg vol) |
52 Wk Hi
% From Hi |
Featured
Date |
Price
Featured |
Pivot Featured |
|
Max Buy |
|
|
|
THESE ARE NOT BUY RECOMMENDATIONS!
Comments contained in the body of this report are technical
opinions only. The material herein has been obtained
from sources believed to be reliable and accurate, however,
its accuracy and completeness cannot be guaranteed.
This site is not an investment advisor, hence it does
not endorse or recommend any securities or other investments.
Any recommendation contained in this report may not
be suitable for all investors and it is not to be deemed
an offer or solicitation on our part with respect to
the purchase or sale of any securities. All trademarks,
service marks and trade names appearing in this report
are the property of their respective owners, and are
likewise used for identification purposes only.
This report is a service available
only to active Paid Premium Members.
You may opt-out of receiving report notifications
at any time. Questions or comments may be submitted
by writing to Premium Membership Services 665 S.E. 10 Street, Suite 201 Deerfield Beach, FL 33441-5634 or by calling 1-800-965-8307
or 954-785-1121.
|
|
|

