You are not logged in.
This means you
CAN ONLY VIEW reports that were published prior to Thursday, March 20, 2025.
You
MUST UPGRADE YOUR MEMBERSHIP if you want to see any current reports.
AFTER MARKET UPDATE - FRIDAY, APRIL 13TH, 2018
Previous After Market Report Next After Market Report >>>
|
|
|
|
DOW |
-122.91 |
24,360.14 |
-0.50% |
|
Volume |
718,243,300 |
-4% |
|
Volume |
1,749,081,820 |
-13% |
|
NASDAQ |
-33.60 |
7,106.65 |
-0.47% |
|
Advancers |
1,265 |
43% |
|
Advancers |
1,100 |
38% |
|
S&P 500 |
-7.69 |
2,656.30 |
-0.29% |
|
Decliners |
1,647 |
57% |
|
Decliners |
1,791 |
62% |
|
Russell 2000 |
-7.82 |
1,549.51 |
-0.50% |
|
52 Wk Highs |
41 |
|
|
52 Wk Highs |
50 |
|
|
S&P 600 |
-3.75 |
952.77 |
-0.39% |
|
52 Wk Lows |
46 |
|
|
52 Wk Lows |
29 |
|
|
 |
Major Indices' Pullback Trims Weekly Gains
Kenneth J. Gruneisen - Passed the CAN SLIM® Master's Exam
For the week, the Dow gained 1.8%, the S&P 500 added 2.0% and the Nasdaq Composite advanced 2.8%. Stocks finished lower Friday. The Dow was down 122 points to 24360, while the S&P 500 dipped 7 points to 2656. The Nasdaq Composite fell 33 points to 7106. The volume totals reported were lighter than the prior session totals on the NYSE and on the Nasdaq exchange, indicative of lighter institutional selling pressure. Decliners led advancers by a 4-3 margin on the NYSE and 3-2 on the Nasdaq exchange. There were 19 high-ranked companies from the Leaders List that made new 52-week highs and were listed on the BreakOuts Page, versus the total of 28 on the prior session. New 52-week highs outnumbered new 52-week lows totals on the Nasdaq exchange, but new lows outnumbered new highs on the NYSE. Tuesday's big gains for all three major indices (M criteria) came with higher volume totals coupled with more stocks hitting new highs. The strong action met the definition of a follow-through day on Day 6 of the rally effort. With the new confirmed rally, buying efforts are justified when all key criteria of the fact-based investment system are satisfied. The Featured Stocks Page provides the most timely analysis on high-ranked leaders. Charts used courtesy of www.stockcharts.com
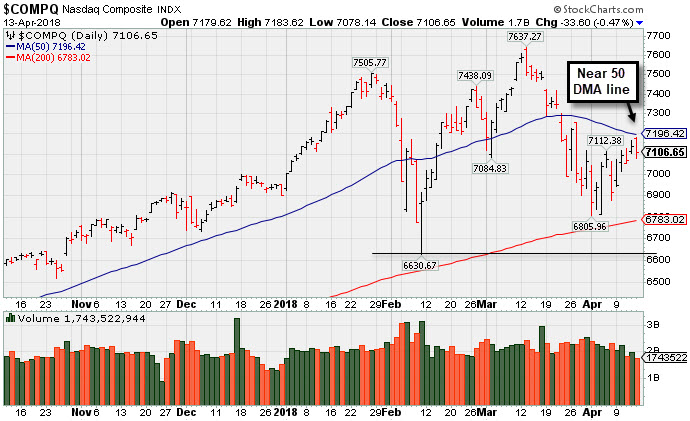 PICTURED: The Nasdaq Composite Index has rebounded near its 50-day moving average (DMA) line which is now downward sloping. The 200 DMA line and prior low define important near-term support. Technically, more damaging losses would signal for investors to reduce market exposure.
The major averages declined amid a retreat in the Financial sector, but remained on track for weekly gains as global trade tensions appeared to ease. Investors digested Thursday’s optimism from President Trump regarding trade relations with China. On the data front, a Labor Department report revealed job openings in February eased from near-record highs in January. In a separate release, a preliminary reading from the University of Michigan revealed consumer sentiment is cooling in the month of April.
Seven of 11 sectors in the S&P 500 finished lower with Financials leading decliners. Shares of JP Morgan Chase & Co (JPM -2.71%) and Citigroup (C -1.55%) lost ground despite both banks topping analyst earnings projections. Meanwhile, the Energy sector outperformed, gaining over 1.0% in tandem with this week’s rally in oil prices. In other corporate news, Broadcom (AVGO +3.14%) rose after the semiconductor maker announced a $12 billion share buyback program.
The yield curve flattened modestly with the benchmark 10-year note declining one basis point to 2.82%. Intraday, the two-year note touched 2.37%, the highest level since September 2008. In commodities, WTI crude added 0.3% to $67.25/barrel to finish up more than 8% for the week. COMEX gold gained 0.5% to $1344.80/ounce. |
 Kenneth J. Gruneisen started out as a licensed stockbroker in August 1987, a couple of months prior to the historic stock market crash that took the Dow Jones Industrial Average down -22.6% in a single day. He has published daily fact-based fundamental and technical analysis on high-ranked stocks online for two decades. Through FACTBASEDINVESTING.COM, Kenneth provides educational articles, news, market commentary, and other information regarding proven investment systems that work in good times and bad.
Comments contained in the body of this report are technical opinions only and are not necessarily those of Gruneisen Growth Corp. The material herein has been obtained from sources believed to be reliable and accurate, however, its accuracy and completeness cannot be guaranteed. Our firm, employees, and customers may effect transactions, including transactions contrary to any recommendation herein, or have positions in the securities mentioned herein or options with respect thereto. Any recommendation contained in this report may not be suitable for all investors and it is not to be deemed an offer or solicitation on our part with respect to the purchase or sale of any securities. |
|
 |
Commodity-Linked Groups Rose While Most Groups Fell
Kenneth J. Gruneisen - Passed the CAN SLIM® Master's Exam
On Friday the Bank Index ($BKX -2.05%) and Broker/Dealer Index ($XBD -1.06%) fell along with the Retail Index ($RLX -0.80%). The tech sector had a negative bias as the Biotech Index ($BTK -0.56%), Semiconductor Index ($SOX -0.77%), and the Networking Index ($NWX -0.42%) posted unanimous losses. The Oil Services Index ($OSX +0.89%) and the Integrated Oil Index ($XOI +0.83%) both rose and the Gold & Silver Index ($XAU +1.59%) was a standout gainer. Charts courtesy wwwstockcharts.com
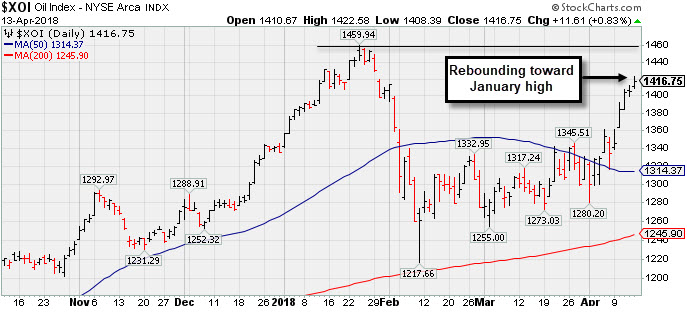 PICTURED: The Integrated Oil Index ($XOI +0.83%) found support above its 200-day moving average (DMA) line and has been rebounding toward its January high.
| Oil Services |
$OSX |
151.10 |
+1.33 |
+0.89% |
+1.04% |
| Integrated Oil |
$XOI |
1,416.75 |
+11.61 |
+0.83% |
+6.08% |
| Semiconductor |
$SOX |
1,329.40 |
-10.26 |
-0.77% |
+6.09% |
| Networking |
$NWX |
538.21 |
-2.27 |
-0.42% |
+9.72% |
| Broker/Dealer |
$XBD |
284.29 |
-3.05 |
-1.06% |
+7.18% |
| Retail |
$RLX |
1,914.94 |
-15.50 |
-0.80% |
+10.45% |
| Gold & Silver |
$XAU |
84.08 |
+1.32 |
+1.59% |
-1.40% |
| Bank |
$BKX |
106.38 |
-2.22 |
-2.04% |
-0.31% |
| Biotech |
$BTK |
4,624.11 |
-26.20 |
-0.56% |
+9.52% |
|
|
|
 |
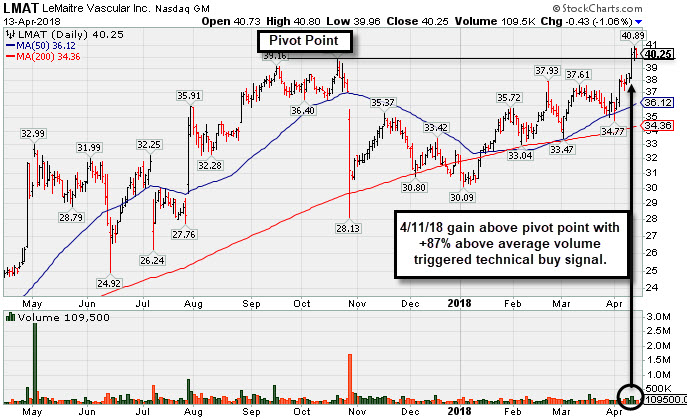
Gain With Heavy Volume Triggered Technical Buy Signal
Kenneth J. Gruneisen - Passed the CAN SLIM® Master's Exam
Lemaitre Vascular Inc (LMAT -$0.43 or -1.06% to $40.25) triggered a technical buy signal on 4/11/18 as it posted a solid gain with +87% above average volume, rising above the new pivot point cited based on its 10/20/17 high plus 10 cents. It found support recently near its 50-day moving average (DMA) line ($36.17).
LMAT was highlighted again in yellow with new pivot point cited based on its 10/20/17 high plus 10 cents in the 3/19/18 mid-day report (read here). Fundamentals remain strong, as it reported +62% earnings on +12% sales revenues for the Dec '17 quarter. The past 4 quarterly comparisons were above the +25% minimum guideline (C criteria), a reassuring sign.
The high-ranked Medical - Products firm currently has an A Timeliness rating and a C Sponsorship rating. It was last shown in this FSU section on 3/19/18 with an annotated graph under the headline, "Rebounding Near High After Choppy Consolidation".
Its current Up/Down Volume ratio of 1.0 is an unbiased indication that its shares have been neutral concerning accumulation/distribution over the past 50 days. The number of top-rated funds owning its share rose from 184 in Dec '15 to 288 in Dec '17, a reassuring sign concerning the I criteria. Its small supply of 14.7 million shares (S criteria) in the public float can contribute to greater price volatility in the event of institutional buying or selling. |
|
|
Color Codes Explained :
Y - Better candidates highlighted by our
staff of experts.
G - Previously featured
in past reports as yellow but may no longer be buyable under the
guidelines.
***Last / Change / Volume data in this table is the closing quote data***
Symbol/Exchange
Company Name
Industry Group |
PRICE |
CHANGE
(%Change) |
Day High |
Volume
(% DAV)
(% 50 day avg vol) |
52 Wk Hi
% From Hi |
Featured
Date |
Price
Featured |
Pivot Featured |
|
Max Buy |
PFBC
-
NASDAQ
Preferred Bank Los Angls
BANKING - Regional - Pacific Banks
|
$64.55
|
-0.96
-1.47% |
$65.90
|
85,992
102.37% of 50 DAV
50 DAV is 84,000
|
$67.65
-4.58%
|
4/10/2018
|
$64.56
|
PP = $67.75
|
|
MB = $71.14
|
Most Recent Note - 4/10/2018 1:13:30 PM
Y - Color code is changed to yellow with pivot point cited based on its 1/22/18 high plus 10 cents. Subsequent volume-driven gains for new highs may trigger a technical buy signal. Fundamentals through Dec '17 have remained strong. Consolidating near its 50 DMA line ($64.12). It made gradual progress since dropped from the Featured Stocks list on 1/03/18.
>>> FEATURED STOCK ARTICLE : Bank Stock Hovering Within Striking Distance of Prior High - 4/10/2018 |
View all notes |
Set NEW NOTE alert |
Company Profile |
SEC
News |
Chart |
Request a new note
C
A
S
I |
SIVB
-
NASDAQ
S V B Financial Group
BANKING - Regional - Pacific Banks
|
$247.03
|
-3.53
-1.41% |
$253.90
|
617,041
84.53% of 50 DAV
50 DAV is 730,000
|
$271.79
-9.11%
|
3/12/2018
|
$267.79
|
PP = $263.19
|
|
MB = $276.35
|
Most Recent Note - 4/12/2018 5:15:48 PM
Y - Color code is changed to yellow after rebounding above the downward sloping 50 DMA line ($249.19) helping its outlook improve. Found support when recently sputtering near the prior low ($226.61 on 2/06/18). See the latest FSU analysis for more details and a new annotated graph.
>>> FEATURED STOCK ARTICLE : Rebounded Above its 50-Day Moving Average - 4/12/2018 |
View all notes |
Set NEW NOTE alert |
Company Profile |
SEC
News |
Chart |
Request a new note
C
A
S
I |
TPL
-
NYSE
Texas Pacific Land Trust
FINANCIAL SERVICES - Diversified Investments
|
$540.00
|
+5.20
0.97% |
$557.50
|
25,327
180.91% of 50 DAV
50 DAV is 14,000
|
$569.99
-5.26%
|
4/13/2018
|
$547.85
|
PP = $552.10
|
|
MB = $579.71
|
 Most Recent Note - 4/13/2018 1:14:03 PM
Y - Color code is changed to yellow with new pivot point cited based on its 2/28/18 high plus 10 cents. Subsequent gains above the pivot point with more than+40% above average volume may trigger a new (or add-on) technical buy signal. Very little resistance remains due to overhead supply up to the $569 level. Recent lows ($480) define important support where damaging losses may trigger a worrisome technical sell signal.
>>> FEATURED STOCK ARTICLE : Slump Under 50-Day Average Line Hurt Near Term Outlook - 3/23/2018 |
View all notes |
Set NEW NOTE alert |
Company Profile |
SEC
News |
Chart |
Request a new note
C
A
S
I |
LMAT
-
NASDAQ
Lemaitre Vascular Inc
Medical-Products
|
$40.25
|
-0.43
-1.06% |
$40.80
|
109,045
77.34% of 50 DAV
50 DAV is 141,000
|
$40.89
-1.57%
|
3/19/2018
|
$36.77
|
PP = $39.98
|
|
MB = $41.98
|
Most Recent Note - 4/13/2018 5:48:22 PM
Y - Pulled back with light volume. Triggered a technical buy signal as it posted a solid gain on 4/11/18 with +87% above average volume, rising above the new pivot point cited based on its 10/20/17 high plus 10 cents. Found support recently near its 50 DMA line ($36.17). See the latest FSU analysis for more details and a new annotated graph.
>>> FEATURED STOCK ARTICLE : Gain With Heavy Volume Triggered Technical Buy Signal - 4/13/2018 |
View all notes |
Set NEW NOTE alert |
Company Profile |
SEC
News |
Chart |
Request a new note
C
A
S
I |
DPZ
-
NYSE
Dominos Pizza Inc
WHOLESALE - Food Wholesale
|
$230.32
|
-1.16
-0.50% |
$233.28
|
527,567
54.39% of 50 DAV
50 DAV is 970,000
|
$236.93
-2.79%
|
2/20/2018
|
$224.86
|
PP = $222.01
|
|
MB = $233.11
|
Most Recent Note - 4/11/2018 6:27:27 PM
Y - Volume totals have been cooling while hovering near its all-time high. Made limited headway since highlighted in the 2/20/18 mid-day report with pivot point cited based on its 1/25/18 high plus 10 cents. Its 50 DMA line ($223) defines near-term support to watch.
>>> FEATURED STOCK ARTICLE : Popular Pizza Firm Perched Near All Time High - 3/21/2018 |
View all notes |
Set NEW NOTE alert |
Company Profile |
SEC
News |
Chart |
Request a new note
C
A
S
I |
Symbol/Exchange
Company Name
Industry Group |
PRICE |
CHANGE
(%Change) |
Day High |
Volume
(% DAV)
(% 50 day avg vol) |
52 Wk Hi
% From Hi |
Featured
Date |
Price
Featured |
Pivot Featured |
|
Max Buy |
FIVE
-
NASDAQ
Five Below Inc
Retail-DiscountandVariety
|
$75.24
|
-0.75
-0.99% |
$76.20
|
1,311,072
106.85% of 50 DAV
50 DAV is 1,227,000
|
$77.12
-2.44%
|
3/9/2018
|
$68.58
|
PP = $73.65
|
|
MB = $77.33
|
Most Recent Note - 4/11/2018 12:02:12 PM
Y - Trading further into new high territory today after a big gain on the prior session backed by only +18% above average volume. New pivot point recently was cited based on its 1/05/18 high plus 10 cents. Disciplined investors know that gains above a stock's pivot point must have a minimum +40% above average volume to trigger a proper technical buy signal. See the latest FSU analysis for more details and an annotated graph.
>>> FEATURED STOCK ARTICLE : Quietly Hovering Near All-Time High - 4/5/2018 |
View all notes |
Set NEW NOTE alert |
Company Profile |
SEC
News |
Chart |
Request a new note
C
A
S
I |
NVEE
-
NASDAQ
N V 5 Global Inc
Comml Svcs-Consulting
|
$59.55
|
-2.90
-4.64% |
$63.75
|
120,398
150.50% of 50 DAV
50 DAV is 80,000
|
$64.50
-7.67%
|
4/9/2018
|
$58.35
|
PP = $59.05
|
|
MB = $62.00
|
Most Recent Note - 4/13/2018 12:54:37 PM
Y - Prior highs in the $58 area define initial support to watch while pulling back after spiking to a new all-time high. With +95% above average volume a considerable gain above the pivot point triggered a technical buy signal.
>>> FEATURED STOCK ARTICLE : Perched Near High After 3 Strong Quarterly Comparisons - 4/9/2018 |
View all notes |
Set NEW NOTE alert |
Company Profile |
SEC
News |
Chart |
Request a new note
C
A
S
I |
SPLK
-
NASDAQ
Splunk Inc
Computer Sftwr-Database
|
$104.15
|
-2.24
-2.11% |
$107.33
|
1,691,018
80.87% of 50 DAV
50 DAV is 2,091,000
|
$112.66
-7.55%
|
2/15/2018
|
$96.06
|
PP = $93.68
|
|
MB = $98.36
|
Most Recent Note - 4/13/2018 5:50:46 PM
G - Pulled back today with lighter volume after 4 consecutive gains. Found support near its 50 DMA ($98.69) line and prior high in the $97 area. More damaging losses would raise greater concerns. It has not formed a sound base.
>>> FEATURED STOCK ARTICLE : Extended After Rallying from Secondary Buy Point - 3/20/2018 |
View all notes |
Set NEW NOTE alert |
Company Profile |
SEC
News |
Chart |
Request a new note
C
A
S
I |
PAYC
-
NYSE
Paycom Software Inc
COMPUTER SOFTWARE and SERVICES - Application Software
|
$109.96
|
-1.50
-1.35% |
$113.05
|
742,754
97.60% of 50 DAV
50 DAV is 761,000
|
$115.48
-4.78%
|
2/15/2018
|
$95.01
|
PP = $93.61
|
|
MB = $98.29
|
Most Recent Note - 4/10/2018 5:44:14 PM
G - Its 50 DMA line ($100.78) defines near-term support above prior highs in the $93 area. Fundamentals remain strong.
>>> FEATURED STOCK ARTICLE : Pulling Back After Negative Reversal at All-Time High Last Week - 4/4/2018 |
View all notes |
Set NEW NOTE alert |
Company Profile |
SEC
News |
Chart |
Request a new note
C
A
S
I |
GRUB
-
NYSE
Grubhub Inc
COMPUTER SOFTWARE and SERVICES - Technical and System Software
|
$97.91
|
-1.99
-1.99% |
$99.87
|
864,459
44.22% of 50 DAV
50 DAV is 1,955,000
|
$112.41
-12.90%
|
6/21/2017
|
$47.33
|
PP = $46.94
|
|
MB = $49.29
|
Most Recent Note - 4/10/2018 5:42:47 PM
G - Found support at its 50 DMA line ($96.06) recently. More damaging losses below the 50 DMA line and recent low ($94.08 on 4/04/18) would raise greater concerns.
>>> FEATURED STOCK ARTICLE : Very Extended and Enduring Distributional Pressure - 3/29/2018 |
View all notes |
Set NEW NOTE alert |
Company Profile |
SEC
News |
Chart |
Request a new note
C
A
S
I |
Symbol/Exchange
Company Name
Industry Group |
PRICE |
CHANGE
(%Change) |
Day High |
Volume
(% DAV)
(% 50 day avg vol) |
52 Wk Hi
% From Hi |
Featured
Date |
Price
Featured |
Pivot Featured |
|
Max Buy |
HQY
-
NASDAQ
Healthequity Inc
COMPUTER SOFTWARE and SERVICES - Healthcare Information Service
|
$63.48
|
-0.76
-1.18% |
$64.64
|
241,908
31.05% of 50 DAV
50 DAV is 779,000
|
$68.75
-7.67%
|
2/20/2018
|
$56.37
|
PP = $55.41
|
|
MB = $58.18
|
Most Recent Note - 4/10/2018 5:37:17 PM
G - Volume totals have been cooling while still hovering near its all-time high, extended from any sound base. Its 50 DMA line ($57.30) defines near term support above prior highs.
>>> FEATURED STOCK ARTICLE : Bullish Action Followed Latest Earnings Report - 3/22/2018 |
View all notes |
Set NEW NOTE alert |
Company Profile |
SEC
News |
Chart |
Request a new note
C
A
S
I |
LOB
-
NASDAQ
Live Oak Bancshares Inc
Banks-Southeast
|
$28.60
|
-0.45
-1.55% |
$29.35
|
52,201
37.83% of 50 DAV
50 DAV is 138,000
|
$30.05
-4.83%
|
3/16/2018
|
$28.63
|
PP = $28.30
|
|
MB = $29.72
|
Most Recent Note - 4/12/2018 5:18:48 PM
Y - Quietly consolidating above its pivot point after testing its 50 DMA line ($27.49). Subsequent damaging losses would raise greater concerns.
>>> FEATURED STOCK ARTICLE : Tallied Volume-Driven Gain for New High - 3/16/2018 |
View all notes |
Set NEW NOTE alert |
Company Profile |
SEC
News |
Chart |
Request a new note
C
A
S
I |
PYPL
-
NASDAQ
Paypal Holdings Inc
Finance-CrdtCard/PmtPr
|
$77.27
|
-0.19
-0.25% |
$78.63
|
5,729,964
55.72% of 50 DAV
50 DAV is 10,284,000
|
$86.32
-10.48%
|
2/1/2018
|
$80.35
|
PP = $79.49
|
|
MB = $83.46
|
Most Recent Note - 4/12/2018 5:17:20 PM
G - Rebounded near its 50 DMA line ($77.92), but a gain above that short-term average is still needed for its outlook to improve. Halted its slide above the prior low ($71.63 on 2/09/18) which defines the next important support level.
>>> FEATURED STOCK ARTICLE : Sputtering Below 50-Day Moving Average Again - 3/27/2018 |
View all notes |
Set NEW NOTE alert |
Company Profile |
SEC
News |
Chart |
Request a new note
C
A
S
I |
OLLI
-
NASDAQ
Ollie's Bargain Outlet
Retail-DiscountandVariety
|
$60.20
|
-1.40
-2.27% |
$62.35
|
620,892
97.47% of 50 DAV
50 DAV is 637,000
|
$63.75
-5.57%
|
4/10/2018
|
$62.05
|
PP = $62.15
|
|
MB = $65.26
|
Most Recent Note - 4/11/2018 6:23:32 PM
Y - Encountered distributional pressure and finished unchanged after hitting a new all-time high today. Posted a big gain for a new high backed by +66% above average volume on the prior session. See the latest FSU analysis for more details and a new annotated graph.
>>> FEATURED STOCK ARTICLE : Encountered Distribution, Finished Below Pivot Point After Early Gain - 4/11/2018 |
View all notes |
Set NEW NOTE alert |
Company Profile |
SEC
News |
Chart |
Request a new note
C
A
S
I |
WB
-
NASDAQ
Weibo Corp Cl A Ads
INTERNET - Content
|
$114.18
|
-8.41
-6.86% |
$123.66
|
3,411,223
170.48% of 50 DAV
50 DAV is 2,001,000
|
$142.12
-19.66%
|
1/16/2018
|
$126.33
|
PP = $122.21
|
|
MB = $128.32
|
Most Recent Note - 4/13/2018 1:24:02 PM
G - Pulling back on higher volume today. Met resistance near its 50 DMA line ($126.72), but gains above that short-term average are still needed for its outlook to improve. Prior lows in the $109 area define near-term support above its 200 DMA line ($106).
>>> FEATURED STOCK ARTICLE : Quietly Slumping Near Prior Low - 4/6/2018 |
View all notes |
Set NEW NOTE alert |
Company Profile |
SEC
News |
Chart |
Request a new note
C
A
S
I |
Symbol/Exchange
Company Name
Industry Group |
PRICE |
CHANGE
(%Change) |
Day High |
Volume
(% DAV)
(% 50 day avg vol) |
52 Wk Hi
% From Hi |
Featured
Date |
Price
Featured |
Pivot Featured |
|
Max Buy |
SQ
-
NYSE
Square Inc Cl A
Finance-CrdtCard/PmtPr
|
$47.50
|
-2.19
-4.41% |
$50.42
|
11,262,529
75.87% of 50 DAV
50 DAV is 14,844,000
|
$58.46
-18.75%
|
3/5/2018
|
$49.70
|
PP = $49.66
|
|
MB = $52.14
|
Most Recent Note - 4/13/2018 5:51:49 PM
G - Pulled back and closed the week just below its 50 DMA line ($47.81). It has not formed a sound base.
>>> FEATURED STOCK ARTICLE : Slumped Back Into Prior Base Testing 50-Day Average - 4/2/2018 |
View all notes |
Set NEW NOTE alert |
Company Profile |
SEC
News |
Chart |
Request a new note
C
A
S
I |
SEND
-
NYSE
Sendgrid Inc
INTERNET - Content
|
$27.34
|
+0.14
0.51% |
$27.56
|
286,250
81.32% of 50 DAV
50 DAV is 352,000
|
$32.03
-14.63%
|
3/6/2018
|
$28.00
|
PP = $28.37
|
|
MB = $29.79
|
Most Recent Note - 4/12/2018 5:22:04 PM
G - Rebounded above its 50 DMA line ($26.47) with today's 3rd consecutive gain on near average volume. Priced a new Public Offering and Secondary Offering on 4/05/18.
>>> FEATURED STOCK ARTICLE : Slumped Into Prior Base Testing 50-Day Average - 4/3/2018 |
View all notes |
Set NEW NOTE alert |
Company Profile |
SEC
News |
Chart |
Request a new note
C
A
S
I |
|
|
|
THESE ARE NOT BUY RECOMMENDATIONS!
Comments contained in the body of this report are technical
opinions only. The material herein has been obtained
from sources believed to be reliable and accurate, however,
its accuracy and completeness cannot be guaranteed.
This site is not an investment advisor, hence it does
not endorse or recommend any securities or other investments.
Any recommendation contained in this report may not
be suitable for all investors and it is not to be deemed
an offer or solicitation on our part with respect to
the purchase or sale of any securities. All trademarks,
service marks and trade names appearing in this report
are the property of their respective owners, and are
likewise used for identification purposes only.
This report is a service available
only to active Paid Premium Members.
You may opt-out of receiving report notifications
at any time. Questions or comments may be submitted
by writing to Premium Membership Services 665 S.E. 10 Street, Suite 201 Deerfield Beach, FL 33441-5634 or by calling 1-800-965-8307
or 954-785-1121.
|
|
|