You are not logged in.
This means you
CAN ONLY VIEW reports that were published prior to Thursday, March 20, 2025.
You
MUST UPGRADE YOUR MEMBERSHIP if you want to see any current reports.
AFTER MARKET UPDATE - FRIDAY, APRIL 6TH, 2018
Previous After Market Report Next After Market Report >>>
|
|
|
|
DOW |
-572.46 |
23,932.76 |
-2.34% |
|
Volume |
879,363,960 |
+17% |
|
Volume |
2,346,447,700 |
+11% |
|
NASDAQ |
-161.44 |
6,915.11 |
-2.28% |
|
Advancers |
621 |
21% |
|
Advancers |
641 |
22% |
|
S&P 500 |
-58.37 |
2,604.47 |
-2.19% |
|
Decliners |
2,307 |
79% |
|
Decliners |
2,290 |
78% |
|
Russell 2000 |
-29.63 |
1,513.30 |
-1.92% |
|
52 Wk Highs |
31 |
|
|
52 Wk Highs |
40 |
|
|
S&P 600 |
-17.18 |
934.29 |
-1.81% |
|
52 Wk Lows |
53 |
|
|
52 Wk Lows |
54 |
|
|
 |
Breadth Negative as Market Correction Continues Doing Damage
Kenneth J. Gruneisen - Passed the CAN SLIM® Master's Exam
For the week, the Dow was down 0.7%, the S&P 500 lost 1.4% and the Nasdaq Composite declined 2.1%. Stocks finished firmly lower Friday. The Dow lost 572 points to 23932 while the S&P 500 fell 58 points to 2604. The Nasdaq Composite was down 161 points to 6915. The volume totals reported were higher than the prior session totals on the NYSE and on the Nasdaq exchange, indicative of slightly greater institutional selling pressure again. Breadth was solidly negative as decliners led advancers by nearly a 4-1 margin on both the NYSE and on the Nasdaq exchange. There were 16 high-ranked companies from the Leaders List that made new 52-week highs and were listed on the BreakOuts Page, versus the total of 20 on the prior session. New 52-week lows totals outnumbered new 52-week highs totals on both the NYSE and the Nasdaq exchange. The major indices (M criteria) have shown weakness indicative of a correction. Investors reduce market exposure during weak market periods by selling any stocks triggering technical sell signals on a case-by-case basis. Once a new confirmed rally with a solid follow through day occurs it will be noted and new buying efforts will again be justified only when all key criteria of the fact-based investment system are satisfied. The Featured Stocks Page provides the most timely analysis on high-ranked leaders. Charts used courtesy of www.stockcharts.com
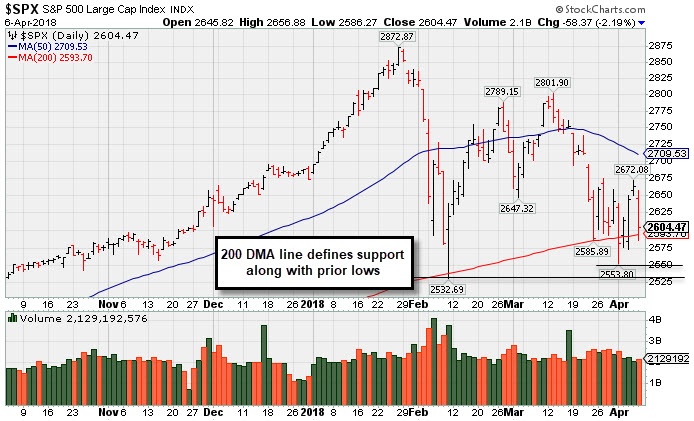 PICTURED: The S&P 500 Index fell near its 200-day moving average (DMA) line and prior lows which define important near-term support. Technically, more damaging losses would signal for investors to reduce market exposure.
The major averages declined Friday, ending a volatile week. The trade dispute between the U.S and China intensified Thursday evening when President Trump proposed $100 billion in additional tariffs targeting Chinese imports. In central bank news, Fed Chair Jerome Powell delivered remarks reiterating the need for further gradual rate hikes amid solid economic growth. On the data front, non-farm payrolls increased by 103,000 in March, missing expectations and marking the smallest gain in six months. The unemployment rate was unchanged at 4.1% while hourly earnings increased 2.7% year-over-year, matching forecasts.
All 11 sectors in the S&P 500 finished in negative territory. Industrials led decliners amid the global trade dispute with Boeing (BA -3.06%) and Caterpillar (CAT -3.47%) both falling. Technology lagged with Apple (AAPL -2.56%) down. Financials also underperformed amid falling yields with JP Morgan Chase & Co (JPM -2.49%) and Citigroup (C -2.31%) both sinking.
Treasuries were firmer with the yield on the benchmark 10-year note declining four basis points to 2.78%. In commodities, NYMEX WTI crude lost 2.5% to $61.98/barrel. COMEX Gold rose 0.6% to $1332.20/ounce amid a weaker dollar.
|
 Kenneth J. Gruneisen started out as a licensed stockbroker in August 1987, a couple of months prior to the historic stock market crash that took the Dow Jones Industrial Average down -22.6% in a single day. He has published daily fact-based fundamental and technical analysis on high-ranked stocks online for two decades. Through FACTBASEDINVESTING.COM, Kenneth provides educational articles, news, market commentary, and other information regarding proven investment systems that work in good times and bad.
Comments contained in the body of this report are technical opinions only and are not necessarily those of Gruneisen Growth Corp. The material herein has been obtained from sources believed to be reliable and accurate, however, its accuracy and completeness cannot be guaranteed. Our firm, employees, and customers may effect transactions, including transactions contrary to any recommendation herein, or have positions in the securities mentioned herein or options with respect thereto. Any recommendation contained in this report may not be suitable for all investors and it is not to be deemed an offer or solicitation on our part with respect to the purchase or sale of any securities. |
|
 |
Financial, Retail, Tech, and Energy-Linked Groups Fell
Kenneth J. Gruneisen - Passed the CAN SLIM® Master's Exam
On Friday losses for the Retail Index ($RLX -2.52%), Broker/Dealer Index ($XBD -2.84%) and the Bank Index ($BKX -2.70%) dragged the major indices lower. The tech sector also had a negative bias as the Semiconductor Index ($SOX -3.06%), Biotech Index ($BTK -3.18%) and the Networking Index ($NWX -1.84%) each suffered a big loss. Energy-linked groups fell as the Integrated Oil Index ($XOI -1.47%) and the Oil Services Index ($OSX -2.14%) both fell, meanwhile the Gold & Silver Index ($XAU +0.09%) was a standout as it essentially finished flat. Charts courtesy wwwstockcharts.com
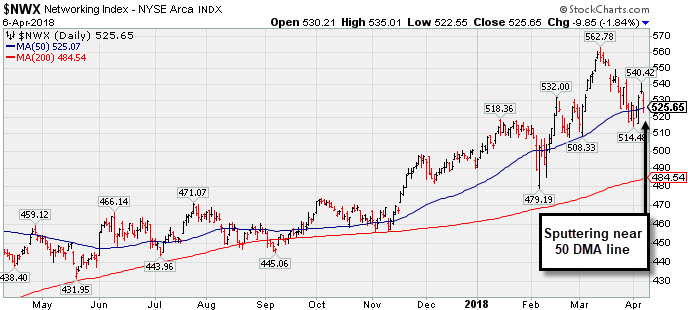 PICTURED: The Networking Index ($NWX -1.84%) is sputtering near its 50-day moving average (DMA) line. It found prompt support near that important short-term average in recent months.
| Oil Services |
$OSX |
136.43 |
-2.98 |
-2.14% |
-8.77% |
| Integrated Oil |
$XOI |
1,333.67 |
-19.86 |
-1.47% |
-0.14% |
| Semiconductor |
$SOX |
1,265.25 |
-39.99 |
-3.06% |
+0.97% |
| Networking |
$NWX |
525.65 |
-9.85 |
-1.84% |
+7.16% |
| Broker/Dealer |
$XBD |
280.15 |
-8.18 |
-2.84% |
+5.62% |
| Retail |
$RLX |
1,895.61 |
-49.02 |
-2.52% |
+9.33% |
| Gold & Silver |
$XAU |
81.54 |
+0.07 |
+0.09% |
-4.37% |
| Bank |
$BKX |
105.08 |
-2.91 |
-2.69% |
-1.53% |
| Biotech |
$BTK |
4,257.84 |
-139.70 |
-3.18% |
+0.84% |
|
|
|
 |
Quietly Slumping Near Prior Low
Kenneth J. Gruneisen - Passed the CAN SLIM® Master's Exam
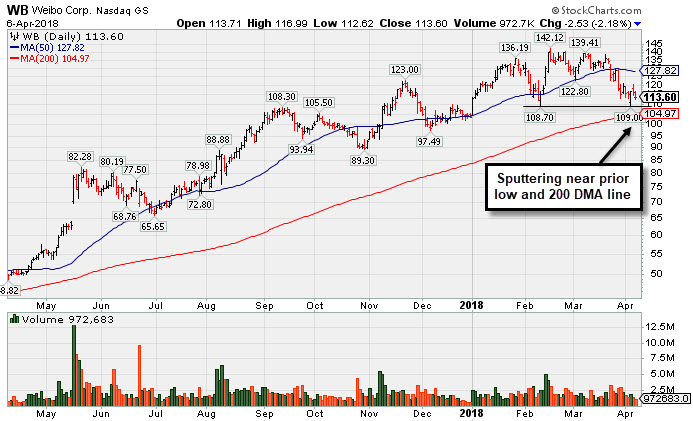
Weibo Corp Cl (WB -$2.53 or -2.18% to $113.6) is slumping near the prior low, still sputtering below its 50-day moving average (DMA) line ($127.82) after damaging volume-driven losses. A rebound above that short-term average is needed for its outlook to improve.
It was last shown in this FSU section on 3/08/18 with an annotated graph under the headline, "Recent Consolidation is Not a New Base of Sufficient Length". WB was first highlighted in yellow in the 1/16/18 mid-day report (read here) with pivot point cited based on its 1/08/18 high after an 8-week cup-with-handle base.
Earnings rose +88% on +77% sales revenues for the Dec '17 quarter, continuing its strong earnings track record. Its strong quarterly earnings track record was marked by sales revenues acceleration. Sales revenues rose from the year ago periods by +24%, +36%, +42%, +43%, +67%, +72%, and +81% in the Mar, Jun, Sep, Dec '16, Mar, Jun, and Sep '17 quarters, respectively. The limited annual earnings (A criteria) history for this China-based Internet - Content firm remains a concern. Weibo completed its $17 IPO in April 2014, and in FY '14 and prior years it reported losses.
The number of top-rated funds owning its shares rose from 503 in Jun '17 to 567 in Mar '18, a reassuring sign concerning the I criteria. Its current Up/Down Volume Ratio of 0.9 is an unbiased indication its shares have been under slight distributional pressure over the past 50 days. It has a Timeliness rating of B. Charts courtesy wwwstockcharts.com
 |
|
|
Color Codes Explained :
Y - Better candidates highlighted by our
staff of experts.
G - Previously featured
in past reports as yellow but may no longer be buyable under the
guidelines.
***Last / Change / Volume data in this table is the closing quote data***
Symbol/Exchange
Company Name
Industry Group |
PRICE |
CHANGE
(%Change) |
Day High |
Volume
(% DAV)
(% 50 day avg vol) |
52 Wk Hi
% From Hi |
Featured
Date |
Price
Featured |
Pivot Featured |
|
Max Buy |
SIVB
-
NASDAQ
S V B Financial Group
BANKING - Regional - Pacific Banks
|
$236.06
|
-6.22
-2.57% |
$241.60
|
652,839
89.55% of 50 DAV
50 DAV is 729,000
|
$271.79
-13.15%
|
3/12/2018
|
$267.79
|
PP = $263.19
|
|
MB = $276.35
|
Most Recent Note - 4/3/2018 6:43:17 PM
G - Sputtering near the prior low ($226.61 on 2/06/18) defining important near-term support. Only a prompt rebound above the 50 DMA line ($251.22) would help its outlook improve.
>>> FEATURED STOCK ARTICLE : Endured Distributional Pressure After Wedging Higher - 3/12/2018 |
View all notes |
Set NEW NOTE alert |
Company Profile |
SEC
News |
Chart |
Request a new note
C
A
S
I |
TPL
-
NYSE
Texas Pacific Land Trust
FINANCIAL SERVICES - Diversified Investments
|
$511.00
|
-10.77
-2.06% |
$522.00
|
8,416
60.11% of 50 DAV
50 DAV is 14,000
|
$569.99
-10.35%
|
2/20/2018
|
$517.00
|
PP = $569.99
|
|
MB = $598.49
|
Most Recent Note - 4/3/2018 6:46:15 PM
G - Meeting resistance, but a rebound above the 50 DMA line ($517.78) is needed for its outlook to improve. Recent lows ($480) define important support where damaging losses may trigger a worrisome technical sell signal.
>>> FEATURED STOCK ARTICLE : Slump Under 50-Day Average Line Hurt Near Term Outlook - 3/23/2018 |
View all notes |
Set NEW NOTE alert |
Company Profile |
SEC
News |
Chart |
Request a new note
C
A
S
I |
LMAT
-
NASDAQ
Lemaitre Vascular Inc
Medical-Products
|
$37.73
|
-0.16
-0.42% |
$38.07
|
165,120
121.41% of 50 DAV
50 DAV is 136,000
|
$39.88
-5.39%
|
3/19/2018
|
$36.77
|
PP = $39.98
|
|
MB = $41.98
|
Most Recent Note - 4/4/2018 5:44:32 PM
Y - Posted a solid gain today with above average volume, rising within striking distance of the new pivot point cited based on its 10/20/17 high plus 10 cents. Subsequent volume-driven gains for new highs are needed to trigger a technical buy signal. Found support recently near its 50 DMA line ($35.56).
>>> FEATURED STOCK ARTICLE : Rebounding Near High After Choppy Consolidation - 3/19/2018 |
View all notes |
Set NEW NOTE alert |
Company Profile |
SEC
News |
Chart |
Request a new note
C
A
S
I |
DPZ
-
NYSE
Dominos Pizza Inc
WHOLESALE - Food Wholesale
|
$231.46
|
-4.33
-1.84% |
$235.73
|
653,033
65.37% of 50 DAV
50 DAV is 999,000
|
$236.93
-2.31%
|
2/20/2018
|
$224.86
|
PP = $222.01
|
|
MB = $233.11
|
Most Recent Note - 4/4/2018 10:03:47 AM
Y - Gapped down today. There was a "negative reversal" on 4/02/18 after touching a new all-time high. Stalled soon after highlighted in the 2/20/18 mid-day report with pivot point cited based on its 1/25/18 high plus 10 cents. Its 50 DMA line ($222) defines near-term support to watch.
>>> FEATURED STOCK ARTICLE : Popular Pizza Firm Perched Near All Time High - 3/21/2018 |
View all notes |
Set NEW NOTE alert |
Company Profile |
SEC
News |
Chart |
Request a new note
C
A
S
I |
FIVE
-
NASDAQ
Five Below Inc
Retail-DiscountandVariety
|
$70.70
|
-1.83
-2.52% |
$72.54
|
1,195,222
101.46% of 50 DAV
50 DAV is 1,178,000
|
$73.86
-4.28%
|
3/9/2018
|
$68.58
|
PP = $73.65
|
|
MB = $77.33
|
Most Recent Note - 4/5/2018 5:03:59 PM
Y - Hovering near its all-time high. Reported earnings +31% on +30% sales revenues for the Jan '18 quarter, continuing its strong earnings track record. New pivot point was cited based on its 1/05/18 high plus 10 cents. Subsequent volume-driven gains above the pivot point may trigger a new (or add-on) technical buy signal. See the latest FSU analysis for more details and a new annotated graph.
>>> FEATURED STOCK ARTICLE : Quietly Hovering Near All-Time High - 4/5/2018 |
View all notes |
Set NEW NOTE alert |
Company Profile |
SEC
News |
Chart |
Request a new note
C
A
S
I |
Symbol/Exchange
Company Name
Industry Group |
PRICE |
CHANGE
(%Change) |
Day High |
Volume
(% DAV)
(% 50 day avg vol) |
52 Wk Hi
% From Hi |
Featured
Date |
Price
Featured |
Pivot Featured |
|
Max Buy |
SPLK
-
NASDAQ
Splunk Inc
Computer Sftwr-Database
|
$97.46
|
-1.99
-2.00% |
$99.81
|
1,116,773
54.66% of 50 DAV
50 DAV is 2,043,000
|
$112.66
-13.49%
|
2/15/2018
|
$96.06
|
PP = $93.68
|
|
MB = $98.36
|
Most Recent Note - 4/4/2018 10:01:41 AM
G - Gapped down today undercutting its 50 DMA ($97.29) line and slumping below the prior high in the $97 area raising concerns and triggering a technical sell signal. Color code is changed to green. Only a prompt rebound above the 50 DMA line would help it outlook improve.
>>> FEATURED STOCK ARTICLE : Extended After Rallying from Secondary Buy Point - 3/20/2018 |
View all notes |
Set NEW NOTE alert |
Company Profile |
SEC
News |
Chart |
Request a new note
C
A
S
I |
PAYC
-
NYSE
Paycom Software Inc
COMPUTER SOFTWARE and SERVICES - Application Software
|
$107.18
|
-1.42
-1.31% |
$109.25
|
574,613
73.20% of 50 DAV
50 DAV is 785,000
|
$115.48
-7.19%
|
2/15/2018
|
$95.01
|
PP = $93.61
|
|
MB = $98.29
|
Most Recent Note - 4/4/2018 5:42:20 PM
G - Extended from any sound base and consolidating above its 50 DMA line ($99.40) which defines near-term support above prior highs in the $93 area. Fundamentals remain strong. See the latest FSU analysis for more details and a new annotated graph.
>>> FEATURED STOCK ARTICLE : Pulling Back After Negative Reversal at All-Time High Last Week - 4/4/2018 |
View all notes |
Set NEW NOTE alert |
Company Profile |
SEC
News |
Chart |
Request a new note
C
A
S
I |
GRUB
-
NYSE
Grubhub Inc
COMPUTER SOFTWARE and SERVICES - Technical and System Software
|
$97.09
|
-3.09
-3.08% |
$100.03
|
1,539,120
76.65% of 50 DAV
50 DAV is 2,008,000
|
$112.41
-13.63%
|
6/21/2017
|
$47.33
|
PP = $46.94
|
|
MB = $49.29
|
Most Recent Note - 4/4/2018 10:05:25 AM
G - Sputtering near its 50 DMA line ($93.96) which defines near-term support. More damaging losses would raise greater concerns.
>>> FEATURED STOCK ARTICLE : Very Extended and Enduring Distributional Pressure - 3/29/2018 |
View all notes |
Set NEW NOTE alert |
Company Profile |
SEC
News |
Chart |
Request a new note
C
A
S
I |
HQY
-
NASDAQ
Healthequity Inc
COMPUTER SOFTWARE and SERVICES - Healthcare Information Service
|
$62.82
|
-0.80
-1.26% |
$64.04
|
412,607
52.76% of 50 DAV
50 DAV is 782,000
|
$68.75
-8.63%
|
2/20/2018
|
$56.37
|
PP = $55.41
|
|
MB = $58.18
|
Most Recent Note - 4/3/2018 6:39:48 PM
G - Still hovering near its all-time high, extended from any sound base. Prior highs in the $55 area define initial support along with its 50 DMA line.
>>> FEATURED STOCK ARTICLE : Bullish Action Followed Latest Earnings Report - 3/22/2018 |
View all notes |
Set NEW NOTE alert |
Company Profile |
SEC
News |
Chart |
Request a new note
C
A
S
I |
LOB
-
NASDAQ
Live Oak Bancshares Inc
Banks-Southeast
|
$28.50
|
-0.85
-2.90% |
$29.20
|
195,628
129.55% of 50 DAV
50 DAV is 151,000
|
$30.05
-5.16%
|
3/16/2018
|
$28.63
|
PP = $28.30
|
|
MB = $29.72
|
Most Recent Note - 4/5/2018 5:10:05 PM
Y - Posted a 3rd consecutive gain today with +25% above average volume, rising above its pivot point. After testing its 50 DMA line ($27.24) any more damaging losses would raise greater concerns.
>>> FEATURED STOCK ARTICLE : Tallied Volume-Driven Gain for New High - 3/16/2018 |
View all notes |
Set NEW NOTE alert |
Company Profile |
SEC
News |
Chart |
Request a new note
C
A
S
I |
Symbol/Exchange
Company Name
Industry Group |
PRICE |
CHANGE
(%Change) |
Day High |
Volume
(% DAV)
(% 50 day avg vol) |
52 Wk Hi
% From Hi |
Featured
Date |
Price
Featured |
Pivot Featured |
|
Max Buy |
PYPL
-
NASDAQ
Paypal Holdings Inc
Finance-CrdtCard/PmtPr
|
$73.86
|
-3.09
-4.02% |
$76.40
|
8,132,229
77.78% of 50 DAV
50 DAV is 10,455,000
|
$86.32
-14.43%
|
2/1/2018
|
$80.35
|
PP = $79.49
|
|
MB = $83.46
|
Most Recent Note - 4/5/2018 5:08:17 PM
G - Gapped up today, however a rebound above its 50 DMA line ($78.75) is still needed for its outlook to improve. Halted its slide above the prior low ($71.63 on 2/09/18) which defines the next important support level.
>>> FEATURED STOCK ARTICLE : Sputtering Below 50-Day Moving Average Again - 3/27/2018 |
View all notes |
Set NEW NOTE alert |
Company Profile |
SEC
News |
Chart |
Request a new note
C
A
S
I |
OLLI
-
NASDAQ
Ollie's Bargain Outlet
Retail-DiscountandVariety
|
$58.95
|
-0.50
-0.84% |
$60.45
|
1,204,735
202.82% of 50 DAV
50 DAV is 594,000
|
$62.05
-5.00%
|
11/21/2017
|
$46.78
|
PP = $47.00
|
|
MB = $49.35
|
 Most Recent Note - 4/6/2018 12:35:41 PM
G - Pulled back from its all-time high yet found prompt support after undercutting its 50 DMA line ($58.08) and nearly testing the prior low ($54.44 on 3/09/18). Reported earnings +31% on +26% sales revenues for the Jan '18 quarter, continuing its strong earnings track record.
>>> FEATURED STOCK ARTICLE : Bargain Outlet's Shares Perched Near All-Time Price High - 3/13/2018 |
View all notes |
Set NEW NOTE alert |
Company Profile |
SEC
News |
Chart |
Request a new note
C
A
S
I |
WB
-
NASDAQ
Weibo Corp Cl A Ads
INTERNET - Content
|
$113.60
|
-2.53
-2.18% |
$116.99
|
972,679
47.56% of 50 DAV
50 DAV is 2,045,000
|
$142.12
-20.07%
|
1/16/2018
|
$126.33
|
PP = $122.21
|
|
MB = $128.32
|
Most Recent Note - 4/6/2018 5:38:15 PM
G - Slumped quietly near the prior low defining support above the 200 DMA line. A rebound above the 50 DMA line is needed for its outlook to improve. See the latest FSU analysis for more details and a new annotated graph.
>>> FEATURED STOCK ARTICLE : Quietly Slumping Near Prior Low - 4/6/2018 |
View all notes |
Set NEW NOTE alert |
Company Profile |
SEC
News |
Chart |
Request a new note
C
A
S
I |
SQ
-
NYSE
Square Inc Cl A
Finance-CrdtCard/PmtPr
|
$45.87
|
-2.15
-4.48% |
$47.65
|
14,148,786
95.02% of 50 DAV
50 DAV is 14,890,000
|
$58.46
-21.54%
|
3/5/2018
|
$49.70
|
PP = $49.66
|
|
MB = $52.14
|
Most Recent Note - 4/4/2018 9:58:59 AM
G - Gapped down today slumping below its 50 DMA line ($47.50) and below prior highs in the $47-49 area raising greater concerns and triggering technical sell signals. Color code is changed to green. Only a prompt rebound above the 50 DMA line would help its outlook improve. See the latest FSU analysis for more details and an annotated graph.
>>> FEATURED STOCK ARTICLE : Slumped Back Into Prior Base Testing 50-Day Average - 4/2/2018 |
View all notes |
Set NEW NOTE alert |
Company Profile |
SEC
News |
Chart |
Request a new note
C
A
S
I |
SEND
-
NYSE
Sendgrid Inc
INTERNET - Content
|
$25.06
|
+0.52
2.12% |
$26.00
|
4,409,367
1,844.92% of 50 DAV
50 DAV is 239,000
|
$32.03
-21.75%
|
3/6/2018
|
$28.00
|
PP = $28.37
|
|
MB = $29.79
|
Most Recent Note - 4/4/2018 9:56:22 AM
G - Gapped down and violated its 50 DMA line triggering a technical sell signal with a damaging loss today after announcing a Secondary Offering. Color code is changed to green. Disciplined investors always limit losses by selling any stock that falls more than -7% from their purchase price. See the latest FSU analysis for more details and an annotated graph.
>>> FEATURED STOCK ARTICLE : Slumped Into Prior Base Testing 50-Day Average - 4/3/2018 |
View all notes |
Set NEW NOTE alert |
Company Profile |
SEC
News |
Chart |
Request a new note
C
A
S
I |
Symbol/Exchange
Company Name
Industry Group |
PRICE |
CHANGE
(%Change) |
Day High |
Volume
(% DAV)
(% 50 day avg vol) |
52 Wk Hi
% From Hi |
Featured
Date |
Price
Featured |
Pivot Featured |
|
Max Buy |
|
|
|
THESE ARE NOT BUY RECOMMENDATIONS!
Comments contained in the body of this report are technical
opinions only. The material herein has been obtained
from sources believed to be reliable and accurate, however,
its accuracy and completeness cannot be guaranteed.
This site is not an investment advisor, hence it does
not endorse or recommend any securities or other investments.
Any recommendation contained in this report may not
be suitable for all investors and it is not to be deemed
an offer or solicitation on our part with respect to
the purchase or sale of any securities. All trademarks,
service marks and trade names appearing in this report
are the property of their respective owners, and are
likewise used for identification purposes only.
This report is a service available
only to active Paid Premium Members.
You may opt-out of receiving report notifications
at any time. Questions or comments may be submitted
by writing to Premium Membership Services 665 S.E. 10 Street, Suite 201 Deerfield Beach, FL 33441-5634 or by calling 1-800-965-8307
or 954-785-1121.
|
|
|

