You are not logged in.
This means you
CAN ONLY VIEW reports that were published prior to Thursday, March 20, 2025.
You
MUST UPGRADE YOUR MEMBERSHIP if you want to see any current reports.
AFTER MARKET UPDATE - THURSDAY, MARCH 29TH, 2018
Previous After Market Report Next After Market Report >>>
|
|
|
|
DOW |
+254.69 |
24,103.11 |
+1.07% |
|
Volume |
997,794,480 |
+7% |
|
Volume |
2,583,307,190 |
+2% |
|
NASDAQ |
+114.21 |
7,063.44 |
+1.64% |
|
Advancers |
2,312 |
78% |
|
Advancers |
2,047 |
69% |
|
S&P 500 |
+35.87 |
2,640.87 |
+1.38% |
|
Decliners |
647 |
22% |
|
Decliners |
916 |
31% |
|
Russell 2000 |
+16.40 |
1,529.43 |
+1.08% |
|
52 Wk Highs |
32 |
|
|
52 Wk Highs |
44 |
|
|
S&P 600 |
+9.16 |
938.46 |
+0.99% |
|
52 Wk Lows |
55 |
|
|
52 Wk Lows |
74 |
|
|
 |
Indices Rebound Ahead of Long Holiday Weekend
Kenneth J. Gruneisen - Passed the CAN SLIM® Master's Exam
The Dow’s 3.7% March decline left it 2.5% lower for the first quarter. The S&P 500 ebbed 2.7% in March and fell 1.2% in the first three months of the year to snap a nine-quarter winning streak. Despite the Nasdaq’s 2.9% March retreat, the Tech-heavy benchmark finished the first quarter up 2.3%. Stocks rallied on Thursday. The Dow jumped 254 points to 24103 while the S&P 500 advanced 35 points to 2640. The Nasdaq Composite was up 114 points to 7063. The volume totals reported were higher than the prior session totals on the NYSE and higher on the Nasdaq exchange, indicative of greater institutional buying demand. Breadth was positive as advancers led decliners by nearly a 4-1 margin on the NYSE and by more than a 2-1 margin on the Nasdaq exchange. There were 19 high-ranked companies from the Leaders List that made new 52-week highs and were listed on the BreakOuts Page, versus the total of 9 on the prior session. New 52-week lows totals still outnumbered new 52-week highs totals on the NYSE and on the Nasdaq exchange. Charts used courtesy of www.stockcharts.com
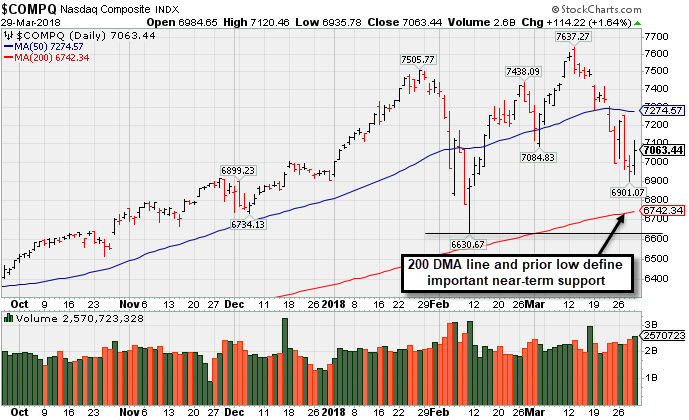 PICTURED: The Nasdaq Composite Index ended the session -7.5% off its record high hit on March 13th. The prior low and 200 DMA line define important near-term support.
The major indices (M criteria) prior uptrend has come under greater pressure in the past week. New buying efforts are only justified when all key criteria of the fact-based investment system are satisfied. The Featured Stocks Page provides the most timely analysis on high-ranked leaders that are noteworthy and action worthy.
The major averages closed out the month of March and the first quarter on a high note. Thursday’s gains left the Dow with a 2.4% weekly climb, while the S&P 500 added 2.0% and the Nasdaq finished 1.0% higher.
Investors paid close attention to economic data Thursday. The Core PCE Deflator, the Fed’s preferred proxy for inflation, posted a 1.6% annual rise in February, the largest gain since April 2017. Weekly initial jobless claims dropped to the lowest level since January 1973 while the University of Michigan reported consumer sentiment rose to the highest level since 2004 in March.
Ten of 11 sectors in the S&P 500 finished higher with Energy shares pacing gains. The Tech sector also outperformed with Facebook (FB +4.4%) and NVidia (NVDA +4.9%) bounced back. Meanwhile, Amazon (AMZN +1.1%) rose despite a tweet from President Trump that questioned the eCommerce giant’s tax treatment. In earnings, PVH (PVH +5.2%) rose after beating Wall Street earnings estimates.
Treasuries finished higher with the yield on the benchmark 10-year note down four basis points to 2.74%. |
 Kenneth J. Gruneisen started out as a licensed stockbroker in August 1987, a couple of months prior to the historic stock market crash that took the Dow Jones Industrial Average down -22.6% in a single day. He has published daily fact-based fundamental and technical analysis on high-ranked stocks online for two decades. Through FACTBASEDINVESTING.COM, Kenneth provides educational articles, news, market commentary, and other information regarding proven investment systems that work in good times and bad.
Comments contained in the body of this report are technical opinions only and are not necessarily those of Gruneisen Growth Corp. The material herein has been obtained from sources believed to be reliable and accurate, however, its accuracy and completeness cannot be guaranteed. Our firm, employees, and customers may effect transactions, including transactions contrary to any recommendation herein, or have positions in the securities mentioned herein or options with respect thereto. Any recommendation contained in this report may not be suitable for all investors and it is not to be deemed an offer or solicitation on our part with respect to the purchase or sale of any securities. |
|
 |
Financial, Retail, Tech, and Commodity-Linked Groups Rose
Kenneth J. Gruneisen - Passed the CAN SLIM® Master's Exam
On Thursday the Broker/Dealer Index ($XBD +1.99%) and the Bank Index ($BKX +1.30%) rose along with the Retail Index ($RLX +1.57%) giving the major indices a boost. The Semiconductor Index ($SOX +2.24%), Networking Index ($NWX +1.81%) led the tech sector while the Biotechnology Index ($BTK +0.15%) eked out a small gain. Commodity linked groups had a positive bias as the Gold & Silver Index ($XAU +1.85%), Oil Services Index ($OSX +2.53%), and Integrated Oil Index ($XOI +2.04%) each ended solidly higher. Charts courtesy wwwstockcharts.com
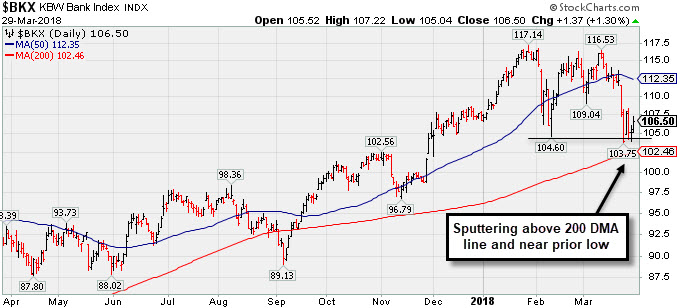 PICTURED: The Bank Index ($BKX +1.30%) has slumped below its 50-day moving average (DMA) line, sputtering above its 200 DMA line and near the prior low.
| Oil Services |
$OSX |
135.69 |
+3.34 |
+2.52% |
-9.27% |
| Integrated Oil |
$XOI |
1,326.80 |
+26.48 |
+2.04% |
-0.66% |
| Semiconductor |
$SOX |
1,328.90 |
+29.08 |
+2.24% |
+6.05% |
| Networking |
$NWX |
526.70 |
+9.37 |
+1.81% |
+7.37% |
| Broker/Dealer |
$XBD |
282.73 |
+5.52 |
+1.99% |
+6.59% |
| Retail |
$RLX |
1,929.60 |
+29.91 |
+1.57% |
+11.30% |
| Gold & Silver |
$XAU |
81.12 |
+1.48 |
+1.86% |
-4.87% |
| Bank |
$BKX |
106.50 |
+1.37 |
+1.30% |
-0.20% |
| Biotech |
$BTK |
4,504.23 |
+6.67 |
+0.15% |
+6.68% |
|
|
|
 |
Very Extended and Enduring Distributional Pressure
Kenneth J. Gruneisen - Passed the CAN SLIM® Master's Exam
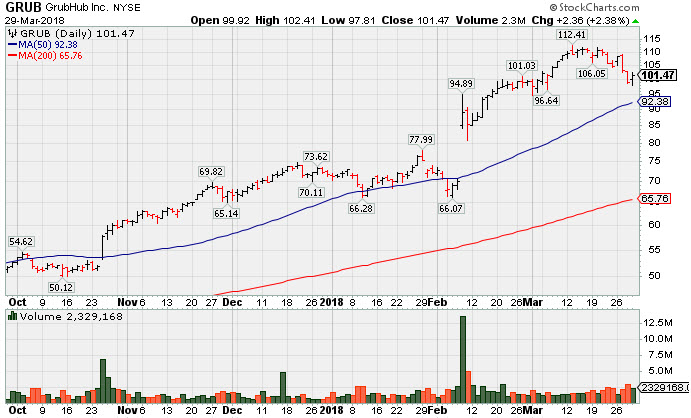
Grubhub Inc (GRUB +$2.36 or +2.38% to $101.47) has been enduring distributional pressure in recent weeks and pulling back after getting very extended from any sound base. Its 50-day moving average (DMA) line ($92.30) defines near-term support. Recently reported earnings +61% on +49% sales revenues for the Dec '17 quarter.
is perched near its all-time high, very extended from any sound base. Recently it reported earnings +61% on +49% sales revenues for the Dec '17 quarter, followed by bullish action including a big "breakaway gap" on 2/08/18. It was last shown in this FSU section on 2/07/18 with an annotated graph under the headline, "Slumped Below 50-Day Average With Earnings News Due" .
Prior to the latest report, Grubhub had reported Sep '17 quarterly earnings +22% on +32% sales revenues, marking a 2nd quarter were below the +25% minimum earnings guideline (C criteria) of the fact-based investment system.
GRUB traded up as much as +154% since first highlighted in yellow with pivot point cited based on its 9/29/16 high plus 10 cents in the 4/28/17 mid-day report (read here). Its annual earnings (A criteria) history has been very strong since the high ranked Internet Content firm completed a new Public Offering on 9/03/14.
It has earned a current Timeliness rating of A and a Sponsorship rating of B, and its Accumulation/Distribution rating is E. The number of top-rated funds owning its shares rose from 376 in Mar '17 to 466 in Dec '17, a reassuring sign concerning the I criteria. The current Up/Down Volume Ratio of 1.4 is an unbiased indication its shares have been under accumulation over the past 50 days. It has a fairly small supply of only 87.2 million shares (S criteria) outstanding, which can contribute to greater price volatility in the event of institutional buying or selling.
|
|
|
Color Codes Explained :
Y - Better candidates highlighted by our
staff of experts.
G - Previously featured
in past reports as yellow but may no longer be buyable under the
guidelines.
***Last / Change / Volume data in this table is the closing quote data***
Symbol/Exchange
Company Name
Industry Group |
PRICE |
CHANGE
(%Change) |
Day High |
Volume
(% DAV)
(% 50 day avg vol) |
52 Wk Hi
% From Hi |
Featured
Date |
Price
Featured |
Pivot Featured |
|
Max Buy |
SIVB
-
NASDAQ
S V B Financial Group
BANKING - Regional - Pacific Banks
|
$240.01
|
+4.20
1.78% |
$243.19
|
715,604
101.79% of 50 DAV
50 DAV is 703,000
|
$271.79
-11.69%
|
3/12/2018
|
$267.79
|
PP = $263.19
|
|
MB = $276.35
|
Most Recent Note - 3/28/2018 1:20:40 PM
G - Met resistance and slumped further after violating its 50 DMA line triggering a technical sell signal. Only a prompt rebound above the 50 DMA line ($252) would help its outlook improve.
>>> FEATURED STOCK ARTICLE : Endured Distributional Pressure After Wedging Higher - 3/12/2018 |
View all notes |
Set NEW NOTE alert |
Company Profile |
SEC
News |
Chart |
Request a new note
C
A
S
I |
TPL
-
NYSE
Texas Pacific Land Trust
FINANCIAL SERVICES - Diversified Investments
|
$505.42
|
+6.61
1.33% |
$520.00
|
24,769
165.13% of 50 DAV
50 DAV is 15,000
|
$569.99
-11.33%
|
2/20/2018
|
$517.00
|
PP = $569.99
|
|
MB = $598.49
|
Most Recent Note - 3/28/2018 1:26:29 PM
G - A rebound above the 50 DMA line ($520) is needed for its outlook to improve. Today's loss is testing the prior low ($480 on 2/09/18) and more damaging losses may trigger a worrisome technical sell signal. Reported earnings +29% on +118% sales revenues for the Dec '17 quarter.
>>> FEATURED STOCK ARTICLE : Slump Under 50-Day Average Line Hurt Near Term Outlook - 3/23/2018 |
View all notes |
Set NEW NOTE alert |
Company Profile |
SEC
News |
Chart |
Request a new note
C
A
S
I |
LMAT
-
NASDAQ
Lemaitre Vascular Inc
Medical-Products
|
$36.23
|
+0.12
0.33% |
$36.89
|
110,906
84.66% of 50 DAV
50 DAV is 131,000
|
$39.88
-9.15%
|
3/19/2018
|
$36.77
|
PP = $39.98
|
|
MB = $41.98
|
Most Recent Note - 3/26/2018 6:28:10 PM
Y - Suffered a 4th consecutive small loss on near average volume. Remains perched within striking distance of the new pivot point cited based on its 10/20/17 high plus 10 cents. Subsequent volume-driven gains for new highs are needed to trigger a technical buy signal. Fundamentals remain strong.
>>> FEATURED STOCK ARTICLE : Rebounding Near High After Choppy Consolidation - 3/19/2018 |
View all notes |
Set NEW NOTE alert |
Company Profile |
SEC
News |
Chart |
Request a new note
C
A
S
I |
PETS
-
NASDAQ
Petmed Express Inc
RETAIL - Drug Stores
|
$41.75
|
-0.64
-1.51% |
$42.85
|
473,989
68.79% of 50 DAV
50 DAV is 689,000
|
$57.80
-27.77%
|
1/19/2018
|
$53.59
|
PP = $51.00
|
|
MB = $53.55
|
Most Recent Note - 3/23/2018 5:07:29 PM
G - Big loss today led to a close below the 200 DMA line triggering a technical sell signal. A rebound above the 50 DMA line ($46.19) is needed for its outlook to improve. Faces near-term resistance due to overhead supply up to the $57 level. Recently reported earnings +83% on +14% sales revenues, continuing its strong earnings track record.
>>> FEATURED STOCK ARTICLE : Recently Endured Distributional Pressure - 3/15/2018 |
View all notes |
Set NEW NOTE alert |
Company Profile |
SEC
News |
Chart |
Request a new note
C
A
S
I |
DPZ
-
NYSE
Dominos Pizza Inc
WHOLESALE - Food Wholesale
|
$233.56
|
-0.31
-0.13% |
$235.87
|
960,896
95.52% of 50 DAV
50 DAV is 1,006,000
|
$236.00
-1.03%
|
2/20/2018
|
$224.86
|
PP = $222.01
|
|
MB = $233.11
|
 Most Recent Note - 3/29/2018 5:31:46 PM
Y - Still quietly hovering near its high. Stalled soon after highlighted in the 2/20/18 mid-day report with pivot point cited based on its 1/25/18 high plus 10 cents.
>>> FEATURED STOCK ARTICLE : Popular Pizza Firm Perched Near All Time High - 3/21/2018 |
View all notes |
Set NEW NOTE alert |
Company Profile |
SEC
News |
Chart |
Request a new note
C
A
S
I |
Symbol/Exchange
Company Name
Industry Group |
PRICE |
CHANGE
(%Change) |
Day High |
Volume
(% DAV)
(% 50 day avg vol) |
52 Wk Hi
% From Hi |
Featured
Date |
Price
Featured |
Pivot Featured |
|
Max Buy |
FIVE
-
NASDAQ
Five Below Inc
Retail-DiscountandVariety
|
$73.34
|
+2.57
3.63% |
$73.50
|
1,173,757
103.69% of 50 DAV
50 DAV is 1,132,000
|
$73.55
-0.29%
|
3/9/2018
|
$68.58
|
PP = $73.65
|
|
MB = $77.33
|
Most Recent Note - 3/23/2018 12:49:20 PM
Y - Early gain today challenged its all-time high. Posted a solid volume-driven gain on the prior session after reporting earnings +31% on +30% sales revenues for the Jan '18 quarter, continuing its strong earnings track record. New pivot point was cited based on its 1/05/18 high plus 10 cents. Subsequent volume-driven gains above the pivot point may trigger a new (or add-on) technical buy signal. Consolidating above its 50 DMA line ($66.80). The recent low ($60.00 on 2/06/18) defines important near-term support to watch on pullbacks.
>>> FEATURED STOCK ARTICLE : Retailer Rebounding Within Striking Distance of Prior High - 3/9/2018 |
View all notes |
Set NEW NOTE alert |
Company Profile |
SEC
News |
Chart |
Request a new note
C
A
S
I |
SPLK
-
NASDAQ
Splunk Inc
Computer Sftwr-Database
|
$98.39
|
+2.45
2.55% |
$99.38
|
2,473,349
124.23% of 50 DAV
50 DAV is 1,991,000
|
$112.66
-12.67%
|
2/15/2018
|
$96.06
|
PP = $93.68
|
|
MB = $98.36
|
Most Recent Note - 3/29/2018 12:51:06 PM
Y - Finding support near its 50 DMA ($96.92) line and prior high in the $97 area. Pulled back below its "max buy" level this week. Subsequent damaging losses would raise concerns and trigger a more worrisome technical sell signal.
>>> FEATURED STOCK ARTICLE : Extended After Rallying from Secondary Buy Point - 3/20/2018 |
View all notes |
Set NEW NOTE alert |
Company Profile |
SEC
News |
Chart |
Request a new note
C
A
S
I |
PAYC
-
NYSE
Paycom Software Inc
COMPUTER SOFTWARE and SERVICES - Application Software
|
$107.39
|
+2.21
2.10% |
$109.00
|
881,682
110.76% of 50 DAV
50 DAV is 796,000
|
$115.48
-7.01%
|
2/15/2018
|
$95.01
|
PP = $93.61
|
|
MB = $98.29
|
Most Recent Note - 3/28/2018 1:11:55 PM
G - Very extended from any sound base, and there was a "negative reversal" on the prior session after hitting another new all-time high. Its 50 DMA line ($98.15) defines near-term support above prior highs in the $93 area. Fundamentals remain strong.
>>> FEATURED STOCK ARTICLE : Extended From Prior Base After Streak of Gains - 3/7/2018 |
View all notes |
Set NEW NOTE alert |
Company Profile |
SEC
News |
Chart |
Request a new note
C
A
S
I |
GRUB
-
NYSE
Grubhub Inc
COMPUTER SOFTWARE and SERVICES - Technical and System Software
|
$101.47
|
+2.36
2.38% |
$102.41
|
2,324,427
118.41% of 50 DAV
50 DAV is 1,963,000
|
$112.41
-9.73%
|
6/21/2017
|
$47.33
|
PP = $46.94
|
|
MB = $49.29
|
Most Recent Note - 3/29/2018 5:30:53 PM
G - Posted a gain today. Enduring distributional pressure in recent weeks. Remains extended from any sound base. Its 50 DMA line ($92.38) defines near-term support. Recently reported earnings +61% on +49% sales revenues for the Dec '17 quarter. See the latest FSU analysis for more details and a new annotated graph.
>>> FEATURED STOCK ARTICLE : Very Extended and Enduring Distributional Pressure - 3/29/2018 |
View all notes |
Set NEW NOTE alert |
Company Profile |
SEC
News |
Chart |
Request a new note
C
A
S
I |
HQY
-
NASDAQ
Healthequity Inc
COMPUTER SOFTWARE and SERVICES - Healthcare Information Service
|
$60.54
|
+0.06
0.10% |
$61.20
|
697,174
91.61% of 50 DAV
50 DAV is 761,000
|
$68.75
-11.94%
|
2/20/2018
|
$56.37
|
PP = $55.41
|
|
MB = $58.18
|
Most Recent Note - 3/23/2018 1:00:50 PM
G - Pulling back today following 3 consecutive volume-driven gains hitting new all-time highs and getting very extended from any sound base. Prior highs in the $55 area define initial support along with its 50 DMA line. Reported earnings +57% on +29% sales revenues for the Jan '18 quarter versus the year ago period.
>>> FEATURED STOCK ARTICLE : Bullish Action Followed Latest Earnings Report - 3/22/2018 |
View all notes |
Set NEW NOTE alert |
Company Profile |
SEC
News |
Chart |
Request a new note
C
A
S
I |
Symbol/Exchange
Company Name
Industry Group |
PRICE |
CHANGE
(%Change) |
Day High |
Volume
(% DAV)
(% 50 day avg vol) |
52 Wk Hi
% From Hi |
Featured
Date |
Price
Featured |
Pivot Featured |
|
Max Buy |
LOB
-
NASDAQ
Live Oak Bancshares Inc
Banks-Southeast
|
$27.80
|
+0.05
0.18% |
$28.20
|
94,764
64.47% of 50 DAV
50 DAV is 147,000
|
$30.05
-7.49%
|
3/16/2018
|
$28.63
|
PP = $28.30
|
|
MB = $29.72
|
Most Recent Note - 3/27/2018 4:10:01 PM
Y - Pulled back below its pivot point with today's loss on light volume. Rallied above the pivot point cited based on its 1/25/18 high plus 10 cents when highlighted in yellow in the 3/16/18 mid-day report (read here). The gain and close above the pivot point was backed by +393% above average volume as it triggered a technical buy signal. Reported very strong sales revenues and earnings increases for the Sep and Dec '17 quarters. Completed a new Public Offering on 8/09/17. Prior quarterly and annual earnings (C and A criteria) history is a good match with the fact-based investment system's guidelines.
>>> FEATURED STOCK ARTICLE : Tallied Volume-Driven Gain for New High - 3/16/2018 |
View all notes |
Set NEW NOTE alert |
Company Profile |
SEC
News |
Chart |
Request a new note
C
A
S
I |
PYPL
-
NASDAQ
Paypal Holdings Inc
Finance-CrdtCard/PmtPr
|
$75.87
|
+0.81
1.08% |
$77.20
|
10,964,082
106.70% of 50 DAV
50 DAV is 10,276,000
|
$86.32
-12.11%
|
2/1/2018
|
$80.35
|
PP = $79.49
|
|
MB = $83.46
|
Most Recent Note - 3/28/2018 1:14:10 PM
G - Slumping well below its 50 DMA line ($79.57) and a rebound above that important short-term average is needed for its outlook to improve. The prior low ($71.63 on 2/09/18) defines the next important support level where a violation would raise concerns and trigger a more worrisome technical sell signal. Fundamentals remain strong.
>>> FEATURED STOCK ARTICLE : Sputtering Below 50-Day Moving Average Again - 3/27/2018 |
View all notes |
Set NEW NOTE alert |
Company Profile |
SEC
News |
Chart |
Request a new note
C
A
S
I |
OLLI
-
NASDAQ
Ollie's Bargain Outlet
Retail-DiscountandVariety
|
$60.30
|
+1.40
2.38% |
$60.85
|
628,747
129.37% of 50 DAV
50 DAV is 486,000
|
$62.05
-2.82%
|
11/21/2017
|
$46.78
|
PP = $47.00
|
|
MB = $49.35
|
Most Recent Note - 3/26/2018 6:31:32 PM
G - Posted a big gain today with near average volume, rebounding near its all-time high. Near-term support is defined by its 50 DMA line ($57.51) and prior low ($54.44 on 3/09/18).
>>> FEATURED STOCK ARTICLE : Bargain Outlet's Shares Perched Near All-Time Price High - 3/13/2018 |
View all notes |
Set NEW NOTE alert |
Company Profile |
SEC
News |
Chart |
Request a new note
C
A
S
I |
WB
-
NASDAQ
Weibo Corp Cl A Ads
INTERNET - Content
|
$119.54
|
+4.45
3.87% |
$121.25
|
2,118,785
104.99% of 50 DAV
50 DAV is 2,018,000
|
$142.12
-15.89%
|
1/16/2018
|
$126.33
|
PP = $122.21
|
|
MB = $128.32
|
Most Recent Note - 3/27/2018 3:53:23 PM
G - Met resistance and today's big loss on higher volume has it slumping further below its 50 DMA line ($129.67). Recently reported earnings +88% on +77% sales revenues for the Dec '17 quarter, continuing its strong earnings track record.
>>> FEATURED STOCK ARTICLE : Recent Consolidation is Not a New Base of Sufficient Length - 3/8/2018 |
View all notes |
Set NEW NOTE alert |
Company Profile |
SEC
News |
Chart |
Request a new note
C
A
S
I |
SQ
-
NYSE
Square Inc Cl A
Finance-CrdtCard/PmtPr
|
$49.20
|
+1.81
3.82% |
$49.79
|
18,290,042
117.75% of 50 DAV
50 DAV is 15,533,000
|
$58.46
-15.84%
|
3/5/2018
|
$49.70
|
PP = $49.66
|
|
MB = $52.14
|
Most Recent Note - 3/28/2018 6:26:27 PM
Y - Suffered a big loss on heavy volume falling back into the prior base, testing its 50 DMA line ($47.05) and prior highs in the $47-49 area defining important support. More damaging losses would raise greater concerns. Fundamentals remain strong.
>>> FEATURED STOCK ARTICLE : New High & Considerable Gain Backed By Twice Average Volume - 3/5/2018 |
View all notes |
Set NEW NOTE alert |
Company Profile |
SEC
News |
Chart |
Request a new note
C
A
S
I |
Symbol/Exchange
Company Name
Industry Group |
PRICE |
CHANGE
(%Change) |
Day High |
Volume
(% DAV)
(% 50 day avg vol) |
52 Wk Hi
% From Hi |
Featured
Date |
Price
Featured |
Pivot Featured |
|
Max Buy |
SEND
-
NYSE
Sendgrid Inc
INTERNET - Content
|
$28.14
|
+0.79
2.89% |
$28.63
|
154,911
68.54% of 50 DAV
50 DAV is 226,000
|
$32.03
-12.13%
|
3/6/2018
|
$28.00
|
PP = $28.37
|
|
MB = $29.79
|
Most Recent Note - 3/27/2018 4:08:15 PM
Y - Erased an early gain today and ended near the session low with a big loss on higher (below average) volume. Retreated below its "max buy" level and its color code is changed to yellow. Prior highs in the $27-28 area define initial support to watch on pullbacks.
>>> FEATURED STOCK ARTICLE : Recently Profitable Internet - Content Firm Rallied to New High - 3/6/2018 |
View all notes |
Set NEW NOTE alert |
Company Profile |
SEC
News |
Chart |
Request a new note
C
A
S
I |
|
|
|
THESE ARE NOT BUY RECOMMENDATIONS!
Comments contained in the body of this report are technical
opinions only. The material herein has been obtained
from sources believed to be reliable and accurate, however,
its accuracy and completeness cannot be guaranteed.
This site is not an investment advisor, hence it does
not endorse or recommend any securities or other investments.
Any recommendation contained in this report may not
be suitable for all investors and it is not to be deemed
an offer or solicitation on our part with respect to
the purchase or sale of any securities. All trademarks,
service marks and trade names appearing in this report
are the property of their respective owners, and are
likewise used for identification purposes only.
This report is a service available
only to active Paid Premium Members.
You may opt-out of receiving report notifications
at any time. Questions or comments may be submitted
by writing to Premium Membership Services 665 S.E. 10 Street, Suite 201 Deerfield Beach, FL 33441-5634 or by calling 1-800-965-8307
or 954-785-1121.
|
|
|