You are not logged in.
This means you
CAN ONLY VIEW reports that were published prior to Thursday, March 20, 2025.
You
MUST UPGRADE YOUR MEMBERSHIP if you want to see any current reports.
AFTER MARKET UPDATE - TUESDAY, APRIL 3RD, 2018
Previous After Market Report Next After Market Report >>>
|
|
|
|
DOW |
+389.17 |
24,033.36 |
+1.65% |
|
Volume |
899,808,820 |
-2% |
|
Volume |
2,319,592,670 |
-3% |
|
NASDAQ |
+71.16 |
6,941.28 |
+1.04% |
|
Advancers |
2,209 |
75% |
|
Advancers |
1,912 |
65% |
|
S&P 500 |
+32.57 |
2,614.45 |
+1.26% |
|
Decliners |
748 |
25% |
|
Decliners |
1,027 |
35% |
|
Russell 2000 |
+19.62 |
1,512.15 |
+1.31% |
|
52 Wk Highs |
14 |
|
|
52 Wk Highs |
31 |
|
|
S&P 600 |
+13.68 |
930.92 |
+1.49% |
|
52 Wk Lows |
89 |
|
|
52 Wk Lows |
94 |
|
|
 |
Major Indices Rose With Less Volume and Leadership
Kenneth J. Gruneisen - Passed the CAN SLIM® Master's Exam
Stocks finished higher Tuesday. The Dow added 389 points to 24033. The S&P 500 climbed 32 points to 2614 while the Nasdaq was up 71 points to 6941. The volume totals reported were lighter than the prior session totals on the NYSE and on the Nasdaq exchange, indicative of less impressive institutional buying demand. Breadth was positive as advancers led decliners by about a 3-1 margin on the NYSE and near a 2-1 margin on the Nasdaq exchange. There were 5 high-ranked companies from the Leaders List that made new 52-week highs and were listed on the BreakOuts Page, versus the total of 9 on the prior session. New 52-week lows totals outnumbered new 52-week highs totals on the NYSE and on the Nasdaq exchange. Charts used courtesy of www.stockcharts.com
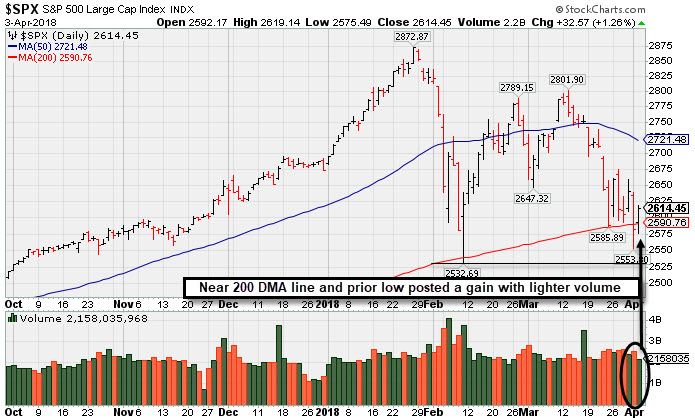 PICTURED: The S&P 500 Index posted a gain on lighter volume and ended the session -9% off its record high hit on January 26th. The prior low and 200 DMA line (2.590) define important near-term support.
The major indices (M criteria) have shown weakness indicative of a correction. Investors following the fact-based investment system reduce market exposure during weak market periods by selling any stocks triggering technical sell signals on a case-by-case basis. Once a new confirmed rally with a solid follow through day occurs it will be noted and new buying efforts will again be justified only when all key criteria of the fact-based investment system are satisfied. The Featured Stocks Page provides the most timely analysis on high-ranked leaders.
The major averages rebounded after posting their worst start to a second quarter since 1929. During Monday’s sell-off, the S&P 500 fell below its 200-day moving average as tech shares underperformed. On the economic front, a report showed U.S. vehicle sales jumped to 17.4 million in March, beating expectations of 16.9 million. In central bank news, the New York Fed selected San Francisco Fed President John Williams to succeed William Dudley.
All 11 S&P 500 sectors finished higher as Energy and Healthcare paced gains. Chipmakers also outperformed after posting their worst daily decline in more than two years Monday. Broadcom (AVGO +4.00%) and Micron (MU +2.98%). In corporate news, Amazon (AMZN +1.46%) as the White House reported the Trump administration is not seeking action regarding President’s criticism of Amazon. Shares of Viacom (VIA -6.19%) amid reports CBS (CBS +4.24%) is considering an all-stock offer to purchase the company at a discount to its current market value.
Treasuries were weaker with the yield on the benchmark 10-year note rising five basis points to 2.78%. In commodities, NYMEX WTI crude was up 0.9% to $63.55/barrel. COMEX Gold declined 0.7% to $1332.80/ounce, amid a slightly stronger dollar. |
 Kenneth J. Gruneisen started out as a licensed stockbroker in August 1987, a couple of months prior to the historic stock market crash that took the Dow Jones Industrial Average down -22.6% in a single day. He has published daily fact-based fundamental and technical analysis on high-ranked stocks online for two decades. Through FACTBASEDINVESTING.COM, Kenneth provides educational articles, news, market commentary, and other information regarding proven investment systems that work in good times and bad.
Comments contained in the body of this report are technical opinions only and are not necessarily those of Gruneisen Growth Corp. The material herein has been obtained from sources believed to be reliable and accurate, however, its accuracy and completeness cannot be guaranteed. Our firm, employees, and customers may effect transactions, including transactions contrary to any recommendation herein, or have positions in the securities mentioned herein or options with respect thereto. Any recommendation contained in this report may not be suitable for all investors and it is not to be deemed an offer or solicitation on our part with respect to the purchase or sale of any securities. |
|
 |
Financial, Retail, Tech, and Energy-Linked Groups Rose
Kenneth J. Gruneisen - Passed the CAN SLIM® Master's Exam
On Tuesday the Retail Index ($RLX +1.19%), Broker/Dealer Index ($XBD +1.32%) and the Bank Index ($BKX +1.50%) helped the major indices bounce. The Biotechnology Index ($BTK +0.82%), Semiconductor Index ($SOX +1.96%), and the Networking Index ($NWX +1.01%) posted unanimous gains. Commodity linked groups were mixed as the Oil Services Index ($OSX +2.25%) and Integrated Oil Index ($XOI +2.31%) each ended solidly higher but the Gold & Silver Index ($XAU -0.96%) was lower. Charts courtesy wwwstockcharts.com
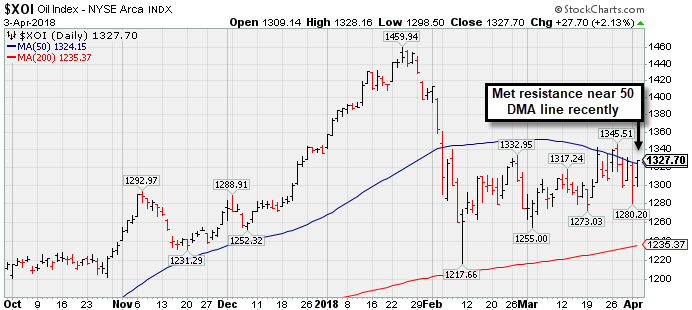 PICTURED: The Integrated Oil Index ($XOI +2.31%) met resistance near its 50-day moving average (DMA) line when recently trying to rebound.
| Oil Services |
$OSX |
135.09 |
+2.96 |
+2.24% |
-9.67% |
| Integrated Oil |
$XOI |
1,327.70 |
+27.70 |
+2.13% |
-0.59% |
| Semiconductor |
$SOX |
1,302.09 |
+25.08 |
+1.96% |
+3.91% |
| Networking |
$NWX |
524.52 |
+5.26 |
+1.01% |
+6.93% |
| Broker/Dealer |
$XBD |
280.78 |
+3.65 |
+1.32% |
+5.86% |
| Retail |
$RLX |
1,876.86 |
+22.09 |
+1.19% |
+8.25% |
| Gold & Silver |
$XAU |
81.22 |
-0.79 |
-0.96% |
-4.75% |
| Bank |
$BKX |
105.92 |
+1.57 |
+1.50% |
-0.74% |
| Biotech |
$BTK |
4,319.49 |
+34.94 |
+0.82% |
+2.30% |
|
|
|
 |
Slumped Into Prior Base Testing 50-Day Average
Kenneth J. Gruneisen - Passed the CAN SLIM® Master's Exam
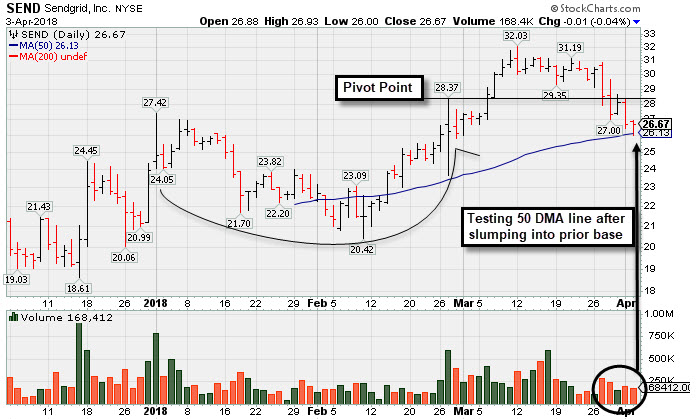
Sendgrid Inc (SEND -$0.01 or -0.04% to $26.67) has slumped back into the prior base, undercutting prior highs in the $27-28 area, raising concerns. Disciplined investors always limit losses by selling any stock that falls more than -7% from their purchase price.
It was last shown in this FSU section on 3/06/18 under the headline , "Recently Profitable Internet - Content Firm Rallied to New High". It was highlighted in yellow with pivot point cited based on its 2/27/18 high in the earlier mid-day report (read here). It hit a new high with a gain backed by +80% above average volume, triggering a technical buy signal while rising from a 9-week cup-with-high-handle pattern.
The company showed strong sales revenues and earnings increases in quarterly comparisons through Dec '17. It had a profitable FY '17 after years of shrinking losses of 29 cents per share in FY '14, a loss of 11 cents per share in FY '15, and a loss of 3 cents per share in FY '16. Some concerns remain due to its limited annual earnings (A criteria) history since its $16 IPO on 11/15/17.
There are only 15.3 million shares in the public float (S criteria) and as of Dec '17 only 100 top-rated funds reportedly own its shares. Its current Up/Down Volume Ratio of 1.4 is an unbiased indication its shares have been under slight accumulation over the past 50 days. It has a Timeliness rating of A and a Sponsorship rating of A. |
|
|
Color Codes Explained :
Y - Better candidates highlighted by our
staff of experts.
G - Previously featured
in past reports as yellow but may no longer be buyable under the
guidelines.
***Last / Change / Volume data in this table is the closing quote data***
Symbol/Exchange
Company Name
Industry Group |
PRICE |
CHANGE
(%Change) |
Day High |
Volume
(% DAV)
(% 50 day avg vol) |
52 Wk Hi
% From Hi |
Featured
Date |
Price
Featured |
Pivot Featured |
|
Max Buy |
SIVB
-
NASDAQ
S V B Financial Group
BANKING - Regional - Pacific Banks
|
$236.49
|
+3.07
1.32% |
$238.65
|
549,955
76.28% of 50 DAV
50 DAV is 721,000
|
$271.79
-12.99%
|
3/12/2018
|
$267.79
|
PP = $263.19
|
|
MB = $276.35
|
 Most Recent Note - 4/3/2018 6:43:17 PM
G - Sputtering near the prior low ($226.61 on 2/06/18) defining important near-term support. Only a prompt rebound above the 50 DMA line ($251.22) would help its outlook improve.
>>> FEATURED STOCK ARTICLE : Endured Distributional Pressure After Wedging Higher - 3/12/2018 |
View all notes |
Set NEW NOTE alert |
Company Profile |
SEC
News |
Chart |
Request a new note
C
A
S
I |
TPL
-
NYSE
Texas Pacific Land Trust
FINANCIAL SERVICES - Diversified Investments
|
$512.12
|
+3.62
0.71% |
$514.00
|
9,123
60.82% of 50 DAV
50 DAV is 15,000
|
$569.99
-10.15%
|
2/20/2018
|
$517.00
|
PP = $569.99
|
|
MB = $598.49
|
Most Recent Note - 4/3/2018 6:46:15 PM
G - Meeting resistance, but a rebound above the 50 DMA line ($517.78) is needed for its outlook to improve. Recent lows ($480) define important support where damaging losses may trigger a worrisome technical sell signal.
>>> FEATURED STOCK ARTICLE : Slump Under 50-Day Average Line Hurt Near Term Outlook - 3/23/2018 |
View all notes |
Set NEW NOTE alert |
Company Profile |
SEC
News |
Chart |
Request a new note
C
A
S
I |
LMAT
-
NASDAQ
Lemaitre Vascular Inc
Medical-Products
|
$36.44
|
+0.83
2.33% |
$36.60
|
133,643
101.24% of 50 DAV
50 DAV is 132,000
|
$39.88
-8.63%
|
3/19/2018
|
$36.77
|
PP = $39.98
|
|
MB = $41.98
|
Most Recent Note - 4/3/2018 6:38:55 PM
Y - Posted a gain today with average volume, finding support near its 50 DMA line ($35.47). Perched within striking distance of the new pivot point cited based on its 10/20/17 high plus 10 cents. Subsequent volume-driven gains for new highs are needed to trigger a technical buy signal.
>>> FEATURED STOCK ARTICLE : Rebounding Near High After Choppy Consolidation - 3/19/2018 |
View all notes |
Set NEW NOTE alert |
Company Profile |
SEC
News |
Chart |
Request a new note
C
A
S
I |
DPZ
-
NYSE
Dominos Pizza Inc
WHOLESALE - Food Wholesale
|
$233.47
|
+3.05
1.32% |
$234.45
|
539,037
53.48% of 50 DAV
50 DAV is 1,008,000
|
$236.93
-1.46%
|
2/20/2018
|
$224.86
|
PP = $222.01
|
|
MB = $233.11
|
Most Recent Note - 3/29/2018 5:31:46 PM
Y - Still quietly hovering near its high. Stalled soon after highlighted in the 2/20/18 mid-day report with pivot point cited based on its 1/25/18 high plus 10 cents.
>>> FEATURED STOCK ARTICLE : Popular Pizza Firm Perched Near All Time High - 3/21/2018 |
View all notes |
Set NEW NOTE alert |
Company Profile |
SEC
News |
Chart |
Request a new note
C
A
S
I |
FIVE
-
NASDAQ
Five Below Inc
Retail-DiscountandVariety
|
$71.90
|
-0.37
-0.51% |
$73.24
|
1,057,198
91.61% of 50 DAV
50 DAV is 1,154,000
|
$73.86
-2.65%
|
3/9/2018
|
$68.58
|
PP = $73.65
|
|
MB = $77.33
|
Most Recent Note - 4/2/2018 4:50:41 PM
Y - Touched a new high today but finished lower. Reported earnings +31% on +30% sales revenues for the Jan '18 quarter, continuing its strong earnings track record. New pivot point was cited based on its 1/05/18 high plus 10 cents. Subsequent volume-driven gains above the pivot point may trigger a new (or add-on) technical buy signal. Its 50 DMA line ($67.22) defines important near-term support to watch on pullbacks.
>>> FEATURED STOCK ARTICLE : Retailer Rebounding Within Striking Distance of Prior High - 3/9/2018 |
View all notes |
Set NEW NOTE alert |
Company Profile |
SEC
News |
Chart |
Request a new note
C
A
S
I |
Symbol/Exchange
Company Name
Industry Group |
PRICE |
CHANGE
(%Change) |
Day High |
Volume
(% DAV)
(% 50 day avg vol) |
52 Wk Hi
% From Hi |
Featured
Date |
Price
Featured |
Pivot Featured |
|
Max Buy |
SPLK
-
NASDAQ
Splunk Inc
Computer Sftwr-Database
|
$97.86
|
+0.49
0.50% |
$99.29
|
1,243,334
61.64% of 50 DAV
50 DAV is 2,017,000
|
$112.66
-13.14%
|
2/15/2018
|
$96.06
|
PP = $93.68
|
|
MB = $98.36
|
Most Recent Note - 3/29/2018 12:51:06 PM
Y - Finding support near its 50 DMA ($96.92) line and prior high in the $97 area. Pulled back below its "max buy" level this week. Subsequent damaging losses would raise concerns and trigger a more worrisome technical sell signal.
>>> FEATURED STOCK ARTICLE : Extended After Rallying from Secondary Buy Point - 3/20/2018 |
View all notes |
Set NEW NOTE alert |
Company Profile |
SEC
News |
Chart |
Request a new note
C
A
S
I |
PAYC
-
NYSE
Paycom Software Inc
COMPUTER SOFTWARE and SERVICES - Application Software
|
$104.77
|
+0.89
0.86% |
$105.66
|
601,492
74.35% of 50 DAV
50 DAV is 809,000
|
$115.48
-9.27%
|
2/15/2018
|
$95.01
|
PP = $93.61
|
|
MB = $98.29
|
Most Recent Note - 4/3/2018 6:41:07 PM
G - Consolidating above its 50 DMA line ($99.08) which defines near-term support above prior highs in the $93 area. Fundamentals remain strong.
>>> FEATURED STOCK ARTICLE : Extended From Prior Base After Streak of Gains - 3/7/2018 |
View all notes |
Set NEW NOTE alert |
Company Profile |
SEC
News |
Chart |
Request a new note
C
A
S
I |
GRUB
-
NYSE
Grubhub Inc
COMPUTER SOFTWARE and SERVICES - Technical and System Software
|
$97.64
|
+0.05
0.05% |
$99.50
|
1,048,642
52.33% of 50 DAV
50 DAV is 2,004,000
|
$112.41
-13.14%
|
6/21/2017
|
$47.33
|
PP = $46.94
|
|
MB = $49.29
|
Most Recent Note - 3/29/2018 5:30:53 PM
G - Posted a gain today. Enduring distributional pressure in recent weeks. Remains extended from any sound base. Its 50 DMA line ($92.38) defines near-term support. Recently reported earnings +61% on +49% sales revenues for the Dec '17 quarter. See the latest FSU analysis for more details and a new annotated graph.
>>> FEATURED STOCK ARTICLE : Very Extended and Enduring Distributional Pressure - 3/29/2018 |
View all notes |
Set NEW NOTE alert |
Company Profile |
SEC
News |
Chart |
Request a new note
C
A
S
I |
HQY
-
NASDAQ
Healthequity Inc
COMPUTER SOFTWARE and SERVICES - Healthcare Information Service
|
$62.41
|
+2.02
3.34% |
$62.72
|
597,585
77.31% of 50 DAV
50 DAV is 773,000
|
$68.75
-9.22%
|
2/20/2018
|
$56.37
|
PP = $55.41
|
|
MB = $58.18
|
Most Recent Note - 4/3/2018 6:39:48 PM
G - Still hovering near its all-time high, extended from any sound base. Prior highs in the $55 area define initial support along with its 50 DMA line.
>>> FEATURED STOCK ARTICLE : Bullish Action Followed Latest Earnings Report - 3/22/2018 |
View all notes |
Set NEW NOTE alert |
Company Profile |
SEC
News |
Chart |
Request a new note
C
A
S
I |
LOB
-
NASDAQ
Live Oak Bancshares Inc
Banks-Southeast
|
$27.75
|
+0.45
1.65% |
$27.90
|
100,032
67.59% of 50 DAV
50 DAV is 148,000
|
$30.05
-7.65%
|
3/16/2018
|
$28.63
|
PP = $28.30
|
|
MB = $29.72
|
Most Recent Note - 4/2/2018 5:07:34 PM
Y - Slumped further below its pivot point and tested its 50 DMA line ($26.99) with today's loss on light volume. More damaging losses would raise greater concerns.
>>> FEATURED STOCK ARTICLE : Tallied Volume-Driven Gain for New High - 3/16/2018 |
View all notes |
Set NEW NOTE alert |
Company Profile |
SEC
News |
Chart |
Request a new note
C
A
S
I |
Symbol/Exchange
Company Name
Industry Group |
PRICE |
CHANGE
(%Change) |
Day High |
Volume
(% DAV)
(% 50 day avg vol) |
52 Wk Hi
% From Hi |
Featured
Date |
Price
Featured |
Pivot Featured |
|
Max Buy |
PYPL
-
NASDAQ
Paypal Holdings Inc
Finance-CrdtCard/PmtPr
|
$74.56
|
-0.44
-0.59% |
$75.41
|
8,865,096
84.96% of 50 DAV
50 DAV is 10,434,000
|
$86.32
-13.62%
|
2/1/2018
|
$80.35
|
PP = $79.49
|
|
MB = $83.46
|
Most Recent Note - 4/2/2018 5:02:46 PM
G - Still sputtering below its 50 DMA line ($79.27). A rebound above that important short-term average is needed for its outlook to improve. The prior low ($71.63 on 2/09/18) defines the next important support level where a violation would raise concerns and trigger a more worrisome technical sell signal.
>>> FEATURED STOCK ARTICLE : Sputtering Below 50-Day Moving Average Again - 3/27/2018 |
View all notes |
Set NEW NOTE alert |
Company Profile |
SEC
News |
Chart |
Request a new note
C
A
S
I |
OLLI
-
NASDAQ
Ollie's Bargain Outlet
Retail-DiscountandVariety
|
$59.00
|
-0.20
-0.34% |
$59.95
|
666,061
135.93% of 50 DAV
50 DAV is 490,000
|
$62.05
-4.92%
|
11/21/2017
|
$46.78
|
PP = $47.00
|
|
MB = $49.35
|
Most Recent Note - 4/2/2018 4:58:25 PM
G - Consolidating in an orderly fashion near its all-time high. Its 50 DMA line ($57.85) and prior low ($54.44 on 3/09/18) define near-term support.
>>> FEATURED STOCK ARTICLE : Bargain Outlet's Shares Perched Near All-Time Price High - 3/13/2018 |
View all notes |
Set NEW NOTE alert |
Company Profile |
SEC
News |
Chart |
Request a new note
C
A
S
I |
WB
-
NASDAQ
Weibo Corp Cl A Ads
INTERNET - Content
|
$115.01
|
-0.80
-0.69% |
$116.99
|
1,337,695
66.03% of 50 DAV
50 DAV is 2,026,000
|
$142.12
-19.08%
|
1/16/2018
|
$126.33
|
PP = $122.21
|
|
MB = $128.32
|
Most Recent Note - 4/2/2018 5:09:33 PM
G - Still sputtering below its 50 DMA line ($129) after damaging volume-driven losses. A rebound above that short-term average is needed for its outlook to improve.
>>> FEATURED STOCK ARTICLE : Recent Consolidation is Not a New Base of Sufficient Length - 3/8/2018 |
View all notes |
Set NEW NOTE alert |
Company Profile |
SEC
News |
Chart |
Request a new note
C
A
S
I |
SQ
-
NYSE
Square Inc Cl A
Finance-CrdtCard/PmtPr
|
$47.58
|
-0.10
-0.21% |
$48.87
|
9,773,220
62.16% of 50 DAV
50 DAV is 15,722,000
|
$58.46
-18.61%
|
3/5/2018
|
$49.70
|
PP = $49.66
|
|
MB = $52.14
|
Most Recent Note - 4/2/2018 6:05:42 PM
Y - Still testing its 50 DMA line ($47.38) and prior highs in the $47-49 area defining important support. Suffered a big loss 3/28/18 on heavy volume falling back into the prior base, More damaging losses would raise greater concerns. See the latest FSU analysis for more details and a new annotated graph.
>>> FEATURED STOCK ARTICLE : Slumped Back Into Prior Base Testing 50-Day Average - 4/2/2018 |
View all notes |
Set NEW NOTE alert |
Company Profile |
SEC
News |
Chart |
Request a new note
C
A
S
I |
SEND
-
NYSE
Sendgrid Inc
INTERNET - Content
|
$26.67
|
-0.01
-0.04% |
$26.93
|
168,397
76.20% of 50 DAV
50 DAV is 221,000
|
$32.03
-16.72%
|
3/6/2018
|
$28.00
|
PP = $28.37
|
|
MB = $29.79
|
Most Recent Note - 4/3/2018 6:36:46 PM
Y - Slumped into the prior base with recent losses raising concerns and testing its 50 DMA line ($26.13). Disciplined investors always limit losses by selling any stock that falls more than -7% from their purchase price. See the latest FSU analysis for more details and a new annotated graph.
>>> FEATURED STOCK ARTICLE : Slumped Into Prior Base Testing 50-Day Average - 4/3/2018 |
View all notes |
Set NEW NOTE alert |
Company Profile |
SEC
News |
Chart |
Request a new note
C
A
S
I |
Symbol/Exchange
Company Name
Industry Group |
PRICE |
CHANGE
(%Change) |
Day High |
Volume
(% DAV)
(% 50 day avg vol) |
52 Wk Hi
% From Hi |
Featured
Date |
Price
Featured |
Pivot Featured |
|
Max Buy |
|
|
|
THESE ARE NOT BUY RECOMMENDATIONS!
Comments contained in the body of this report are technical
opinions only. The material herein has been obtained
from sources believed to be reliable and accurate, however,
its accuracy and completeness cannot be guaranteed.
This site is not an investment advisor, hence it does
not endorse or recommend any securities or other investments.
Any recommendation contained in this report may not
be suitable for all investors and it is not to be deemed
an offer or solicitation on our part with respect to
the purchase or sale of any securities. All trademarks,
service marks and trade names appearing in this report
are the property of their respective owners, and are
likewise used for identification purposes only.
This report is a service available
only to active Paid Premium Members.
You may opt-out of receiving report notifications
at any time. Questions or comments may be submitted
by writing to Premium Membership Services 665 S.E. 10 Street, Suite 201 Deerfield Beach, FL 33441-5634 or by calling 1-800-965-8307
or 954-785-1121.
|
|
|