You are not logged in.
This means you
CAN ONLY VIEW reports that were published prior to Thursday, March 20, 2025.
You
MUST UPGRADE YOUR MEMBERSHIP if you want to see any current reports.
AFTER MARKET UPDATE - THURSDAY, MARCH 22ND, 2018
Previous After Market Report Next After Market Report >>>
|
|
|
|
DOW |
-724.42 |
23,957.89 |
-2.93% |
|
Volume |
949,832,920 |
+19% |
|
Volume |
2,354,128,500 |
+18% |
|
NASDAQ |
-178.61 |
7,166.68 |
-2.43% |
|
Advancers |
534 |
18% |
|
Advancers |
578 |
20% |
|
S&P 500 |
-68.24 |
2,643.69 |
-2.52% |
|
Decliners |
2,431 |
82% |
|
Decliners |
2,384 |
80% |
|
Russell 2000 |
-35.43 |
1,543.87 |
-2.24% |
|
52 Wk Highs |
25 |
|
|
52 Wk Highs |
39 |
|
|
S&P 600 |
-20.74 |
943.41 |
-2.15% |
|
52 Wk Lows |
129 |
|
|
52 Wk Lows |
62 |
|
|
 |
Breadth Negative as Indices Show Distributional Action
Kenneth J. Gruneisen - Passed the CAN SLIM® Master's Exam
Stocks finished firmly lower Thursday. The major indices (M criteria) have seen the latest uptrend come under greater pressure. The Dow was off 724 points to 23957. The S&P 500 lost 68 points to 2643. The Nasdaq Composite was down 178 points to 7166. The volume totals reported were higher than the prior session totals on the NYSE and on the Nasdaq exchange, indicative of distributional pressure from large institutional investors. Breadth was solidly negative as decliners led advancers by more than a 4-1 margin on the NYSE and on the Nasdaq exchange. Leadership contracted as there were 13 high-ranked companies from the Leaders List that made new 52-week highs and were listed on the BreakOuts Page, versus the total of 57 on the prior session. New 52-week lows outnumbered new 52-week highs totals on the NYSE and on the Nasdaq exchange. Charts used courtesy of www.stockcharts.com
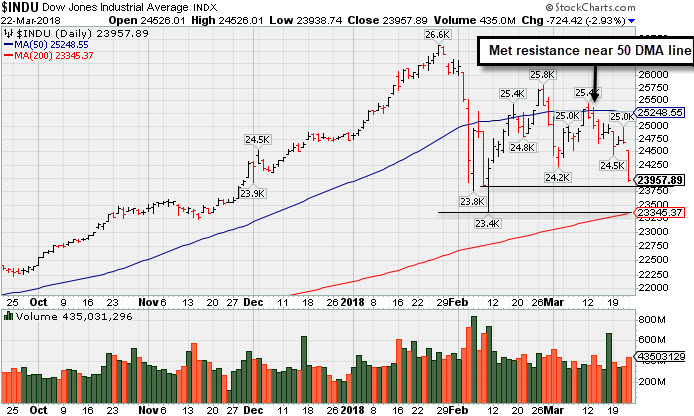 PICTURED: The Dow Jones Industrial Average recently met resistance near its 50-day moving average (DMA) line. It ended the session -10% off its record high hit on January 26th. The prior low and 200 DMA line define important near-term support.
New buying efforts are justified when all key criteria of the fact-based investment system are satisfied. The Featured Stocks Page provides the most timely analysis on high-ranked leaders that are noteworthy and action worthy.
The Dow fell back into correction territory amid fresh investor uncertainty surrounding trade protectionism. President Trump announced tariffs on at least $50 billion of Chinese imports in an attempt to narrow the growing trade gap between the two counties, and in retribution for “tremendous intellectual property theft”. Following the news, a perceived “risk off” tone took hold in the markets. Treasuries rallied the most in six months, with the yield on the 10-year note falling seven basis points to 2.82%.
Ten of 11 sectors in the S&P 500 finished lower with Financials leading the losses. JP Morgan Chase & Co (JPM -4.2%) and Bank of America (BAC -4.1%) both sank. Industrials also retreated with Boeing (BA -5.2%) and Caterpillar (CAT -5.7%) both down considerably. Healthcare shares were weighed down by a big decline for AbbVie (ABBV -12.76%) following disappointing trial data on a key drug. The recent weakness in the Technology sector also continued, with Alphabet (GOOG -3.83%) falling.
In commodities, NYMEX WTI crude slumped 1.5% to $64.22/barrel while COMEX Gold gained 0.5% to $1328.30/ounce.
On the data front, weekly initial jobless claims increased slightly to 229,000 while the Leading Economic Index rose 0.6% in February, topping projections for a 0.4% gain. |
 Kenneth J. Gruneisen started out as a licensed stockbroker in August 1987, a couple of months prior to the historic stock market crash that took the Dow Jones Industrial Average down -22.6% in a single day. He has published daily fact-based fundamental and technical analysis on high-ranked stocks online for two decades. Through FACTBASEDINVESTING.COM, Kenneth provides educational articles, news, market commentary, and other information regarding proven investment systems that work in good times and bad.
Comments contained in the body of this report are technical opinions only and are not necessarily those of Gruneisen Growth Corp. The material herein has been obtained from sources believed to be reliable and accurate, however, its accuracy and completeness cannot be guaranteed. Our firm, employees, and customers may effect transactions, including transactions contrary to any recommendation herein, or have positions in the securities mentioned herein or options with respect thereto. Any recommendation contained in this report may not be suitable for all investors and it is not to be deemed an offer or solicitation on our part with respect to the purchase or sale of any securities. |
|
 |
Financial, Tech, Retail, and Commodity-Linked Groups Fell
Kenneth J. Gruneisen - Passed the CAN SLIM® Master's Exam
On Thursday financial shares led a broad market retreat as the Broker/Dealer Index ($XBD -3.57%) and Bank Index ($BKX -4.14%) both ended solidly lower. The Retail Index ($RLX -2.17%) also fell. The Semiconductor Index ($SOX -2.77%), Networking Index ($NWX -1.80%), and the Biotechnology Index ($BTK -2.30%) suffered unanimous losses. Commodity-linked groups also lost ground as the Oil Services Index ($OSX -3.08%), Integrated Oil Index ($XOI -1.79%), and the Gold & Silver Index ($XAU -1.49%) each lost ground. Charts courtesy wwwstockcharts.com
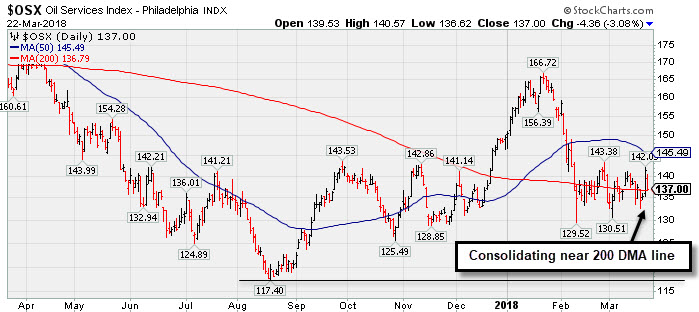 PICTURED: The Oil Services Index ($OSX -3.08%) is consolidating near its 200-day moving average (DMA) line, still well above its August 2017 low.
| Oil Services |
$OSX |
137.00 |
-4.36 |
-3.08% |
-8.39% |
| Integrated Oil |
$XOI |
1,310.87 |
-23.83 |
-1.79% |
-1.85% |
| Semiconductor |
$SOX |
1,368.98 |
-39.00 |
-2.77% |
+9.25% |
| Networking |
$NWX |
535.16 |
-9.82 |
-1.80% |
+9.10% |
| Broker/Dealer |
$XBD |
284.49 |
-10.53 |
-3.57% |
+7.26% |
| Retail |
$RLX |
1,973.58 |
-43.78 |
-2.17% |
+13.83% |
| Gold & Silver |
$XAU |
79.39 |
-1.20 |
-1.49% |
-6.90% |
| Bank |
$BKX |
107.54 |
-4.65 |
-4.14% |
+0.78% |
| Biotech |
$BTK |
4,600.10 |
-108.20 |
-2.30% |
+8.95% |
|
|
|
 |
Bullish Action Followed Latest Earnings Report
Kenneth J. Gruneisen - Passed the CAN SLIM® Master's Exam
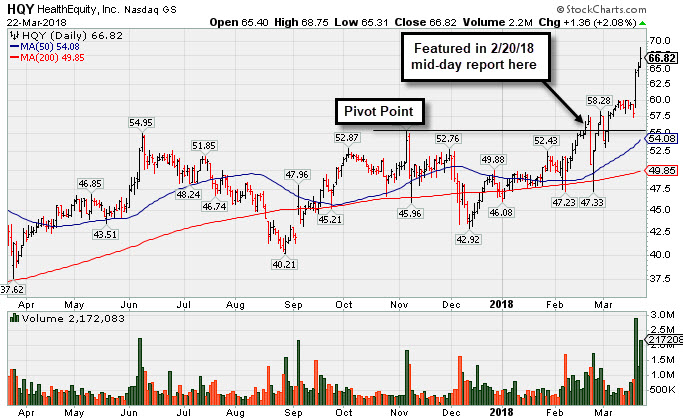
Healthequity Inc (HQY +$1.36 or +2.08% to $66.82) tallied a 3rd consecutive volume-driven gain hitting new all-time highs, getting very extended from any sound base. Prior highs in the $55 area define initial support along with its 50-day moving average (DMA) line.
Bullish action came after it reported earnings +57% on +29% sales revenues for the Jan '18 quarter versus the year ago period, continuing its strong earnings track record. HQY's fundamentals remain strong, as the past 4 quarterly comparisons were above the +25% minimum earnings guideline (C criteria) and underpinned by strong sales revenues increases.
Members were previously reminded - "Disciplined investors always limit losses by selling any stock that falls more than -7% from their purchase price, knowing they can always buy back any stock if strength returns." HQY was last shown in this FSU section on 2/21/18 with an annotated graph under the headline, "Fundamentals Remained Favorable and Strength Returned", as it hit a new high with a 9th consecutive gain. It triggered a technical buy signal with a gain above the new pivot point cited backed by +90% above average volume on the prior session when highlighted in the 2/20/18 mid-day report (read here).
The number of top-rated funds owning its shares rose from 369 in Dec '16 to 436 in Dec '17, a reassuring sign concerning the I criteria. Its current Up/Down Volume Ratio of 2.6 is also an unbiased indication its shares have been under accumulation over the past 50 days. It has a fairly small supply of only 60.7 million shares (S criteria) outstanding, which can contribute to greater price volatility in the event of institutional buying or selling. It currently has a Timeliness Rating of A and a Sponsorship Rating of C.
The Commercial Services - Outsourcing industry group currently has a Group Relative Strength Rating of 71, however there are other strong leaders in the group hitting new highs, a reassuring sign concerning the L criteria. It completed its $14 IPO on 7/31/14 followed by an additional Public Offering on 5/05/15 and Secondary Offerings on both 10/20/16 and 9/23/15. |
|
|
Color Codes Explained :
Y - Better candidates highlighted by our
staff of experts.
G - Previously featured
in past reports as yellow but may no longer be buyable under the
guidelines.
***Last / Change / Volume data in this table is the closing quote data***
Symbol/Exchange
Company Name
Industry Group |
PRICE |
CHANGE
(%Change) |
Day High |
Volume
(% DAV)
(% 50 day avg vol) |
52 Wk Hi
% From Hi |
Featured
Date |
Price
Featured |
Pivot Featured |
|
Max Buy |
SIVB
-
NASDAQ
S V B Financial Group
BANKING - Regional - Pacific Banks
|
$250.67
|
-14.37
-5.42% |
$262.23
|
750,753
113.92% of 50 DAV
50 DAV is 659,000
|
$271.79
-7.77%
|
3/12/2018
|
$267.79
|
PP = $263.19
|
|
MB = $276.35
|
 Most Recent Note - 3/22/2018 7:02:02 PM
G - Violated its 50 DMA line ($253.14) with a big loss today on higher volume triggering a technical sell signal and its color code is changed to green. Only a prompt rebound above the 50 DMA line would help its outlook improve.
>>> FEATURED STOCK ARTICLE : Endured Distributional Pressure After Wedging Higher - 3/12/2018 |
View all notes |
Set NEW NOTE alert |
Company Profile |
SEC
News |
Chart |
Request a new note
C
A
S
I |
TPL
-
NYSE
Texas Pacific Land Trust
FINANCIAL SERVICES - Diversified Investments
|
$512.00
|
-6.09
-1.18% |
$522.00
|
15,338
90.22% of 50 DAV
50 DAV is 17,000
|
$569.99
-10.17%
|
2/20/2018
|
$517.00
|
PP = $569.99
|
|
MB = $598.49
|
Most Recent Note - 3/19/2018 6:05:57 PM
G - Color code is changed to green after slumping and closing below its 50 DMA line ($519.72). A prompt rebound above the 50 DMA line is needed for its outlook to improve. The prior low ($480 on 2/09/18) is the next important support level. Reported earnings +29% on +118% sales revenues for the Dec '17 quarter.
>>> FEATURED STOCK ARTICLE : Finding Support Above 50-Day Moving Average Line - 2/22/2018 |
View all notes |
Set NEW NOTE alert |
Company Profile |
SEC
News |
Chart |
Request a new note
C
A
S
I |
YY
-
NASDAQ
YY Inc
INTERNET - Internet Service Providers
|
$118.48
|
-8.17
-6.45% |
$125.60
|
2,046,086
121.79% of 50 DAV
50 DAV is 1,680,000
|
$142.97
-17.13%
|
12/29/2017
|
$113.06
|
PP = $123.58
|
|
MB = $129.76
|
Most Recent Note - 3/22/2018 7:03:27 PM
G - Slumped again today after meeting resistance at its 50 DMA line ($127.75) which is now downward sloping. The prior low ($109.06 on 2/09/18) defines the next important support to watch. Reported earnings +55% on +56% sales revenues for the Dec '17 quarter, continuing its strong earnings track record.
>>> FEATURED STOCK ARTICLE : Earnings News Due Next Week for Chinese Social Platform - 2/27/2018 |
View all notes |
Set NEW NOTE alert |
Company Profile |
SEC
News |
Chart |
Request a new note
C
A
S
I |
LOGM
-
NASDAQ
Logmein Inc
INTERNET - Internet Software andamp; Services
|
$119.30
|
-5.35
-4.29% |
$123.35
|
460,458
80.19% of 50 DAV
50 DAV is 574,200
|
$134.80
-11.50%
|
2/15/2018
|
$132.35
|
PP = $129.61
|
|
MB = $136.09
|
Most Recent Note - 3/22/2018 7:10:41 PM
G - Color code is changed to green after violating its 50 DMA line ($122.61) with today's big loss. Recently found support at its 200 DMA line. Its Relative Strength rating is 75, below the 80+ minimum guideline for buy candidates.
>>> FEATURED STOCK ARTICLE : Rebounding After Finding Support at 200-Day Average - 3/14/2018 |
View all notes |
Set NEW NOTE alert |
Company Profile |
SEC
News |
Chart |
Request a new note
C
A
S
I |
HTHT
-
NASDAQ
China Lodging Group Ads
LEISURE - Lodging
|
$129.02
|
+0.16
0.12% |
$130.98
|
554,376
96.75% of 50 DAV
50 DAV is 573,000
|
$166.19
-22.37%
|
12/22/2017
|
$138.07
|
PP = $142.90
|
|
MB = $150.05
|
Most Recent Note - 3/21/2018 6:01:57 PM
G - Erased an early gain today and ended near the session low. Testing support near its February low ($128.60). Gapped down on 3/14/18 triggering a technical sell signal. A rebound above the 50 DMA line is needed for its outlook to improve. Reported earnings +86% on +42% sales revenues for the Dec '17 quarter.
>>> FEATURED STOCK ARTICLE : Repaired Recent Technical Damage But Has Not Formed a New Base - 2/23/2018 |
View all notes |
Set NEW NOTE alert |
Company Profile |
SEC
News |
Chart |
Request a new note
C
A
S
I |
Symbol/Exchange
Company Name
Industry Group |
PRICE |
CHANGE
(%Change) |
Day High |
Volume
(% DAV)
(% 50 day avg vol) |
52 Wk Hi
% From Hi |
Featured
Date |
Price
Featured |
Pivot Featured |
|
Max Buy |
LMAT
-
NASDAQ
Lemaitre Vascular Inc
Medical-Products
|
$36.16
|
-0.36
-0.99% |
$37.15
|
136,115
106.34% of 50 DAV
50 DAV is 128,000
|
$39.88
-9.33%
|
3/19/2018
|
$36.77
|
PP = $39.98
|
|
MB = $41.98
|
Most Recent Note - 3/19/2018 6:09:12 PM
Y - Highlighted in yellow with new pivot point cited based on its 10/20/17 high plus 10 cents in the earlier mid-day report. Subsequent volume-driven gains for new highs are needed to trigger a technical buy signal. Fundamentals remain strong, as it reported +62% earnings on +12% sales revenues for the Dec '17 quarter. Recently consolidating above its 50 and 200 DMA lines. It was dropped from the Featured Stocks list on 12/04/17. See the latest FSU analysis for more details and a new annotated graph.
>>> FEATURED STOCK ARTICLE : Rebounding Near High After Choppy Consolidation - 3/19/2018 |
View all notes |
Set NEW NOTE alert |
Company Profile |
SEC
News |
Chart |
Request a new note
C
A
S
I |
PETS
-
NASDAQ
Petmed Express Inc
RETAIL - Drug Stores
|
$44.46
|
-0.20
-0.45% |
$45.04
|
396,720
57.33% of 50 DAV
50 DAV is 692,000
|
$57.80
-23.08%
|
1/19/2018
|
$53.59
|
PP = $51.00
|
|
MB = $53.55
|
Most Recent Note - 3/20/2018 6:46:34 PM
G - Found support at its 200 DMA line. A rebound above the 50 DMA line ($46.54) is needed for its outlook to improve. Faces near-term resistance due to overhead supply up to the $57 level. Recently reported earnings +83% on +14% sales revenues, continuing its strong earnings track record.
>>> FEATURED STOCK ARTICLE : Recently Endured Distributional Pressure - 3/15/2018 |
View all notes |
Set NEW NOTE alert |
Company Profile |
SEC
News |
Chart |
Request a new note
C
A
S
I |
DPZ
-
NYSE
Dominos Pizza Inc
WHOLESALE - Food Wholesale
|
$226.40
|
-1.86
-0.81% |
$231.56
|
915,936
85.52% of 50 DAV
50 DAV is 1,071,000
|
$236.00
-4.07%
|
2/20/2018
|
$224.86
|
PP = $222.01
|
|
MB = $233.11
|
Most Recent Note - 3/21/2018 5:56:40 PM
Y - Volume totals have been cooling while hovering near its high. Stalled soon after highlighted in the 2/20/18 mid-day report with pivot point cited based on its 1/25/18 high plus 10 cents. See the latest FSU analysis for more details and a new annotated graph.
>>> FEATURED STOCK ARTICLE : Popular Pizza Firm Perched Near All Time High - 3/21/2018 |
View all notes |
Set NEW NOTE alert |
Company Profile |
SEC
News |
Chart |
Request a new note
C
A
S
I |
FIVE
-
NASDAQ
Five Below Inc
Retail-DiscountandVariety
|
$69.96
|
+2.82
4.20% |
$70.65
|
4,675,143
460.15% of 50 DAV
50 DAV is 1,016,000
|
$73.55
-4.88%
|
3/9/2018
|
$68.58
|
PP = $73.65
|
|
MB = $77.33
|
Most Recent Note - 3/22/2018 12:10:02 PM
Y - Reported earnings +31% on +30% sales revenues for the Jan '18 quarter, continuing its strong earnings track record. New pivot point was cited based on its 1/05/18 high plus 10 cents. Subsequent volume-driven gains above the pivot point may trigger a new (or add-on) technical buy signal. Consolidating above its 50 DMA line ($66.70). The recent low ($60.00 on 2/06/18) defines important near-term support to watch on pullbacks.
>>> FEATURED STOCK ARTICLE : Retailer Rebounding Within Striking Distance of Prior High - 3/9/2018 |
View all notes |
Set NEW NOTE alert |
Company Profile |
SEC
News |
Chart |
Request a new note
C
A
S
I |
SPLK
-
NASDAQ
Splunk Inc
Computer Sftwr-Database
|
$105.88
|
-3.00
-2.76% |
$108.77
|
1,562,360
84.04% of 50 DAV
50 DAV is 1,859,000
|
$112.66
-6.02%
|
2/15/2018
|
$96.06
|
PP = $93.68
|
|
MB = $98.36
|
Most Recent Note - 3/20/2018 6:38:22 PM
G - Posted a solid volume-driven gain for a new all-time high. Disciplined investors avoid chasing extended stocks. Its 50 DMA line and prior highs define support to watch on pullbacks. See the latest FSU analysis for more details and a new annotated graph.
>>> FEATURED STOCK ARTICLE : Extended After Rallying from Secondary Buy Point - 3/20/2018 |
View all notes |
Set NEW NOTE alert |
Company Profile |
SEC
News |
Chart |
Request a new note
C
A
S
I |
Symbol/Exchange
Company Name
Industry Group |
PRICE |
CHANGE
(%Change) |
Day High |
Volume
(% DAV)
(% 50 day avg vol) |
52 Wk Hi
% From Hi |
Featured
Date |
Price
Featured |
Pivot Featured |
|
Max Buy |
PAYC
-
NYSE
Paycom Software Inc
COMPUTER SOFTWARE and SERVICES - Application Software
|
$110.73
|
-2.28
-2.02% |
$112.71
|
626,683
81.18% of 50 DAV
50 DAV is 772,000
|
$113.93
-2.81%
|
2/15/2018
|
$95.01
|
PP = $93.61
|
|
MB = $98.29
|
Most Recent Note - 3/20/2018 6:42:41 PM
G - Perched near its all-time high, very extended from any sound base. Prior highs in the $93 area define initial support above its 50 DMA line ($95.27). Fundamentals remain strong.
>>> FEATURED STOCK ARTICLE : Extended From Prior Base After Streak of Gains - 3/7/2018 |
View all notes |
Set NEW NOTE alert |
Company Profile |
SEC
News |
Chart |
Request a new note
C
A
S
I |
GRUB
-
NYSE
Grubhub Inc
COMPUTER SOFTWARE and SERVICES - Technical and System Software
|
$105.91
|
-4.11
-3.74% |
$109.72
|
2,524,059
130.98% of 50 DAV
50 DAV is 1,927,000
|
$112.41
-5.78%
|
6/21/2017
|
$47.33
|
PP = $46.94
|
|
MB = $49.29
|
Most Recent Note - 3/19/2018 6:00:24 PM
G - Pulling back from its all-time high, very extended from any sound base. Well above its 50 DMA line and prior highs defining near-term support. Recently reported earnings +61% on +49% sales revenues for the Dec '17 quarter.
>>> FEATURED STOCK ARTICLE : Bullish Action Followed Last Earnings Report - 3/1/2018 |
View all notes |
Set NEW NOTE alert |
Company Profile |
SEC
News |
Chart |
Request a new note
C
A
S
I |
HQY
-
NASDAQ
Healthequity Inc
COMPUTER SOFTWARE and SERVICES - Healthcare Information Service
|
$66.82
|
+1.36
2.08% |
$68.75
|
2,172,083
319.42% of 50 DAV
50 DAV is 680,000
|
$66.25
0.86%
|
2/20/2018
|
$56.37
|
PP = $55.41
|
|
MB = $58.18
|
Most Recent Note - 3/22/2018 7:06:54 PM
G - Tallied a 3rd consecutive gain hitting new all-time highs and getting very extended from any sound base. Prior highs in the $55 area define initial support along with its 50 DMA line. Reported earnings +57% on +29% sales revenues for the Jan '18 quarter versus the year ago period. See the latest FSU analysis for more details and a new annotated graph.
>>> FEATURED STOCK ARTICLE : Bullish Action Followed Latest Earnings Report - 3/22/2018 |
View all notes |
Set NEW NOTE alert |
Company Profile |
SEC
News |
Chart |
Request a new note
C
A
S
I |
LOB
-
NASDAQ
Live Oak Bancshares Inc
Banks-Southeast
|
$29.45
|
-0.15
-0.51% |
$29.95
|
220,269
155.12% of 50 DAV
50 DAV is 142,000
|
$30.05
-2.00%
|
3/16/2018
|
$28.63
|
PP = $28.30
|
|
MB = $29.72
|
Most Recent Note - 3/20/2018 6:49:07 PM
Y - Hit another new all-time high with today's 4th consecutive gain. Rallied above the pivot point cited based on its 1/25/18 high plus 10 cents when highlighted in yellow in the 3/16/18 mid-day report (read here). The gain and close above the pivot point was backed by +393% above average volume as it triggered a technical buy signal. Reported very strong sales revenues and earnings increases for the Sep and Dec '17 quarters. Completed a new Public Offering on 8/09/17. Prior quarterly and annual earnings (C and A criteria) history is a good match with the fact-based investment system's guidelines. See the latest FSU analysis for more details and an annotated graph.
>>> FEATURED STOCK ARTICLE : Tallied Volume-Driven Gain for New High - 3/16/2018 |
View all notes |
Set NEW NOTE alert |
Company Profile |
SEC
News |
Chart |
Request a new note
C
A
S
I |
PYPL
-
NASDAQ
Paypal Holdings Inc
Finance-CrdtCard/PmtPr
|
$78.56
|
-2.48
-3.06% |
$80.12
|
9,359,890
93.19% of 50 DAV
50 DAV is 10,044,000
|
$86.32
-8.99%
|
2/1/2018
|
$80.35
|
PP = $79.49
|
|
MB = $83.46
|
Most Recent Note - 3/22/2018 6:59:18 PM
G - Gapped down today and fell below the 50 DMA line raising concerns. The prior low ($71.63 on 2/09/18) defines the next important support level where a violation would raise concerns and trigger a more worrisome technical sell signal. Fundamentals remain strong.
>>> FEATURED STOCK ARTICLE : Quietly Consolidating Back Above 50-Day Moving Average - 2/26/2018 |
View all notes |
Set NEW NOTE alert |
Company Profile |
SEC
News |
Chart |
Request a new note
C
A
S
I |
Symbol/Exchange
Company Name
Industry Group |
PRICE |
CHANGE
(%Change) |
Day High |
Volume
(% DAV)
(% 50 day avg vol) |
52 Wk Hi
% From Hi |
Featured
Date |
Price
Featured |
Pivot Featured |
|
Max Buy |
OLLI
-
NASDAQ
Ollie's Bargain Outlet
Retail-DiscountandVariety
|
$58.20
|
-1.80
-3.00% |
$59.80
|
322,733
63.16% of 50 DAV
50 DAV is 511,000
|
$62.05
-6.20%
|
11/21/2017
|
$46.78
|
PP = $47.00
|
|
MB = $49.35
|
Most Recent Note - 3/19/2018 6:07:53 PM
G - Perched near its all-time high, extended from any sound base. Support is defined by its 50 DMA line ($56.81) and prior low ($50.15 on 1/04/18).
>>> FEATURED STOCK ARTICLE : Bargain Outlet's Shares Perched Near All-Time Price High - 3/13/2018 |
View all notes |
Set NEW NOTE alert |
Company Profile |
SEC
News |
Chart |
Request a new note
C
A
S
I |
WB
-
NASDAQ
Weibo Corp Cl A Ads
INTERNET - Content
|
$124.81
|
-9.33
-6.96% |
$132.00
|
3,244,694
167.86% of 50 DAV
50 DAV is 1,933,000
|
$142.12
-12.18%
|
1/16/2018
|
$126.33
|
PP = $122.21
|
|
MB = $128.32
|
Most Recent Note - 3/22/2018 1:09:32 PM
G - Today's volume-driven loss has it slumping below its 50 DMA line ($129.52) which recently acted as support. Recently reported earnings +88% on +77% sales revenues for the Dec '17 quarter, continuing its strong earnings track record.
>>> FEATURED STOCK ARTICLE : Recent Consolidation is Not a New Base of Sufficient Length - 3/8/2018 |
View all notes |
Set NEW NOTE alert |
Company Profile |
SEC
News |
Chart |
Request a new note
C
A
S
I |
HLI
-
NYSE
Houlihan Lokey Inc Cl A
Finance-Invest Bnk/Bkrs
|
$45.49
|
-2.01
-4.23% |
$47.48
|
263,924
86.25% of 50 DAV
50 DAV is 306,000
|
$52.81
-13.86%
|
1/3/2018
|
$45.88
|
PP = $47.09
|
|
MB = $49.44
|
Most Recent Note - 3/22/2018 7:05:18 PM
G - Completed a new Public Offering on 3/12/18 and it has slumped below its 50 DMA line ($47.76) raising concerns. The recent low ($43.73 on 2/06/18) defines near term support where a violation would raise greater concerns. Earnings +21% for the Dec '17 quarter were below the +25% minimum earnings guideline (C criteria).
>>> FEATURED STOCK ARTICLE : Recently Met Resistance at 50-Day Moving Average - 2/28/2018 |
View all notes |
Set NEW NOTE alert |
Company Profile |
SEC
News |
Chart |
Request a new note
C
A
S
I |
SQ
-
NYSE
Square Inc Cl A
Finance-CrdtCard/PmtPr
|
$55.16
|
-1.93
-3.38% |
$56.77
|
15,668,655
102.25% of 50 DAV
50 DAV is 15,324,000
|
$58.46
-5.64%
|
3/5/2018
|
$49.70
|
PP = $49.66
|
|
MB = $52.14
|
Most Recent Note - 3/20/2018 6:40:35 PM
G - Powered to another new high today, getting very extended from the prior base. Prior highs in the $49-47 area define initial support to watch on pullbacks. Fundamentals remain strong.
>>> FEATURED STOCK ARTICLE : New High & Considerable Gain Backed By Twice Average Volume - 3/5/2018 |
View all notes |
Set NEW NOTE alert |
Company Profile |
SEC
News |
Chart |
Request a new note
C
A
S
I |
SEND
-
NYSE
Sendgrid Inc
INTERNET - Content
|
$30.35
|
-0.49
-1.59% |
$30.97
|
107,761
48.11% of 50 DAV
50 DAV is 224,000
|
$32.03
-5.23%
|
3/6/2018
|
$28.00
|
PP = $28.37
|
|
MB = $29.79
|
Most Recent Note - 3/22/2018 7:08:00 PM
G -Volume totals have been cooling while hovering near its all-time high, extended from the previously noted base. Prior highs in the $27-28 area define initial support to watch on pullbacks.
>>> FEATURED STOCK ARTICLE : Recently Profitable Internet - Content Firm Rallied to New High - 3/6/2018 |
View all notes |
Set NEW NOTE alert |
Company Profile |
SEC
News |
Chart |
Request a new note
C
A
S
I |
Symbol/Exchange
Company Name
Industry Group |
PRICE |
CHANGE
(%Change) |
Day High |
Volume
(% DAV)
(% 50 day avg vol) |
52 Wk Hi
% From Hi |
Featured
Date |
Price
Featured |
Pivot Featured |
|
Max Buy |
|
|
|
THESE ARE NOT BUY RECOMMENDATIONS!
Comments contained in the body of this report are technical
opinions only. The material herein has been obtained
from sources believed to be reliable and accurate, however,
its accuracy and completeness cannot be guaranteed.
This site is not an investment advisor, hence it does
not endorse or recommend any securities or other investments.
Any recommendation contained in this report may not
be suitable for all investors and it is not to be deemed
an offer or solicitation on our part with respect to
the purchase or sale of any securities. All trademarks,
service marks and trade names appearing in this report
are the property of their respective owners, and are
likewise used for identification purposes only.
This report is a service available
only to active Paid Premium Members.
You may opt-out of receiving report notifications
at any time. Questions or comments may be submitted
by writing to Premium Membership Services 665 S.E. 10 Street, Suite 201 Deerfield Beach, FL 33441-5634 or by calling 1-800-965-8307
or 954-785-1121.
|
|
|