You are not logged in.
This means you
CAN ONLY VIEW reports that were published prior to Thursday, April 17, 2025.
You
MUST UPGRADE YOUR MEMBERSHIP if you want to see any current reports.
AFTER MARKET UPDATE - WEDNESDAY, APRIL 29TH, 2015
Previous After Market Report Next After Market Report >>>
|
|
|
|
DOW |
-74.61 |
18,035.53 |
-0.41% |
|
Volume |
847,734,710 |
+10% |
|
Volume |
1,731,850,510 |
-8% |
|
NASDAQ |
-31.78 |
5,023.64 |
-0.63% |
|
Advancers |
1,016 |
32% |
|
Advancers |
883 |
28% |
|
S&P 500 |
-7.91 |
2,106.85 |
-0.37% |
|
Decliners |
2,036 |
64% |
|
Decliners |
2,116 |
68% |
|
Russell 2000 |
-12.40 |
1,246.95 |
-0.98% |
|
52 Wk Highs |
54 |
|
|
52 Wk Highs |
65 |
|
|
S&P 600 |
-7.68 |
716.71 |
-1.06% |
|
52 Wk Lows |
27 |
|
|
52 Wk Lows |
54 |
|
|
 |
Breadth Negative as Major Market Averages Fell
Kenneth J. Gruneisen - Passed the CAN SLIM® Master's Exam
Stocks declined on Wednesday. The Dow lost 74 points to 18,035. The NASDAQ fell 31 points to 5,023. The session's volume totals were reported mixed, lighter than the prior session total on the Nasdaq exchange yet higher on the NYSE. Breadth was negative as decliners led advancers by more than a 2-1 margin on the Nasdaq exchange and on the NYSE. Leadership improved as there were 35 high-ranked companies from the CANSLIM.net Leaders List that made new 52-week highs and appeared on the CANSLIM.net BreakOuts Page, up from the prior session total of 23 stocks. New 52-week highs still outnumbered new 52-week lows on the NYSE and on the Nasdaq exchange. There were gains for only 2 of the 13 high-ranked companies currently on the Featured Stocks Page.
Concerning the M criteria, the major averages have overcome recent distributional pressure and leadership (stocks hitting new 52-week highs) has remained healthy, helping the rally continue. New buying efforts should only be made in stocks meeting all of the fundamental and technical guidelines the fact-based investment system.

PICTURED: The S&P 500 Index slid 7 points to 2,106, consolidating above its 50-day moving average (DMA) line.
The major averages continued to consolidate as investors digested Fed speak and mixed data. Fed officials released their statement after their two-day meeting, indicating a first quarter economic slowdown and reiterating a data-dependent path toward lifting interest rates. Separately, a report showed U.S. GDP rose 0.2% in the first quarter, falling far short of estimates for a 1.7% gain. However, pending home sales in March unexpectedly rose 1.1%.
Seven of 10 S&P 500 sectors were in negative territory. Consumer staples stocks were notable decliners, as Altria (MO -2.92%) on negative commentary. On the earnings front, Humana (HUM -7.21%) dragged health care stocks lower after disappointing quarterly results. Discretionary stocks were mixed with profit tallies sending Wynn (WYNN -16.64%) lower but Starwood (HOT +8.33%) higher. Energy was the relative outperformer in sympathy with oil prices and Chevron (CVX +0.55%) edged higher.
Treasuries finished lower, but pared losses on the Fed’s statement. The benchmark 10-year note was off 12/32 to yield 2.05%.
In commodities, WTI crude rallied 2.5% to $58.50/barrel as inventory builds slowed, but COMEX gold retreated 0.8% to $1,204.40/ounce. In FOREX, the dollar declined 0.5% with the euro up 1.2% to $1.1117/EUR and the yen down 0.2% to $119.04/USD.
The Featured Stocks Page shows recent notes and Headline Links directing members to detailed analysis with data-packed graphs annotated by a Certified expert. See the Premium Member Homepage for archives to all prior pay reports published.
|
 Kenneth J. Gruneisen started out as a licensed stockbroker in August 1987, a couple of months prior to the historic stock market crash that took the Dow Jones Industrial Average down -22.6% in a single day. He has published daily fact-based fundamental and technical analysis on high-ranked stocks online for two decades. Through FACTBASEDINVESTING.COM, Kenneth provides educational articles, news, market commentary, and other information regarding proven investment systems that work in good times and bad.
Comments contained in the body of this report are technical opinions only and are not necessarily those of Gruneisen Growth Corp. The material herein has been obtained from sources believed to be reliable and accurate, however, its accuracy and completeness cannot be guaranteed. Our firm, employees, and customers may effect transactions, including transactions contrary to any recommendation herein, or have positions in the securities mentioned herein or options with respect thereto. Any recommendation contained in this report may not be suitable for all investors and it is not to be deemed an offer or solicitation on our part with respect to the purchase or sale of any securities. |
|
 |
Financial and Commodity-Linked Groups Rose
Kenneth J. Gruneisen - Passed the CAN SLIM® Master's Exam
Financials produced some gains to partially offset weakness elsewhere as the Bank Index ($BKX +0.93%) outpaced the Broker/Dealer Index ($XBD +0.58%). The Oil Services Index ($OSX +2.52%) was a standout gainer while the Integrated Oil Index ($XOI +0.21%) posted a smaller gain and the Gold & Silver Index ($XAU +0.80%) also ratcheted higher. The tech sector saw losses from the Networking Index ($NWX -1.32%) and the Semiconductor Index ($SOX -0.58%) while the Biotechnology Index ($BTK +0.03%) finished flat. Weakness for the Retail Index ($RLX -1.14%) also created a drag on the major averages.
Charts courtesy www.stockcharts.com
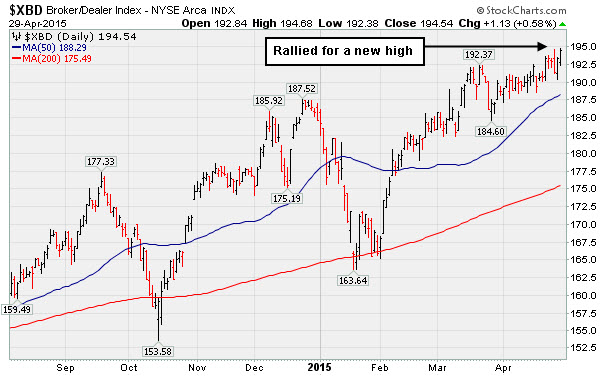
PICTURED: The Broker/Dealer Index ($XBD +0.58%) rallied for a new high..
| Oil Services |
$OSX |
218.92 |
+5.38 |
+2.52% |
+3.82% |
| Integrated Oil |
$XOI |
1,439.35 |
+2.98 |
+0.21% |
+6.77% |
| Semiconductor |
$SOX |
692.19 |
-4.05 |
-0.58% |
+0.77% |
| Networking |
$NWX |
381.28 |
-5.12 |
-1.32% |
+6.52% |
| Broker/Dealer |
$XBD |
194.54 |
+1.13 |
+0.58% |
+5.36% |
| Retail |
$RLX |
1,131.46 |
-13.01 |
-1.14% |
+9.56% |
| Gold & Silver |
$XAU |
74.71 |
+0.59 |
+0.80% |
+8.62% |
| Bank |
$BKX |
73.96 |
+0.68 |
+0.93% |
-0.40% |
| Biotech |
$BTK |
3,879.54 |
+1.17 |
+0.03% |
+12.81% |
|
|
|
 |
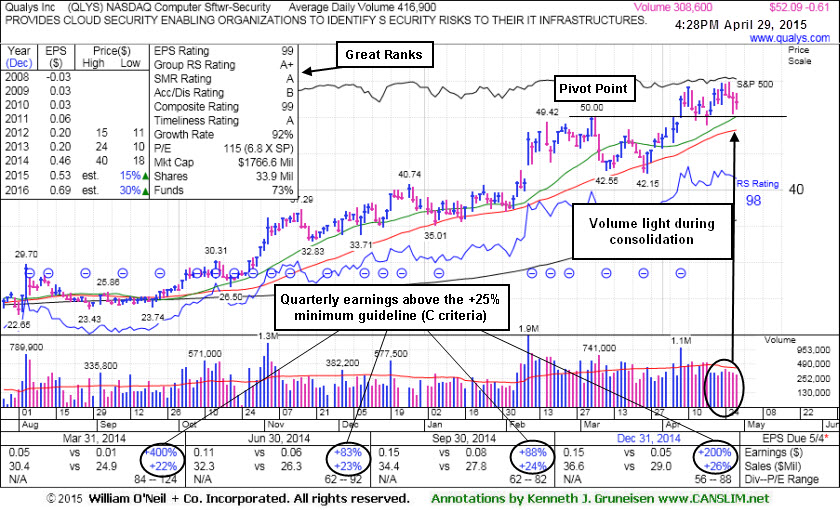
Quiet Consolidation Within 5% of Prior Pivot Point
Kenneth J. Gruneisen - Passed the CAN SLIM® Master's Exam
Qualys Inc (QLYS -$0.61 or -1.16% to $52.09) has been quietly consolidating and its color code is changed to yellow after pulling back below its "max buy" level. It found support near prior highs in the $50 area and stayed well above its 50-day moving average (DMA) line ($48.22) during its recent consolidation. Subsequent damaging losses leading to violations would raise concerns and trigger technical sell signals.
QLYS made limited headway since last shown in this FSU section on 4/08/15 with annotated graphs under the headline, "Volume Driven Gain From Flat Base Triggered New Technical Buy Signal", hitting a new 52-week high (N criteria) with above average volume behind a considerable gap up and 5th consecutive gain.
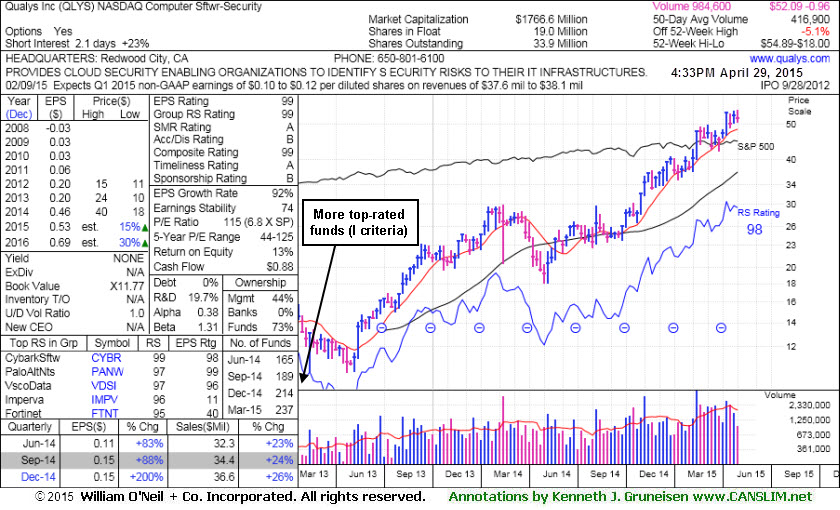
It reported earnings +200% on +26% for the quarter ended December 31, 2014 versus the year ago period, marking its 4th consecutive quarterly comparison with earnings above the +25% minimum guideline (C criteria). The number of top-rated funds owning its shares rose from 152 in Mar '14 to 237 in Mar '15, a reassuring sign concerning the I criteria. Its small supply of only 19 million shares (S criteria) in the public float can contribute to great volatility in the event of institutional buying or selling. The Computer Software - Security group has a 99 Group Relative Strength Rating, and leadership (L criteria) in the industry group is another favorable factor with respect to the fact-based investment system.
|
|
|
Color Codes Explained :
Y - Better candidates highlighted by our
staff of experts.
G - Previously featured
in past reports as yellow but may no longer be buyable under the
guidelines.
***Last / Change / Volume data in this table is the closing quote data***
Symbol/Exchange
Company Name
Industry Group |
PRICE |
CHANGE
(%Change) |
Day High |
Volume
(% DAV)
(% 50 day avg vol) |
52 Wk Hi
% From Hi |
Featured
Date |
Price
Featured |
Pivot Featured |
|
Max Buy |
AKAM
-
NASDAQ
Akamai Technologies Inc
INTERNET - Internet Software and Services
|
$75.13
|
-0.94
-1.24% |
$75.46
|
4,749,333
325.52% of 50 DAV
50 DAV is 1,459,000
|
$77.31
-2.82%
|
4/20/2015
|
$73.53
|
PP = $73.63
|
|
MB = $77.31
|
 Most Recent Note - 4/29/2015 12:06:47 PM
G - Color code is changed to green as concerned were raised after gapping down today, a 2nd consecutive loss with above average volume while retreating from its 52-week high. Reported earnings +5% on +16% sales revenues for the Mar '15 quarter, below the +25% minimum earnings guideline (C criteria), a fundamental flaw making it a less favorable buy candidate. Prior reports cautioned - "It did not produce gains above the pivot point backed by at least the +40% above average volume necessary to trigger a new (or add-on) technical buy signal. Its 50 DMA line defines near-term support to watch."
>>> FEATURED STOCK ARTICLE : Quietly Consolidating Above 50-Day Moving Average Line - 4/13/2015
View all notes |
Set NEW NOTE alert |
CANSLIM.net Company Profile |
SEC
News |
Chart |
Request a new note
C
A N
S L
I M


|
AMBA
-
NASDAQ
Ambarella Inc
ELECTRONICS - Semiconductor - Specialized
|
$75.37
|
+3.36
4.67% |
$76.20
|
1,814,224
107.93% of 50 DAV
50 DAV is 1,681,000
|
$77.39
-2.61%
|
3/2/2015
|
$60.54
|
PP = $63.30
|
|
MB = $66.47
|
Most Recent Note - 4/29/2015 5:26:42 PM
Y - Challenged its 52-week high with today's big gain on higher (near average) volume. It still has not formed a sound new base of sufficient length. Found support when recently consolidating above its 50 DMA line ($68.54) defining important near term support to watch on pullbacks.
>>> FEATURED STOCK ARTICLE : Perched at All-Time High, Extended From Prior Base - 4/20/2015
View all notes |
Set NEW NOTE alert |
CANSLIM.net Company Profile |
SEC
News |
Chart |
Request a new note
C
A N
S L
I M
|
APOG
-
NASDAQ
Apogee Enterprises
MATERIALS and CONSTRUCTION - General Building Materials
|
$53.14
|
-0.22
-0.41% |
$53.50
|
153,785
68.35% of 50 DAV
50 DAV is 225,000
|
$55.01
-3.40%
|
4/9/2015
|
$49.58
|
PP = $48.13
|
|
MB = $50.54
|
Most Recent Note - 4/27/2015 6:29:06 PM
G - Ended with a loss on above average volume after erasing an early gain today. It is extended from its prior base. Prior highs in the $48 area define initial support to watch on pullbacks.
>>> FEATURED STOCK ARTICLE : Breakaway Gap Backed With 8 Times Average Volume - 4/9/2015
View all notes |
Set NEW NOTE alert |
CANSLIM.net Company Profile |
SEC
News |
Chart |
Request a new note
C
A N
S L
I M
|
EPAM
-
NYSE
Epam Systems Inc
COMPUTER SOFTWARE and SERVICES - Information Technology Service
|
$65.86
|
-1.05
-1.57% |
$66.79
|
236,928
55.88% of 50 DAV
50 DAV is 424,000
|
$70.49
-6.57%
|
3/27/2015
|
$61.97
|
PP = $63.60
|
|
MB = $66.78
|
Most Recent Note - 4/28/2015 6:04:05 PM
G - Color code is changed to green after rebounding back above its "max buy" level with today's gain on below average volume. Prior highs in the $63.50 area define near-term support above its 50 DMA line ($62.53). See the latest FSU analysis for more details and new annotated graphs.
>>> FEATURED STOCK ARTICLE : Consolidating Following Latest Volume-Driven Breakout - 4/28/2015
View all notes |
Set NEW NOTE alert |
CANSLIM.net Company Profile |
SEC
News |
Chart |
Request a new note
C
A N
S L
I M
|
FB
-
NASDAQ
Facebook Inc Cl A
INTERNET
|
$80.47
|
-0.22
-0.27% |
$81.39
|
26,399,393
99.77% of 50 DAV
50 DAV is 26,459,700
|
$86.07
-6.51%
|
2/20/2015
|
$81.79
|
PP = $78.47
|
|
MB = $82.39
|
Most Recent Note - 4/27/2015 6:12:54 PM
G - Recently reported earnings +20% on +42% sales revenues for the Mar '15 quarter, below the +25% minimum earnings guideline (C criteria) of the fact-based investment system, raising concerns. Consolidating above its 50 DMA line ($81.00) where a subsequent violation would trigger a technical sell signal.
>>> FEATURED STOCK ARTICLE : Rebounded Above "Max Buy" Level After Pullback Near 50 Day Average - 4/21/2015
View all notes |
Set NEW NOTE alert |
CANSLIM.net Company Profile |
SEC
News |
Chart |
Request a new note
C
A N
S L
I M
|
Symbol/Exchange
Company Name
Industry Group |
PRICE |
CHANGE
(%Change) |
Day High |
Volume
(% DAV)
(% 50 day avg vol) |
52 Wk Hi
% From Hi |
Featured
Date |
Price
Featured |
Pivot Featured |
|
Max Buy |
GSBC
-
NASDAQ
Great Southern Bancorp
BANKING - Savings and Loans
|
$40.65
|
-0.58
-1.41% |
$41.22
|
28,788
87.24% of 50 DAV
50 DAV is 33,000
|
$41.41
-1.84%
|
4/27/2015
|
$40.94
|
PP = $40.54
|
|
MB = $42.57
|
Most Recent Note - 4/29/2015 5:42:13 PM
Y - Pulled back near its pivot point with a loss today on lighter volume. Triggered a technical buy signal on the prior session with a gain above its pivot point backed by +47% above average volume. Annual earnings (A criteria) have not been strong and steady. See the latest FSU analysis for more details and new annotated graphs.
>>> FEATURED STOCK ARTICLE : Distributional Action Today and Annual Earnings History a Concerrn - 4/27/2015
View all notes |
Set NEW NOTE alert |
CANSLIM.net Company Profile |
SEC
News |
Chart |
Request a new note
C
A N
S L
I M
|
JLL
-
NYSE
Jones Lang Lasalle Inc
REAL ESTATE - Property Management/Developmen
|
$168.43
|
-3.09
-1.80% |
$171.35
|
384,902
144.70% of 50 DAV
50 DAV is 266,000
|
$174.83
-3.66%
|
2/3/2015
|
$156.95
|
PP = $154.66
|
|
MB = $162.39
|
Most Recent Note - 4/29/2015 5:34:28 PM
G - Pulled back with above average volume today after hitting a new all-time high on the prior session with a gap up and volume-driven gain. Earnings rose +147% on +16% sales revenues for the Mar '15 quarter. It did not form a sound base of sufficient length recently.
>>> FEATURED STOCK ARTICLE : Found Support Again at 50-Day Moving Average Line - 4/24/2015
View all notes |
Set NEW NOTE alert |
CANSLIM.net Company Profile |
SEC
News |
Chart |
Request a new note
C
A N
S L
I M
|
LNKD
-
NYSE
Linkedin Corp Class A
INTERNET - Internet Information Providers
|
$257.15
|
-0.19
-0.07% |
$259.14
|
1,095,140
92.89% of 50 DAV
50 DAV is 1,179,000
|
$276.18
-6.89%
|
4/10/2015
|
$263.45
|
PP = $276.28
|
|
MB = $290.09
|
Most Recent Note - 4/29/2015 5:36:18 PM
G - Still quietly consolidating just below its 50 DMA line ($260.45) which has been acting as resistance, as previously noted. A convincing rebound above that important short-term average would help its outlook to improve.
>>> FEATURED STOCK ARTICLE : Rebound Above 50-Day Moving Average Helped Technical Stance - 4/10/2015
View all notes |
Set NEW NOTE alert |
CANSLIM.net Company Profile |
SEC
News |
Chart |
Request a new note
C
A N
S L
I M
|
NXPI
-
NASDAQ
Nxp Semiconductors N V
ELECTRONICS - Semiconductor - Broad Line
|
$95.42
|
-0.80
-0.83% |
$96.40
|
2,761,548
78.59% of 50 DAV
50 DAV is 3,514,000
|
$108.50
-12.06%
|
4/15/2015
|
$100.75
|
PP = $108.60
|
|
MB = $114.03
|
Most Recent Note - 4/29/2015 5:38:16 PM
G - Still sputtering below its 50 DMA line ($98.05). Its prior low ($93.05 on 3/26/15) defines the next important chart support level where a damaging violation may raise more serious concerns. A rebound above the 50 DMA line is needed for its outlook to improve
>>> FEATURED STOCK ARTICLE : Forming New Base Above 50-Day Moving Average Line - 4/16/2015
View all notes |
Set NEW NOTE alert |
CANSLIM.net Company Profile |
SEC
News |
Chart |
Request a new note
C
A N
S L
I M
|
PANW
-
NYSE
Palo Alto Networks
Computer Sftwr-Security
|
$152.02
|
-1.26
-0.82% |
$153.88
|
830,568
57.01% of 50 DAV
50 DAV is 1,457,000
|
$158.24
-3.93%
|
3/27/2015
|
$146.44
|
PP = $149.45
|
|
MB = $156.92
|
Most Recent Note - 4/27/2015 6:37:13 PM
Y - Touched a new high today then reversed into the red. Held its ground since triggering a new technical buy signal with a volume-driven gain on 4/21/15. Prior highs near $150 define initial support above its 50 DMA line.
>>> FEATURED STOCK ARTICLE : Consolidating Above 50-Day Moving Average Line - 4/17/2015
View all notes |
Set NEW NOTE alert |
CANSLIM.net Company Profile |
SEC
News |
Chart |
Request a new note
C
A N
S L
I M
|
Symbol/Exchange
Company Name
Industry Group |
PRICE |
CHANGE
(%Change) |
Day High |
Volume
(% DAV)
(% 50 day avg vol) |
52 Wk Hi
% From Hi |
Featured
Date |
Price
Featured |
Pivot Featured |
|
Max Buy |
QLYS
-
NASDAQ
Qualys Inc
Computer Sftwr-Security
|
$52.09
|
-0.61
-1.16% |
$53.32
|
311,051
74.77% of 50 DAV
50 DAV is 416,000
|
$54.89
-5.10%
|
4/8/2015
|
$52.04
|
PP = $50.10
|
|
MB = $52.61
|
Most Recent Note - 4/29/2015 5:23:58 PM
Y - Color code is changed to yellow after quietly consolidating below its "max buy" level. During recent consolidation it found support near prior highs in the $50 area and well above its 50 DMA line. See the latest FSU analysis for more details and new annotated graphs.
>>> FEATURED STOCK ARTICLE : Quiet Consolidation Within 5% of Prior Pivot Point - 4/29/2015
View all notes |
Set NEW NOTE alert |
CANSLIM.net Company Profile |
SEC
News |
Chart |
Request a new note
C
A N
S L
I M
|
REIS
-
NASDAQ
Reis Inc
Real Estate Dvlpmt/Ops
|
$25.79
|
-0.02
-0.08% |
$25.99
|
20,431
70.45% of 50 DAV
50 DAV is 29,000
|
$28.82
-10.51%
|
3/16/2015
|
$25.65
|
PP = $26.64
|
|
MB = $27.97
|
Most Recent Note - 4/28/2015 6:06:40 PM
Y - Promptly rebounded above its 50 DMA line and its color code is changed to yellow. After featured on 3/16/15 is did not produce a gain above the pivot point backed by at least +40% above average volume to trigger a convincing technical buy signal. Due to report earnings on the morning of Thursday, April 30, 2015. Volume and volatility often increase near earnings news.
>>> FEATURED STOCK ARTICLE : Finding Support at 50-Day Moving Average - 4/23/2015
View all notes |
Set NEW NOTE alert |
CANSLIM.net Company Profile |
SEC
News |
Chart |
Request a new note
C
A N
S L
I M
|
VRX
-
NYSE
Valeant Pharmaceuticals
DRUGS - Drug Manufacturers - Other
|
$214.06
|
+8.60
4.19% |
$214.75
|
4,563,931
144.98% of 50 DAV
50 DAV is 3,148,000
|
$211.97
0.99%
|
1/5/2015
|
$144.84
|
PP = $149.90
|
|
MB = $157.40
|
Most Recent Note - 4/29/2015 5:32:03 PM
G - Big gain with above average volume today, finishing strong and hitting a new all-time high. Found prompt support its 50 DMA line recently but it did not form a sound base. Completed a new Public Offering on 3/17/15. Reported earnings +34% on +16% sales revenues for the Mar '15 quarter, an improvement after its sub par Dec '14 earnings below the +25% minimum guideline (C criteria) raised concerns.
>>> FEATURED STOCK ARTICLE : Perched at All-Time High But Concerns Remain After Sub Par Quarter - 4/14/2015
View all notes |
Set NEW NOTE alert |
CANSLIM.net Company Profile |
SEC
News |
Chart |
Request a new note
C
A N
S L
I M
|
|
|
|
THESE ARE NOT BUY RECOMMENDATIONS!
Comments contained in the body of this report are technical
opinions only. The material herein has been obtained
from sources believed to be reliable and accurate, however,
its accuracy and completeness cannot be guaranteed.
This site is not an investment advisor, hence it does
not endorse or recommend any securities or other investments.
Any recommendation contained in this report may not
be suitable for all investors and it is not to be deemed
an offer or solicitation on our part with respect to
the purchase or sale of any securities. All trademarks,
service marks and trade names appearing in this report
are the property of their respective owners, and are
likewise used for identification purposes only.
This report is a service available
only to active Paid Premium Members.
You may opt-out of receiving report notifications
at any time. Questions or comments may be submitted
by writing to Premium Membership Services 665 S.E. 10 Street, Suite 201 Deerfield Beach, FL 33441-5634 or by calling 1-800-965-8307
or 954-785-1121.
|
|
|

