You are not logged in.
This means you
CAN ONLY VIEW reports that were published prior to Thursday, March 20, 2025.
You
MUST UPGRADE YOUR MEMBERSHIP if you want to see any current reports.
AFTER MARKET UPDATE - WEDNESDAY, MARCH 28TH, 2018
Previous After Market Report Next After Market Report >>>
|
|
|
|
DOW |
-9.29 |
23,848.42 |
-0.04% |
|
Volume |
929,051,940 |
-1% |
|
Volume |
2,531,149,000 |
+10% |
|
NASDAQ |
-59.58 |
6,949.23 |
-0.85% |
|
Advancers |
1,536 |
52% |
|
Advancers |
1,305 |
45% |
|
S&P 500 |
-7.62 |
2,605.00 |
-0.29% |
|
Decliners |
1,427 |
48% |
|
Decliners |
1,616 |
55% |
|
Russell 2000 |
-0.55 |
1,513.02 |
-0.04% |
|
52 Wk Highs |
19 |
|
|
52 Wk Highs |
28 |
|
|
S&P 600 |
+1.44 |
929.30 |
+0.16% |
|
52 Wk Lows |
114 |
|
|
52 Wk Lows |
114 |
|
|
 |
Leadership Thins as Major Indices End Choppy Session Lower
Kenneth J. Gruneisen - Passed the CAN SLIM® Master's Exam
Stocks finished lower on Wednesday. The Dow was off 9 points to 23848 while the S&P 500 lost 7 point to 2605. The Nasdaq Composite declined 59 points to 6949. The volume totals reported were mixed, lighter than the prior session total on the NYSE and higher on the Nasdaq exchange. Advancers narrowly led decliners on the NYSE, but decliners led advancers by almost a 4-3 margin on the Nasdaq exchange. There were 9 high-ranked companies from the Leaders List that made new 52-week highs and were listed on the BreakOuts Page, versus the total of 19 on the prior session. New 52-week lows totals solidly outnumbered shrinking new 52-week highs totals on the NYSE and on the Nasdaq exchange. Charts used courtesy of www.stockcharts.com
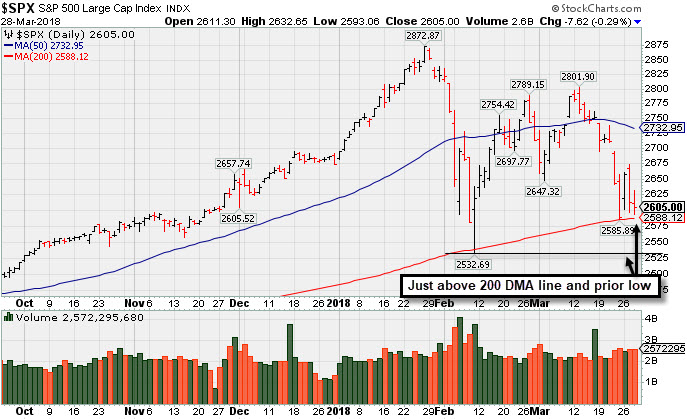 PICTURED: The S&P 500 Index ended the session -9.3% off its record high hit on January 26th. The prior low and 200 DMA line define important near-term support.
The major indices (M criteria) prior uptrend has come under greater pressure in the past week. New buying efforts are only justified when all key criteria of the fact-based investment system are satisfied. The Featured Stocks Page provides the most timely analysis on high-ranked leaders that are noteworthy and action worthy.
The major averages toggled between gains and losses as Tech shares sold off-once again. On the data front, the final reading of U.S. fourth-quarter GDP was revised upward to show economic growth of 2.9%, better than the previous report of 2.5%. Another release showed mortgage applications jumped 4.8% in the prior week. Separately, a report revealed pending home sales rose 3.1% in February, rebounding from the prior month’s 4.7% decline.
Six of 11 sectors in the S&P 500 finished the session in negative territory. Amazon (AMZN -4.38%) gapped down and violated its 50 DMA line to lead the Tech decline following reports President Trump has discussed changing the e-commerce giant’s tax treatment. Apple (AAPL -1.10%) fell after a Wall Street analyst lowered iPhone sales estimates for the first half of 2018. In earnings news, retailer Lululemon Athletica (LULU +9.21%) gapped up and hit a new all-time high after posting fourth-quarter results that topped analyst estimates.
Treasuries finished little-changed, with the yield on the benchmark 10-year ending at 2.78% after touching the lowest level in seven weeks earlier in the day. In commodities, NYMEX WTI crude was off 0.9% to $64.66/barrel after the Energy Information Administration released data showing U.S. crude inventories rose more than expected last week. COMEX Gold slid 1.3% to $1324.40/ounce amid a stronger dollar. |
 Kenneth J. Gruneisen started out as a licensed stockbroker in August 1987, a couple of months prior to the historic stock market crash that took the Dow Jones Industrial Average down -22.6% in a single day. He has published daily fact-based fundamental and technical analysis on high-ranked stocks online for two decades. Through FACTBASEDINVESTING.COM, Kenneth provides educational articles, news, market commentary, and other information regarding proven investment systems that work in good times and bad.
Comments contained in the body of this report are technical opinions only and are not necessarily those of Gruneisen Growth Corp. The material herein has been obtained from sources believed to be reliable and accurate, however, its accuracy and completeness cannot be guaranteed. Our firm, employees, and customers may effect transactions, including transactions contrary to any recommendation herein, or have positions in the securities mentioned herein or options with respect thereto. Any recommendation contained in this report may not be suitable for all investors and it is not to be deemed an offer or solicitation on our part with respect to the purchase or sale of any securities. |
|
 |
Retail, Semiconductor, Networking, and Commodity-Linked Groups Fell
Kenneth J. Gruneisen - Passed the CAN SLIM® Master's Exam
On Wednesday the Broker/Dealer Index ($XBD -0.59%) edged lower and the Bank Index ($BKX +0.07%) finished flat, but a big loss for the Retail Index ($RLX -2.16%) weighed on the major indices. The Semiconductor Index ($SOX -2.12%) and Networking Index ($NWX -1.82%) both fell, however the Biotechnology Index ($BTK +0.48%) eked out a small gain. Commodity linked groups had a negative bias as the Gold & Silver Index ($XAU -1.97%), Oil Services Index ($OSX -2.13%), and Integrated Oil Index ($XOI -1.74%) each ended solidly lower. Charts courtesy wwwstockcharts.com
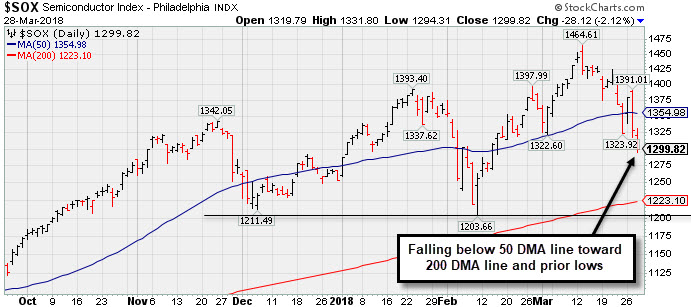 PICTURED: The Semiconductor Index ($SOX -2.12%) has slumped below its 50-day moving average (DMA) line, falling toward prior lows and its 200 DMA line.
| Oil Services |
$OSX |
132.35 |
-2.87 |
-2.12% |
-11.50% |
| Integrated Oil |
$XOI |
1,300.32 |
-22.98 |
-1.74% |
-2.64% |
| Semiconductor |
$SOX |
1,299.82 |
-28.12 |
-2.12% |
+3.73% |
| Networking |
$NWX |
517.33 |
-9.58 |
-1.82% |
+5.46% |
| Broker/Dealer |
$XBD |
277.21 |
-1.65 |
-0.59% |
+4.51% |
| Retail |
$RLX |
1,899.69 |
-41.88 |
-2.16% |
+9.57% |
| Gold & Silver |
$XAU |
79.64 |
-1.61 |
-1.98% |
-6.60% |
| Bank |
$BKX |
105.13 |
+0.08 |
+0.08% |
-1.48% |
| Biotech |
$BTK |
4,497.57 |
+21.53 |
+0.48% |
+6.52% |
|
|
|
 |
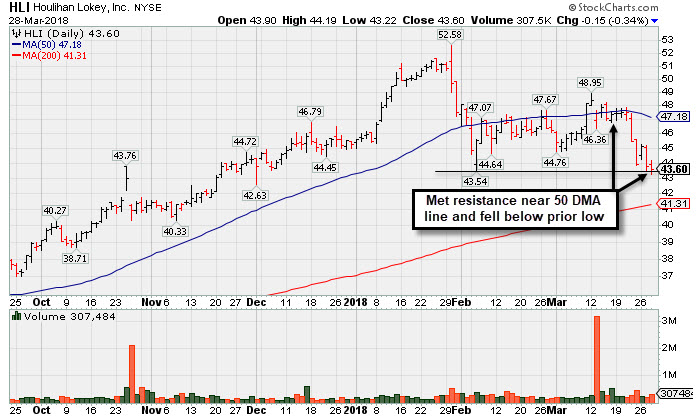
Faltering Fundamentally and Technically
Kenneth J. Gruneisen - Passed the CAN SLIM® Master's Exam
Houlihan Lokey Inc (HLI -$0.15 or -0.34% to $43.60) completed a new Public Offering on 3/12/18 and slumped below its 50-day moving average (DMA) line ($47.31). Additional losses violated the recent low ($43.73 on 2/06/18) raising greater concerns. A rebound above the 50 DMA line is needed for its outlook to improve. It will be dropped from the Featured Stocks list tonight.
Recently it reported earnings +21% on +5% sales revenues for the Dec '17 quarter, below the +25% minimum earnings guideline (C criteria), raising fundamental concerns. The Finance - Invest Bank/Broker firm was last shown in this FSU section on 2/28/18 with an annotated graph under the headline, "Recently Met Resistance at 50-Day Moving Average" . Annual earnings growth (A criteria) history is a good match with the fact-based investment system's guidelines. It has an Earnings Per share rating of 96.
On 10/26/17 it completed an earlier Secondary Offering.Its current Up/Down Volume Ratio of 0.7 is an unbiased indication its shares have been under distributional pressure over the past 50 days.It has a current Timeliness rating of B and a Sponsorship rating of C. The number of top-rated funds owning its shares rose from 227 in Mar '17 to 294 in Dec '17, a reassuring sign concerning the I criteria. Its small supply of only 30.3 million shares (S criteria) in the public float can contribute to greater price volatility in the event of institutional buying or selling.
HLI traded up as much as +39.6% since first highlighted in yellow at $35.85 in the 5/11/17 mid-day report (read here) with pivot point cited based on its 3/31/17 high plus 10 cents after an orderly flat base.
|
|
|
Color Codes Explained :
Y - Better candidates highlighted by our
staff of experts.
G - Previously featured
in past reports as yellow but may no longer be buyable under the
guidelines.
***Last / Change / Volume data in this table is the closing quote data***
Symbol/Exchange
Company Name
Industry Group |
PRICE |
CHANGE
(%Change) |
Day High |
Volume
(% DAV)
(% 50 day avg vol) |
52 Wk Hi
% From Hi |
Featured
Date |
Price
Featured |
Pivot Featured |
|
Max Buy |
SIVB
-
NASDAQ
S V B Financial Group
BANKING - Regional - Pacific Banks
|
$235.81
|
-3.40
-1.42% |
$239.93
|
1,027,003
148.84% of 50 DAV
50 DAV is 690,000
|
$271.79
-13.24%
|
3/12/2018
|
$267.79
|
PP = $263.19
|
|
MB = $276.35
|
 Most Recent Note - 3/28/2018 1:20:40 PM
G - Met resistance and slumped further after violating its 50 DMA line triggering a technical sell signal. Only a prompt rebound above the 50 DMA line ($252) would help its outlook improve.
>>> FEATURED STOCK ARTICLE : Endured Distributional Pressure After Wedging Higher - 3/12/2018 |
View all notes |
Set NEW NOTE alert |
Company Profile |
SEC
News |
Chart |
Request a new note
C
A
S
I |
TPL
-
NYSE
Texas Pacific Land Trust
FINANCIAL SERVICES - Diversified Investments
|
$498.81
|
+3.74
0.76% |
$498.81
|
22,822
152.15% of 50 DAV
50 DAV is 15,000
|
$569.99
-12.49%
|
2/20/2018
|
$517.00
|
PP = $569.99
|
|
MB = $598.49
|
Most Recent Note - 3/28/2018 1:26:29 PM
G - A rebound above the 50 DMA line ($520) is needed for its outlook to improve. Today's loss is testing the prior low ($480 on 2/09/18) and more damaging losses may trigger a worrisome technical sell signal. Reported earnings +29% on +118% sales revenues for the Dec '17 quarter.
>>> FEATURED STOCK ARTICLE : Slump Under 50-Day Average Line Hurt Near Term Outlook - 3/23/2018 |
View all notes |
Set NEW NOTE alert |
Company Profile |
SEC
News |
Chart |
Request a new note
C
A
S
I |
LMAT
-
NASDAQ
Lemaitre Vascular Inc
Medical-Products
|
$36.11
|
+0.55
1.55% |
$36.31
|
108,690
82.34% of 50 DAV
50 DAV is 132,000
|
$39.88
-9.45%
|
3/19/2018
|
$36.77
|
PP = $39.98
|
|
MB = $41.98
|
Most Recent Note - 3/26/2018 6:28:10 PM
Y - Suffered a 4th consecutive small loss on near average volume. Remains perched within striking distance of the new pivot point cited based on its 10/20/17 high plus 10 cents. Subsequent volume-driven gains for new highs are needed to trigger a technical buy signal. Fundamentals remain strong.
>>> FEATURED STOCK ARTICLE : Rebounding Near High After Choppy Consolidation - 3/19/2018 |
View all notes |
Set NEW NOTE alert |
Company Profile |
SEC
News |
Chart |
Request a new note
C
A
S
I |
PETS
-
NASDAQ
Petmed Express Inc
RETAIL - Drug Stores
|
$42.39
|
+0.46
1.10% |
$42.59
|
319,768
45.81% of 50 DAV
50 DAV is 698,000
|
$57.80
-26.66%
|
1/19/2018
|
$53.59
|
PP = $51.00
|
|
MB = $53.55
|
Most Recent Note - 3/23/2018 5:07:29 PM
G - Big loss today led to a close below the 200 DMA line triggering a technical sell signal. A rebound above the 50 DMA line ($46.19) is needed for its outlook to improve. Faces near-term resistance due to overhead supply up to the $57 level. Recently reported earnings +83% on +14% sales revenues, continuing its strong earnings track record.
>>> FEATURED STOCK ARTICLE : Recently Endured Distributional Pressure - 3/15/2018 |
View all notes |
Set NEW NOTE alert |
Company Profile |
SEC
News |
Chart |
Request a new note
C
A
S
I |
DPZ
-
NYSE
Dominos Pizza Inc
WHOLESALE - Food Wholesale
|
$233.87
|
+2.29
0.99% |
$234.42
|
738,531
72.91% of 50 DAV
50 DAV is 1,013,000
|
$236.00
-0.90%
|
2/20/2018
|
$224.86
|
PP = $222.01
|
|
MB = $233.11
|
Most Recent Note - 3/21/2018 5:56:40 PM
Y - Volume totals have been cooling while hovering near its high. Stalled soon after highlighted in the 2/20/18 mid-day report with pivot point cited based on its 1/25/18 high plus 10 cents. See the latest FSU analysis for more details and a new annotated graph.
>>> FEATURED STOCK ARTICLE : Popular Pizza Firm Perched Near All Time High - 3/21/2018 |
View all notes |
Set NEW NOTE alert |
Company Profile |
SEC
News |
Chart |
Request a new note
C
A
S
I |
Symbol/Exchange
Company Name
Industry Group |
PRICE |
CHANGE
(%Change) |
Day High |
Volume
(% DAV)
(% 50 day avg vol) |
52 Wk Hi
% From Hi |
Featured
Date |
Price
Featured |
Pivot Featured |
|
Max Buy |
FIVE
-
NASDAQ
Five Below Inc
Retail-DiscountandVariety
|
$70.77
|
+1.05
1.51% |
$71.71
|
924,212
81.86% of 50 DAV
50 DAV is 1,129,000
|
$73.55
-3.78%
|
3/9/2018
|
$68.58
|
PP = $73.65
|
|
MB = $77.33
|
Most Recent Note - 3/23/2018 12:49:20 PM
Y - Early gain today challenged its all-time high. Posted a solid volume-driven gain on the prior session after reporting earnings +31% on +30% sales revenues for the Jan '18 quarter, continuing its strong earnings track record. New pivot point was cited based on its 1/05/18 high plus 10 cents. Subsequent volume-driven gains above the pivot point may trigger a new (or add-on) technical buy signal. Consolidating above its 50 DMA line ($66.80). The recent low ($60.00 on 2/06/18) defines important near-term support to watch on pullbacks.
>>> FEATURED STOCK ARTICLE : Retailer Rebounding Within Striking Distance of Prior High - 3/9/2018 |
View all notes |
Set NEW NOTE alert |
Company Profile |
SEC
News |
Chart |
Request a new note
C
A
S
I |
SPLK
-
NASDAQ
Splunk Inc
Computer Sftwr-Database
|
$95.94
|
-3.85
-3.86% |
$99.76
|
3,637,419
186.82% of 50 DAV
50 DAV is 1,947,000
|
$112.66
-14.84%
|
2/15/2018
|
$96.06
|
PP = $93.68
|
|
MB = $98.36
|
Most Recent Note - 3/28/2018 1:23:36 PM
Y - Color code is changed to yellow after retreating below its "max buy" level. Today's big loss is testing its 50 DMA ($96.78) line and prior highs defining support to watch on pullbacks.
>>> FEATURED STOCK ARTICLE : Extended After Rallying from Secondary Buy Point - 3/20/2018 |
View all notes |
Set NEW NOTE alert |
Company Profile |
SEC
News |
Chart |
Request a new note
C
A
S
I |
PAYC
-
NYSE
Paycom Software Inc
COMPUTER SOFTWARE and SERVICES - Application Software
|
$105.18
|
-2.44
-2.27% |
$108.00
|
1,099,872
138.87% of 50 DAV
50 DAV is 792,000
|
$115.48
-8.92%
|
2/15/2018
|
$95.01
|
PP = $93.61
|
|
MB = $98.29
|
Most Recent Note - 3/28/2018 1:11:55 PM
G - Very extended from any sound base, and there was a "negative reversal" on the prior session after hitting another new all-time high. Its 50 DMA line ($98.15) defines near-term support above prior highs in the $93 area. Fundamentals remain strong.
>>> FEATURED STOCK ARTICLE : Extended From Prior Base After Streak of Gains - 3/7/2018 |
View all notes |
Set NEW NOTE alert |
Company Profile |
SEC
News |
Chart |
Request a new note
C
A
S
I |
GRUB
-
NYSE
Grubhub Inc
COMPUTER SOFTWARE and SERVICES - Technical and System Software
|
$99.11
|
-4.23
-4.09% |
$103.00
|
2,878,314
148.90% of 50 DAV
50 DAV is 1,933,000
|
$112.41
-11.83%
|
6/21/2017
|
$47.33
|
PP = $46.94
|
|
MB = $49.29
|
Most Recent Note - 3/28/2018 12:57:56 PM
G - Enduring distributional pressure in recent weeks and pulling back after getting very extended from any sound base. Its 50 DMA line ($91.80) defines near-term support. Recently reported earnings +61% on +49% sales revenues for the Dec '17 quarter.
>>> FEATURED STOCK ARTICLE : Bullish Action Followed Last Earnings Report - 3/1/2018 |
View all notes |
Set NEW NOTE alert |
Company Profile |
SEC
News |
Chart |
Request a new note
C
A
S
I |
HQY
-
NASDAQ
Healthequity Inc
COMPUTER SOFTWARE and SERVICES - Healthcare Information Service
|
$60.48
|
-1.24
-2.01% |
$61.69
|
698,078
92.58% of 50 DAV
50 DAV is 754,000
|
$68.75
-12.03%
|
2/20/2018
|
$56.37
|
PP = $55.41
|
|
MB = $58.18
|
Most Recent Note - 3/23/2018 1:00:50 PM
G - Pulling back today following 3 consecutive volume-driven gains hitting new all-time highs and getting very extended from any sound base. Prior highs in the $55 area define initial support along with its 50 DMA line. Reported earnings +57% on +29% sales revenues for the Jan '18 quarter versus the year ago period.
>>> FEATURED STOCK ARTICLE : Bullish Action Followed Latest Earnings Report - 3/22/2018 |
View all notes |
Set NEW NOTE alert |
Company Profile |
SEC
News |
Chart |
Request a new note
C
A
S
I |
Symbol/Exchange
Company Name
Industry Group |
PRICE |
CHANGE
(%Change) |
Day High |
Volume
(% DAV)
(% 50 day avg vol) |
52 Wk Hi
% From Hi |
Featured
Date |
Price
Featured |
Pivot Featured |
|
Max Buy |
LOB
-
NASDAQ
Live Oak Bancshares Inc
Banks-Southeast
|
$27.75
|
-0.05
-0.18% |
$28.00
|
110,703
75.82% of 50 DAV
50 DAV is 146,000
|
$30.05
-7.65%
|
3/16/2018
|
$28.63
|
PP = $28.30
|
|
MB = $29.72
|
Most Recent Note - 3/27/2018 4:10:01 PM
Y - Pulled back below its pivot point with today's loss on light volume. Rallied above the pivot point cited based on its 1/25/18 high plus 10 cents when highlighted in yellow in the 3/16/18 mid-day report (read here). The gain and close above the pivot point was backed by +393% above average volume as it triggered a technical buy signal. Reported very strong sales revenues and earnings increases for the Sep and Dec '17 quarters. Completed a new Public Offering on 8/09/17. Prior quarterly and annual earnings (C and A criteria) history is a good match with the fact-based investment system's guidelines.
>>> FEATURED STOCK ARTICLE : Tallied Volume-Driven Gain for New High - 3/16/2018 |
View all notes |
Set NEW NOTE alert |
Company Profile |
SEC
News |
Chart |
Request a new note
C
A
S
I |
PYPL
-
NASDAQ
Paypal Holdings Inc
Finance-CrdtCard/PmtPr
|
$75.06
|
-1.25
-1.64% |
$76.75
|
14,367,209
141.13% of 50 DAV
50 DAV is 10,180,000
|
$86.32
-13.04%
|
2/1/2018
|
$80.35
|
PP = $79.49
|
|
MB = $83.46
|
Most Recent Note - 3/28/2018 1:14:10 PM
G - Slumping well below its 50 DMA line ($79.57) and a rebound above that important short-term average is needed for its outlook to improve. The prior low ($71.63 on 2/09/18) defines the next important support level where a violation would raise concerns and trigger a more worrisome technical sell signal. Fundamentals remain strong.
>>> FEATURED STOCK ARTICLE : Sputtering Below 50-Day Moving Average Again - 3/27/2018 |
View all notes |
Set NEW NOTE alert |
Company Profile |
SEC
News |
Chart |
Request a new note
C
A
S
I |
OLLI
-
NASDAQ
Ollie's Bargain Outlet
Retail-DiscountandVariety
|
$58.90
|
+0.45
0.77% |
$59.80
|
573,139
117.45% of 50 DAV
50 DAV is 488,000
|
$62.05
-5.08%
|
11/21/2017
|
$46.78
|
PP = $47.00
|
|
MB = $49.35
|
Most Recent Note - 3/26/2018 6:31:32 PM
G - Posted a big gain today with near average volume, rebounding near its all-time high. Near-term support is defined by its 50 DMA line ($57.51) and prior low ($54.44 on 3/09/18).
>>> FEATURED STOCK ARTICLE : Bargain Outlet's Shares Perched Near All-Time Price High - 3/13/2018 |
View all notes |
Set NEW NOTE alert |
Company Profile |
SEC
News |
Chart |
Request a new note
C
A
S
I |
WB
-
NASDAQ
Weibo Corp Cl A Ads
INTERNET - Content
|
$115.09
|
-3.14
-2.66% |
$120.43
|
3,012,597
149.29% of 50 DAV
50 DAV is 2,018,000
|
$142.12
-19.02%
|
1/16/2018
|
$126.33
|
PP = $122.21
|
|
MB = $128.32
|
Most Recent Note - 3/27/2018 3:53:23 PM
G - Met resistance and today's big loss on higher volume has it slumping further below its 50 DMA line ($129.67). Recently reported earnings +88% on +77% sales revenues for the Dec '17 quarter, continuing its strong earnings track record.
>>> FEATURED STOCK ARTICLE : Recent Consolidation is Not a New Base of Sufficient Length - 3/8/2018 |
View all notes |
Set NEW NOTE alert |
Company Profile |
SEC
News |
Chart |
Request a new note
C
A
S
I |
HLI
-
NYSE
Houlihan Lokey Inc Cl A
Finance-Invest Bnk/Bkrs
|
$43.60
|
-0.15
-0.34% |
$44.19
|
307,379
99.80% of 50 DAV
50 DAV is 308,000
|
$52.81
-17.44%
|
1/3/2018
|
$45.88
|
PP = $47.09
|
|
MB = $49.44
|
Most Recent Note - 3/28/2018 6:23:30 PM
It will be dropped from the Featured Stocks list tonight. Completed a new Public Offering on 3/12/18 and slumped below its 50 DMA line. Violated the prior low ($43.73 on 2/06/18) raising greater concerns. Earnings +21% for the Dec '17 quarter were below the +25% minimum earnings guideline (C criteria). See the latest FSU analysis for more details and a new annotated graph.
>>> FEATURED STOCK ARTICLE : Faltering Fundamentally and Technically - 3/28/2018 |
View all notes |
Set NEW NOTE alert |
Company Profile |
SEC
News |
Chart |
Request a new note
C
A
S
I |
Symbol/Exchange
Company Name
Industry Group |
PRICE |
CHANGE
(%Change) |
Day High |
Volume
(% DAV)
(% 50 day avg vol) |
52 Wk Hi
% From Hi |
Featured
Date |
Price
Featured |
Pivot Featured |
|
Max Buy |
SQ
-
NYSE
Square Inc Cl A
Finance-CrdtCard/PmtPr
|
$47.39
|
-3.67
-7.19% |
$50.40
|
27,503,811
179.44% of 50 DAV
50 DAV is 15,328,000
|
$58.46
-18.94%
|
3/5/2018
|
$49.70
|
PP = $49.66
|
|
MB = $52.14
|
Most Recent Note - 3/28/2018 6:26:27 PM
Y - Suffered a big loss on heavy volume falling back into the prior base, testing its 50 DMA line ($47.05) and prior highs in the $47-49 area defining important support. More damaging losses would raise greater concerns. Fundamentals remain strong.
>>> FEATURED STOCK ARTICLE : New High & Considerable Gain Backed By Twice Average Volume - 3/5/2018 |
View all notes |
Set NEW NOTE alert |
Company Profile |
SEC
News |
Chart |
Request a new note
C
A
S
I |
SEND
-
NYSE
Sendgrid Inc
INTERNET - Content
|
$27.35
|
-1.15
-4.04% |
$29.65
|
237,647
106.09% of 50 DAV
50 DAV is 224,000
|
$32.03
-14.60%
|
3/6/2018
|
$28.00
|
PP = $28.37
|
|
MB = $29.79
|
Most Recent Note - 3/27/2018 4:08:15 PM
Y - Erased an early gain today and ended near the session low with a big loss on higher (below average) volume. Retreated below its "max buy" level and its color code is changed to yellow. Prior highs in the $27-28 area define initial support to watch on pullbacks.
>>> FEATURED STOCK ARTICLE : Recently Profitable Internet - Content Firm Rallied to New High - 3/6/2018 |
View all notes |
Set NEW NOTE alert |
Company Profile |
SEC
News |
Chart |
Request a new note
C
A
S
I |
|
|
|
THESE ARE NOT BUY RECOMMENDATIONS!
Comments contained in the body of this report are technical
opinions only. The material herein has been obtained
from sources believed to be reliable and accurate, however,
its accuracy and completeness cannot be guaranteed.
This site is not an investment advisor, hence it does
not endorse or recommend any securities or other investments.
Any recommendation contained in this report may not
be suitable for all investors and it is not to be deemed
an offer or solicitation on our part with respect to
the purchase or sale of any securities. All trademarks,
service marks and trade names appearing in this report
are the property of their respective owners, and are
likewise used for identification purposes only.
This report is a service available
only to active Paid Premium Members.
You may opt-out of receiving report notifications
at any time. Questions or comments may be submitted
by writing to Premium Membership Services 665 S.E. 10 Street, Suite 201 Deerfield Beach, FL 33441-5634 or by calling 1-800-965-8307
or 954-785-1121.
|
|
|