***Last / Change / Volume data in this table is the closing quote data***
Symbol/Exchange
Company Name
Industry Group |
PRICE |
CHANGE
(%Change) |
Day High |
Volume
(% DAV)
(% 50 day avg vol) |
52 Wk Hi
% From Hi |
Featured
Date |
Price
Featured |
Pivot Featured |
|
Max Buy |
THO
-
NYSE
Thor Industries Inc
AUTOMOTIVE - Recreational Vehicles
|
$131.20
|
-5.69
-4.16% |
$136.72
|
820,992
118.13% of 50 DAV
50 DAV is 695,000
|
$161.48
-18.75%
|
12/19/2017
|
$153.92
|
PP = $156.96
|
|
MB = $164.81
|
 Most Recent Note - 2/2/2018 5:39:19 PM
Slumped further below its 50 DMA line with a loss today on higher volume. It will be dropped from the Featured Stocks list tonight. Only a prompt rebound above the 50 DMA line ($149.92) would help its outlook improve.
>>> FEATURED STOCK ARTICLE : Damaging Losses Hurt Companies That Make Recreational Vehicles - 1/26/2018 |
View all notes |
Set NEW NOTE alert |
Company Profile |
SEC
News |
Chart |
Request a new note
C
A
S
I |
ROG
-
NYSE
Rogers Corp
CONSUMER NON-DURABLES - Rubber and Plastics
|
$161.42
|
-2.88
-1.75% |
$165.18
|
164,027
105.15% of 50 DAV
50 DAV is 156,000
|
$184.00
-12.27%
|
12/29/2017
|
$162.92
|
PP = $168.17
|
|
MB = $176.58
|
Most Recent Note - 1/30/2018 7:12:24 PM
Y - Recently stalled and it is quietly consolidating above its 50 DMA line ($163.44) which defines important near-term support to watch. See the latest FSU analysis for more details and an annotated graph.
>>> FEATURED STOCK ARTICLE : Stalled After Recent Technical Breakout - 1/30/2018 |
View all notes |
Set NEW NOTE alert |
Company Profile |
SEC
News |
Chart |
Request a new note
C
A
S
I |
TPL
-
NYSE
Texas Pacific Land Trust
FINANCIAL SERVICES - Diversified Investments
|
$520.17
|
-8.95
-1.69% |
$534.99
|
12,846
80.29% of 50 DAV
50 DAV is 16,000
|
$569.99
-8.74%
|
12/21/2017
|
$419.50
|
PP = $435.09
|
|
MB = $456.84
|
Most Recent Note - 2/1/2018 1:25:19 PM
G - Reported earnings +29% on +118% sales revenues for the Dec '17 quarter. Still consolidating near its high after getting very extended from the previously noted base. Its 50 DMA line ($458) defines initial support to watch above prior highs in the $434 area.
>>> FEATURED STOCK ARTICLE : Considerable Gains in First 2-3 Weeks After Recent Breakout - 1/23/2018 |
View all notes |
Set NEW NOTE alert |
Company Profile |
SEC
News |
Chart |
Request a new note
C
A
S
I |
YY
-
NASDAQ
YY Inc
INTERNET - Internet Service Providers
|
$128.32
|
-5.54
-4.14% |
$132.88
|
1,277,083
104.76% of 50 DAV
50 DAV is 1,219,000
|
$142.97
-10.25%
|
12/29/2017
|
$113.06
|
PP = $123.58
|
|
MB = $129.76
|
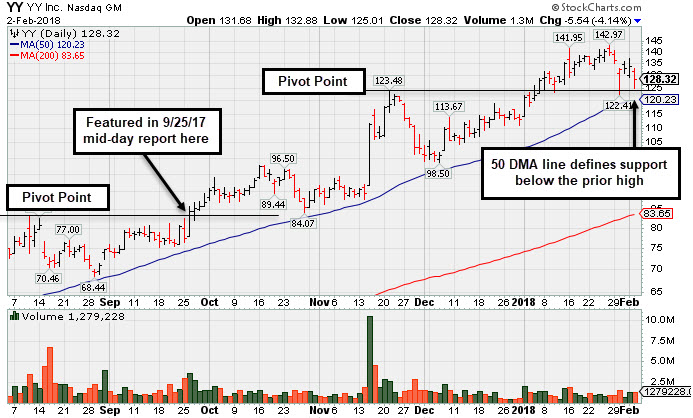
Most Recent Note - 2/2/2018 5:42:00 PM
G - Consolidating above prior highs in the $123 area and its 50 DMA line ($120.23) defining important support. See the latest FSU analysis for more details and a new annotated graph.
>>> FEATURED STOCK ARTICLE : Retreating After +78% Rally in 5 Months - 2/2/2018 |
View all notes |
Set NEW NOTE alert |
Company Profile |
SEC
News |
Chart |
Request a new note
C
A
S
I |
HTHT
-
NASDAQ
China Lodging Group Ads
LEISURE - Lodging
|
$140.99
|
-2.46
-1.71% |
$144.94
|
319,265
44.84% of 50 DAV
50 DAV is 712,000
|
$166.19
-15.16%
|
12/22/2017
|
$138.07
|
PP = $142.90
|
|
MB = $150.05
|
Most Recent Note - 2/1/2018 5:47:29 PM
G - Fell today with higher (near average) volume, slumping near prior highs in the $142 area defining initial support above the 50 DMA line. Abruptly dipped and briefly undercut its 50 DMA line ($135.49) then promptly rebounded from 1/29/18 session lows.
>>> FEATURED STOCK ARTICLE : Found Support Above Prior High After Latest Breakout - 1/24/2018 |
View all notes |
Set NEW NOTE alert |
Company Profile |
SEC
News |
Chart |
Request a new note
C
A
S
I |
Symbol/Exchange
Company Name
Industry Group |
PRICE |
CHANGE
(%Change) |
Day High |
Volume
(% DAV)
(% 50 day avg vol) |
52 Wk Hi
% From Hi |
Featured
Date |
Price
Featured |
Pivot Featured |
|
Max Buy |
PETS
-
NASDAQ
Petmed Express Inc
RETAIL - Drug Stores
|
$43.27
|
-0.85
-1.93% |
$44.34
|
664,588
95.49% of 50 DAV
50 DAV is 696,000
|
$57.80
-25.14%
|
1/19/2018
|
$53.59
|
PP = $51.00
|
|
MB = $53.55
|
Most Recent Note - 1/31/2018 7:07:52 PM
G - Fell to a close just below its 50 DMA line ($45.40) today, slumping further after a "negative reversal" on 1/22/18 following earnings news. Color code is changed to green. Only a prompt rebound above the 50 DMA line would help its outlook improve. Reported earnings +83% on +14% sales revenues, continuing its strong earnings track record.
>>> FEATURED STOCK ARTICLE : Strong Finish Ahead of Earnings News Next Week - 1/19/2018 |
View all notes |
Set NEW NOTE alert |
Company Profile |
SEC
News |
Chart |
Request a new note
C
A
S
I |
PATK
-
NASDAQ
Patrick Industries Inc
Bldg-Mobile/Mfg and RV
|
$61.25
|
-2.60
-4.07% |
$63.45
|
239,473
125.71% of 50 DAV
50 DAV is 190,500
|
$72.35
-15.34%
|
10/26/2017
|
$90.90
|
PP = $87.90
|
|
MB = $92.30
|
Most Recent Note - 2/2/2018 5:44:46 PM
Slumped further below its 50 DMA line with today's 3rd consecutive volume-driven loss. Damage this week raised concerns and triggered technical sell signals. It will be dropped from the Featured Stocks list tonight. Only a rebound above its 50 DMA line would help its outlook improve.
>>> FEATURED STOCK ARTICLE : Pulled Back From Record High With Higher Volume - 1/10/2018 |
View all notes |
Set NEW NOTE alert |
Company Profile |
SEC
News |
Chart |
Request a new note
C
A
S
I |
ESNT
-
NYSE
Essent Group Ltd
Finance-MrtgandRel Svc
|
$46.83
|
-0.96
-2.01% |
$48.10
|
502,486
77.90% of 50 DAV
50 DAV is 645,000
|
$50.08
-6.49%
|
10/9/2017
|
$39.75
|
PP = $41.54
|
|
MB = $43.62
|
Most Recent Note - 1/29/2018 6:20:55 PM
G - Its 50 DMA line ($45.87) and recent lows in the $43.00 area define important support to watch..Its Relative Strength rating has slumped to 79, but it is still only -5.3% off its high.
>>> FEATURED STOCK ARTICLE : Perched Near High After Brief Consolidation Below 50 DMA Line - 1/9/2018 |
View all notes |
Set NEW NOTE alert |
Company Profile |
SEC
News |
Chart |
Request a new note
C
A
S
I |
FIVE
-
NASDAQ
Five Below Inc
Retail-DiscountandVariety
|
$62.94
|
-2.03
-3.12% |
$64.86
|
1,452,711
121.77% of 50 DAV
50 DAV is 1,193,000
|
$73.55
-14.43%
|
1/2/2018
|
$69.16
|
PP = $68.99
|
|
MB = $72.44
|
Most Recent Note - 2/2/2018 5:47:32 PM
G - Slumped further below its 50 DMA line with today's volume driven loss raising concerns and triggering a more worrisome technical sell signal. Only a prompt rebound above the 50 DMA line ($65.81) would help its outlook improve.
>>> FEATURED STOCK ARTICLE : Consolidating After Negating Breakout From Advanced Base - 1/17/2018 |
View all notes |
Set NEW NOTE alert |
Company Profile |
SEC
News |
Chart |
Request a new note
C
A
S
I |
MDXG
-
NASDAQ
MiMedx Group Inc
Medical-Products
|
$16.13
|
-1.00
-5.84% |
$17.12
|
1,703,714
91.79% of 50 DAV
50 DAV is 1,856,000
|
$18.25
-11.62%
|
1/29/2018
|
$17.43
|
PP = $17.57
|
|
MB = $18.45
|
Most Recent Note - 2/2/2018 5:33:18 PM
Y - Down considerably today on below average volume amid widespread market weakness. Disciplined investors always limit losses by selling any stock that falls more than -7% from their purchase price.
>>> FEATURED STOCK ARTICLE : Hit a New High With it 6th Consecutive Gain - 1/29/2018 |
View all notes |
Set NEW NOTE alert |
Company Profile |
SEC
News |
Chart |
Request a new note
C
A
S
I |
Symbol/Exchange
Company Name
Industry Group |
PRICE |
CHANGE
(%Change) |
Day High |
Volume
(% DAV)
(% 50 day avg vol) |
52 Wk Hi
% From Hi |
Featured
Date |
Price
Featured |
Pivot Featured |
|
Max Buy |
ANET
-
NYSE
Arista Networks Inc
TELECOMMUNICATIONS - Communication Equipment
|
$273.48
|
-1.52
-0.55% |
$279.45
|
758,499
95.41% of 50 DAV
50 DAV is 795,000
|
$284.76
-3.96%
|
1/8/2018
|
$248.88
|
PP = $245.75
|
|
MB = $258.04
|
Most Recent Note - 1/30/2018 12:46:31 PM
G - Rebounded promptly after a sharp pullback at the open briefly undercut its "max buy" level. Prior highs in the $245 area define initial support to watch above its 50 DMA line ($242.70).
>>> FEATURED STOCK ARTICLE : Consolidating After Getting Extended From its Prior High - 1/31/2018 |
View all notes |
Set NEW NOTE alert |
Company Profile |
SEC
News |
Chart |
Request a new note
C
A
S
I |
PAYC
-
NYSE
Paycom Software Inc
COMPUTER SOFTWARE and SERVICES - Application Software
|
$88.55
|
-1.62
-1.80% |
$89.99
|
938,895
163.00% of 50 DAV
50 DAV is 576,000
|
$93.61
-5.40%
|
1/12/2018
|
$87.93
|
PP = $86.20
|
|
MB = $90.51
|
Most Recent Note - 1/31/2018 6:54:32 PM
G - Stubbornly holding its ground perched near its all-time high, extended from any sound base. Prior highs near $86 and its 50 DMA line ($83.90) define initial support to watch on pullbacks.
>>> FEATURED STOCK ARTICLE : Finished Strong With Big Gain on +118% Above Average Volume - 1/12/2018 |
View all notes |
Set NEW NOTE alert |
Company Profile |
SEC
News |
Chart |
Request a new note
C
A
S
I |
GRUB
-
NYSE
Grubhub Inc
COMPUTER SOFTWARE and SERVICES - Technical and System Software
|
$70.65
|
-2.21
-3.03% |
$72.53
|
1,218,093
95.31% of 50 DAV
50 DAV is 1,278,000
|
$77.99
-9.41%
|
6/21/2017
|
$47.33
|
PP = $46.94
|
|
MB = $49.29
|
Most Recent Note - 1/29/2018 12:38:46 PM
G - Hit another new all-time high today. Big volume-driven gain on Friday cleared a short flat base during which it found prompt support near its 50 DMA line. The 2 latest quarterly comparisons were below the +25% minimum earnings guideline, so fundamental concerns were raised and noted before.
>>> FEATURED STOCK ARTICLE : Prompt Rebound Above 50-Day Moving Average Helped Outlook - 1/11/2018 |
View all notes |
Set NEW NOTE alert |
Company Profile |
SEC
News |
Chart |
Request a new note
C
A
S
I |
IBP
-
NYSE
Installed Building Prod
DIVERSIFIED SERVICES - Business/Management Services
|
$66.80
|
-4.45
-6.25% |
$71.00
|
271,668
150.93% of 50 DAV
50 DAV is 180,000
|
$79.40
-15.87%
|
12/26/2017
|
$75.00
|
PP = $79.50
|
|
MB = $83.48
|
Most Recent Note - 2/2/2018 5:35:15 PM
Ended near the session low with a big loss on higher volume violating the prior low ($68.30 on 12/13/17) and triggering a more worrisome technical sell signal. A rebound above the 50 DMA line is needed for its outlook to improve. It will be dropped from the Featured Stocks list tonight.
>>> FEATURED STOCK ARTICLE : Quietly Consolidating Near 50-Day Moving Average Line - 1/25/2018 |
View all notes |
Set NEW NOTE alert |
Company Profile |
SEC
News |
Chart |
Request a new note
C
A
S
I |
PYPL
-
NASDAQ
Paypal Holdings Inc
Finance-CrdtCard/PmtPr
|
$76.57
|
-1.83
-2.33% |
$79.62
|
21,809,512
226.59% of 50 DAV
50 DAV is 9,625,000
|
$86.32
-11.30%
|
2/1/2018
|
$80.35
|
PP = $79.49
|
|
MB = $83.46
|
Most Recent Note - 2/2/2018 12:55:08 PM
Y - Gapped down on the prior session testing support at prior highs and its 10 week moving average line. See the latest FSU analysis for more details and an annotated graph.
>>> FEATURED STOCK ARTICLE : Gap Down Following Earnings News Tests Important Support Level - 2/1/2018 |
View all notes |
Set NEW NOTE alert |
Company Profile |
SEC
News |
Chart |
Request a new note
C
A
S
I |
Symbol/Exchange
Company Name
Industry Group |
PRICE |
CHANGE
(%Change) |
Day High |
Volume
(% DAV)
(% 50 day avg vol) |
52 Wk Hi
% From Hi |
Featured
Date |
Price
Featured |
Pivot Featured |
|
Max Buy |
OLLI
-
NASDAQ
Ollie's Bargain Outlet
Retail-DiscountandVariety
|
$53.75
|
-1.50
-2.71% |
$55.25
|
460,097
74.09% of 50 DAV
50 DAV is 621,000
|
$58.50
-8.12%
|
11/21/2017
|
$46.78
|
PP = $47.00
|
|
MB = $49.35
|
Most Recent Note - 1/30/2018 7:07:37 PM
G - Pulled back from its all-time high after getting very extended from any sound base. Its 50 DMA line ($51.61) and recent low ($50.15 on 1/04/18) define important near-term support above prior highs in the $46 area. Fundamentals remain very strong.
>>> FEATURED STOCK ARTICLE : Bargain Outlet Looked Expensive Before +114% Rally in 18 Months - 1/18/2018 |
View all notes |
Set NEW NOTE alert |
Company Profile |
SEC
News |
Chart |
Request a new note
C
A
S
I |
WB
-
NASDAQ
Weibo Corp Cl A Ads
INTERNET - Content
|
$121.44
|
-8.66
-6.66% |
$128.59
|
2,789,628
168.97% of 50 DAV
50 DAV is 1,651,000
|
$136.19
-10.83%
|
1/16/2018
|
$126.33
|
PP = $122.21
|
|
MB = $128.32
|
Most Recent Note - 2/2/2018 1:04:18 PM
G - Pulling back from its all-time high with a gap down today after wedging higher with recent gains lacking great volume conviction. Testing prior highs in the $123 area which define initial support above its 50 DMA line ($115.22).
>>> FEATURED STOCK ARTICLE : Close in Session's Lower Third a Sign of Distributional Pressure - 1/16/2018 |
View all notes |
Set NEW NOTE alert |
Company Profile |
SEC
News |
Chart |
Request a new note
C
A
S
I |
HLI
-
NYSE
Houlihan Lokey Inc Cl A
Finance-Invest Bnk/Bkrs
|
$47.34
|
-0.95
-1.97% |
$48.04
|
196,565
99.78% of 50 DAV
50 DAV is 197,000
|
$52.81
-10.36%
|
1/3/2018
|
$45.88
|
PP = $47.09
|
|
MB = $49.44
|
Most Recent Note - 1/31/2018 7:04:40 PM
G - Reported earnings +21% on +5% sales revenues for the Dec '17 quarter, below the +25% minimum earnings guideline (C criteria), raising fundamental concerns. Pulled back for a 2nd consecutive loss following a "negative reversal" after hitting a new all-time high. Extended from any sound base, its 50 DMA line ($46.63) defines near-term support to watch on pullbacks. On 10/26/17 it completed a Secondary Offering.
>>> FEATURED STOCK ARTICLE : Tight Weekly Closes Formed Advanced Base Pattern - 1/3/2018 |
View all notes |
Set NEW NOTE alert |
Company Profile |
SEC
News |
Chart |
Request a new note
C
A
S
I |
ICHR
-
NASDAQ
Ichor Holdings Ltd
ELECTRONICS - Semiconductor Equipment
|
$28.50
|
-2.05
-6.71% |
$30.26
|
1,890,385
147.57% of 50 DAV
50 DAV is 1,281,000
|
$35.51
-19.74%
|
1/22/2018
|
$34.00
|
PP = $35.61
|
|
MB = $37.39
|
Most Recent Note - 2/2/2018 5:37:31 PM
Y - Pulled back today for a 5th consecutive loss on higher volume testing its 50 DMA line ($27.61). Members were repeatedly reminded since featured on 1/22/18 - "Subsequent gains above the pivot point backed by at least +40% above average volume are still needed to trigger a technical buy signal."
>>> FEATURED STOCK ARTICLE : Found Support at 200 Day Average and Rebounded Near Prior High - 1/22/2018 |
View all notes |
Set NEW NOTE alert |
Company Profile |
SEC
News |
Chart |
Request a new note
C
A
S
I |