Symbol/Exchange
Company Name
Industry Group |
PRICE |
CHANGE
(%Change) |
Day High |
Volume
(% DAV)
(% 50 day avg vol) |
52 Wk Hi
% From Hi |
Featured
Date |
Price
Featured |
Pivot Featured |
|
Max Buy |
THO
-
NYSE
Thor Industries Inc
AUTOMOTIVE - Recreational Vehicles
|
$157.02
|
+0.45
0.29% |
$161.48
|
816,845
141.57% of 50 DAV
50 DAV is 577,000
|
$159.17
-1.35%
|
12/19/2017
|
$153.92
|
PP = $156.96
|
|
MB = $164.81
|
Most Recent Note - 1/22/2018 5:26:33 PM
Y - Held its ground in a very tight range for the past 8 weeks. It has not yet produced gains above the pivot point backed by at least the +40% above average volume needed to trigger a new (or add-on) technical buy signal. Its 50 DMA line ($147.78) defines near-term support to watch above prior highs in the $138 area. Fundamentals remain very strong.
>>> FEATURED STOCK ARTICLE : Holding Ground in Tight Range Near High - 12/27/2017 |
View all notes |
Set NEW NOTE alert |
Company Profile |
SEC
News |
Chart |
Request a new note
C
A
S
I |
ROG
-
NYSE
Rogers Corp
CONSUMER NON-DURABLES - Rubber and Plastics
|
$169.52
|
-0.68
-0.40% |
$172.56
|
99,080
60.79% of 50 DAV
50 DAV is 163,000
|
$184.00
-7.87%
|
12/29/2017
|
$162.92
|
PP = $168.17
|
|
MB = $176.58
|
Most Recent Note - 1/22/2018 5:25:10 PM
Y - Suffered another damaging volume-driven loss today raising concerns. Testing prior highs in the $168 area which define initial support to watch above its 50 DMA line ($161.44).
>>> FEATURED STOCK ARTICLE : Hovering Near Prior High After 3rd Strong Quarterly Earnings - 12/29/2017 |
View all notes |
Set NEW NOTE alert |
Company Profile |
SEC
News |
Chart |
Request a new note
C
A
S
I |
AVGO
-
NASDAQ
Avago Technologies Ltd
ELECTRONICS - Semiconductor - Broad Line
|
$256.86
|
-6.04
-2.30% |
$263.27
|
4,498,876
151.54% of 50 DAV
50 DAV is 2,968,800
|
$285.68
-10.09%
|
1/5/2018
|
$271.62
|
PP = $285.78
|
|
MB = $300.07
|
Most Recent Note - 1/22/2018 5:28:57 PM
G - Sputtering below its 50 DMA line ($266.82) again. Its Relative Strength rating has slumped to 67, well below the 80+ minimum guideline for buy candidates. The recent low ($254.20 on 12/06/17) defines important support where a damaging violation would raise greater concerns. Fundamentals remain strong.
>>> FEATURED STOCK ARTICLE : New Pivot Point Cited After Rebound Above 50-Day Moving Average - 1/5/2018 |
View all notes |
Set NEW NOTE alert |
Company Profile |
SEC
News |
Chart |
Request a new note
C
A
S
I |
TPL
-
NYSE
Texas Pacific Land Trust
FINANCIAL SERVICES - Diversified Investments
|
$527.75
|
-13.28
-2.45% |
$541.00
|
26,307
175.38% of 50 DAV
50 DAV is 15,000
|
$569.99
-7.41%
|
12/21/2017
|
$419.50
|
PP = $435.09
|
|
MB = $456.84
|
 Most Recent Note - 1/24/2018 1:03:57 PM
G - Consolidating after getting very extended from the previously noted base. Prior highs in the $434 area define initial support to watch on pullbacks. See the latest FSU analysis for more details and an annotated graph.
>>> FEATURED STOCK ARTICLE : Considerable Gains in First 2-3 Weeks After Recent Breakout - 1/23/2018 |
View all notes |
Set NEW NOTE alert |
Company Profile |
SEC
News |
Chart |
Request a new note
C
A
S
I |
YY
-
NASDAQ
YY Inc
INTERNET - Internet Service Providers
|
$138.92
|
+2.16
1.58% |
$141.60
|
1,031,362
68.90% of 50 DAV
50 DAV is 1,497,000
|
$141.95
-2.13%
|
12/29/2017
|
$113.06
|
PP = $123.58
|
|
MB = $129.76
|
Most Recent Note - 1/24/2018 5:21:43 PM
G - Posted a quiet gain today for a best-ever close. Very extended from any sound base, prior highs in the $123 area and its 50 DMA line ($115.57) define support to watch on pullbacks. This China-based Internet - Content firm's fundamentals remain strong.
>>> FEATURED STOCK ARTICLE : Touched a New High But Ended Below New Pivot Point Cited - 1/4/2018 |
View all notes |
Set NEW NOTE alert |
Company Profile |
SEC
News |
Chart |
Request a new note
C
A
S
I |
Symbol/Exchange
Company Name
Industry Group |
PRICE |
CHANGE
(%Change) |
Day High |
Volume
(% DAV)
(% 50 day avg vol) |
52 Wk Hi
% From Hi |
Featured
Date |
Price
Featured |
Pivot Featured |
|
Max Buy |
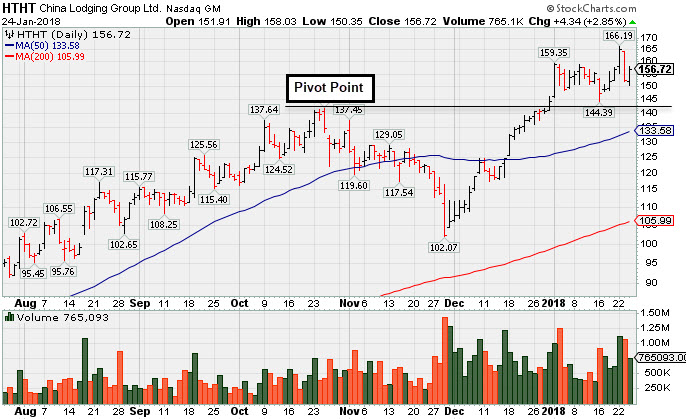
HTHT
-
NASDAQ
China Lodging Group Ads
LEISURE - Lodging
|
$156.72
|
+4.34
2.85% |
$158.03
|
765,093
111.69% of 50 DAV
50 DAV is 685,000
|
$166.19
-5.70%
|
12/22/2017
|
$138.07
|
PP = $142.90
|
|
MB = $150.05
|
Most Recent Note - 1/24/2018 5:10:16 PM
G - Found support above the prior high ($142.80 on 10/25/17) during the recent consolidation following a powerful breakout. See the latest FSU analysis for more details and a new annotated graph.
>>> FEATURED STOCK ARTICLE : Found Support Above Prior High After Latest Breakout - 1/24/2018 |
View all notes |
Set NEW NOTE alert |
Company Profile |
SEC
News |
Chart |
Request a new note
C
A
S
I |
PETS
-
NASDAQ
Petmed Express Inc
RETAIL - Drug Stores
|
$46.48
|
-4.18
-8.25% |
$50.98
|
1,754,702
270.37% of 50 DAV
50 DAV is 649,000
|
$57.80
-19.58%
|
1/19/2018
|
$53.59
|
PP = $51.00
|
|
MB = $53.55
|
Most Recent Note - 1/24/2018 5:29:43 PM
Y - Suffered a 2nd big loss on above average volume in the span of 3 sessions. Spiked to a new all-time high but there was a a big "negative reversal" on 1/22/18 following earnings news. Reported earnings +83% on +14% sales revenues, continuing its strong earnings track record. On 1/19/18 it was highlighted in yellow in the mid-day report (read here).
>>> FEATURED STOCK ARTICLE : Strong Finish Ahead of Earnings News Next Week - 1/19/2018 |
View all notes |
Set NEW NOTE alert |
Company Profile |
SEC
News |
Chart |
Request a new note
C
A
S
I |
PATK
-
NASDAQ
Patrick Industries Inc
Bldg-Mobile/Mfg and RV
|
$71.35
|
+0.05
0.07% |
$72.30
|
148,845
91.32% of 50 DAV
50 DAV is 163,000
|
$72.35
-1.38%
|
10/26/2017
|
$90.90
|
PP = $87.90
|
|
MB = $92.30
|
Most Recent Note - 1/23/2018 1:02:01 PM
G - Hitting a new high with today's gain, extended from any sound base. Found prompt support last week while testing prior highs in the $64 area and its 50 DMA line. More damaging losses would raise greater concerns. Fundamentals remain strong. Shares split 3/2 effective 12/11/17.
>>> FEATURED STOCK ARTICLE : Pulled Back From Record High With Higher Volume - 1/10/2018 |
View all notes |
Set NEW NOTE alert |
Company Profile |
SEC
News |
Chart |
Request a new note
C
A
S
I |
ESNT
-
NYSE
Essent Group Ltd
Finance-MrtgandRel Svc
|
$48.53
|
-1.29
-2.59% |
$50.08
|
380,476
51.00% of 50 DAV
50 DAV is 746,000
|
$49.82
-2.59%
|
10/9/2017
|
$39.75
|
PP = $41.54
|
|
MB = $43.62
|
Most Recent Note - 1/22/2018 5:30:07 PM
G - Extended from any sound base, it hit another new all-time high with today's 11th gain in the span of 12 sessions. Its 50 DMA line and recent lows in the $43.00 area define important support where more damaging losses would raise greater concerns.
>>> FEATURED STOCK ARTICLE : Perched Near High After Brief Consolidation Below 50 DMA Line - 1/9/2018 |
View all notes |
Set NEW NOTE alert |
Company Profile |
SEC
News |
Chart |
Request a new note
C
A
S
I |
FIVE
-
NASDAQ
Five Below Inc
Retail-DiscountandVariety
|
$66.74
|
-0.41
-0.61% |
$67.86
|
848,955
74.02% of 50 DAV
50 DAV is 1,147,000
|
$73.55
-9.26%
|
1/2/2018
|
$69.16
|
PP = $68.99
|
|
MB = $72.44
|
Most Recent Note - 1/22/2018 5:30:58 PM
Y - Recent low ($64.73 on 1/10/18) defines important near term support above its 50 DMA line ($64.48) while consolidating. Weak action on 1/08/18 negated a recent breakout from an advanced "3 weeks tight" base. Fundamentals remain very strong.
>>> FEATURED STOCK ARTICLE : Consolidating After Negating Breakout From Advanced Base - 1/17/2018 |
View all notes |
Set NEW NOTE alert |
Company Profile |
SEC
News |
Chart |
Request a new note
C
A
S
I |
Symbol/Exchange
Company Name
Industry Group |
PRICE |
CHANGE
(%Change) |
Day High |
Volume
(% DAV)
(% 50 day avg vol) |
52 Wk Hi
% From Hi |
Featured
Date |
Price
Featured |
Pivot Featured |
|
Max Buy |
OLED
-
NASDAQ
Universal Display Corp
Elec-Misc Products
|
$178.50
|
-10.85
-5.73% |
$191.99
|
3,500,880
376.44% of 50 DAV
50 DAV is 930,000
|
$209.00
-14.59%
|
1/8/2018
|
$191.68
|
PP = $192.85
|
|
MB = $202.49
|
Most Recent Note - 1/24/2018 12:49:29 PM
G - Color code is changed to green while encountering damaging distributional pressure with today's 3rd consecutive loss on above average and ever-increasing volume. Violated prior highs in the $192 area and also undercut its 50 DMA line ($181.16) raising concerns and triggering a technical sell signal. Only a prompt rebound above the 50 DMA line would help its outlook.
>>> FEATURED STOCK ARTICLE : Technical Breakout With Volume-Driven Gain For New High - 1/8/2018 |
View all notes |
Set NEW NOTE alert |
Company Profile |
SEC
News |
Chart |
Request a new note
C
A
S
I |
ANET
-
NYSE
Arista Networks Inc
TELECOMMUNICATIONS - Communication Equipment
|
$273.14
|
+0.00
0.00% |
$276.87
|
706,569
88.43% of 50 DAV
50 DAV is 799,000
|
$276.21
-1.11%
|
1/8/2018
|
$248.88
|
PP = $245.75
|
|
MB = $258.04
|
Most Recent Note - 1/24/2018 5:16:14 PM
G - Stubbornly holding its ground after getting extended well above its "max buy" level. Prior highs in the $245 area define initial support to watch above its 50 DMA line ($238).
>>> FEATURED STOCK ARTICLE : Encountering Distributional Pressure After Wedging Near Prior High - 1/2/2018 |
View all notes |
Set NEW NOTE alert |
Company Profile |
SEC
News |
Chart |
Request a new note
C
A
S
I |
PAYC
-
NYSE
Paycom Software Inc
COMPUTER SOFTWARE and SERVICES - Application Software
|
$90.57
|
-1.41
-1.53% |
$92.77
|
1,442,272
261.76% of 50 DAV
50 DAV is 551,000
|
$93.61
-3.25%
|
1/12/2018
|
$87.93
|
PP = $86.20
|
|
MB = $90.51
|
Most Recent Note - 1/24/2018 5:25:30 PM
G - Encountered distributional pressure with a loss on higher volume today while retreating from its all-time high hit on the prior session. Prior highs near $86 define initial support to watch on pullbacks.
>>> FEATURED STOCK ARTICLE : Finished Strong With Big Gain on +118% Above Average Volume - 1/12/2018 |
View all notes |
Set NEW NOTE alert |
Company Profile |
SEC
News |
Chart |
Request a new note
C
A
S
I |
GRUB
-
NYSE
Grubhub Inc
COMPUTER SOFTWARE and SERVICES - Technical and System Software
|
$71.53
|
+0.37
0.52% |
$72.60
|
788,571
65.77% of 50 DAV
50 DAV is 1,199,000
|
$74.81
-4.38%
|
6/21/2017
|
$47.33
|
PP = $46.94
|
|
MB = $49.29
|
Most Recent Note - 1/22/2018 5:32:05 PM
G - Rebounding after it found prompt support near its 50 DMA line ($68.93) in recent weeks. Subsequent losses undercutting the 50 DMA line and latest low ($66.28) would raise greater concerns.
>>> FEATURED STOCK ARTICLE : Prompt Rebound Above 50-Day Moving Average Helped Outlook - 1/11/2018 |
View all notes |
Set NEW NOTE alert |
Company Profile |
SEC
News |
Chart |
Request a new note
C
A
S
I |
IBP
-
NYSE
Installed Building Prod
DIVERSIFIED SERVICES - Business/Management Services
|
$73.35
|
-0.35
-0.47% |
$74.61
|
107,681
55.51% of 50 DAV
50 DAV is 194,000
|
$79.40
-7.62%
|
12/26/2017
|
$75.00
|
PP = $79.50
|
|
MB = $83.48
|
Most Recent Note - 1/24/2018 5:14:56 PM
Y - Quietly consolidating just above its 50 DMA line ($73.18). Below that important short-term average the recent lows ($72.30 on 1/16/18 and $68.30 on 12/13/17) define the next important support levels where violations may trigger more worrisome technical sell signals. Subsequent volume-driven gains for new highs may trigger a new (or add-on) technical buy signal.
>>> FEATURED STOCK ARTICLE : Building on an Advanced Ascending Base Pattern - 12/26/2017 |
View all notes |
Set NEW NOTE alert |
Company Profile |
SEC
News |
Chart |
Request a new note
C
A
S
I |
Symbol/Exchange
Company Name
Industry Group |
PRICE |
CHANGE
(%Change) |
Day High |
Volume
(% DAV)
(% 50 day avg vol) |
52 Wk Hi
% From Hi |
Featured
Date |
Price
Featured |
Pivot Featured |
|
Max Buy |
OLLI
-
NASDAQ
Ollie's Bargain Outlet
Retail-DiscountandVariety
|
$56.40
|
-0.85
-1.48% |
$57.63
|
512,168
84.66% of 50 DAV
50 DAV is 605,000
|
$58.00
-2.76%
|
11/21/2017
|
$46.78
|
PP = $47.00
|
|
MB = $49.35
|
Most Recent Note - 1/24/2018 5:23:31 PM
G - Perched near its all-time high, extended from any sound base. Its 50 DMA line ($50.58) and recent low ($50.15 on 1/04/18) define important near-term support above prior highs in the $46 area. Fundamentals remain very strong.
>>> FEATURED STOCK ARTICLE : Bargain Outlet Looked Expensive Before +114% Rally in 18 Months - 1/18/2018 |
View all notes |
Set NEW NOTE alert |
Company Profile |
SEC
News |
Chart |
Request a new note
C
A
S
I |
WB
-
NASDAQ
Weibo Corp Cl A Ads
INTERNET - Content
|
$128.58
|
-3.15
-2.39% |
$132.72
|
1,923,431
111.76% of 50 DAV
50 DAV is 1,721,000
|
$132.50
-2.96%
|
1/16/2018
|
$126.33
|
PP = $122.21
|
|
MB = $128.32
|
Most Recent Note - 1/24/2018 5:18:40 PM
G - There was a "negative reversal" for a loss on higher volume after touching a new all-time high today. Prior highs in the $123 area define initial support to watch on pullbacks.
>>> FEATURED STOCK ARTICLE : Close in Session's Lower Third a Sign of Distributional Pressure - 1/16/2018 |
View all notes |
Set NEW NOTE alert |
Company Profile |
SEC
News |
Chart |
Request a new note
C
A
S
I |
HLI
-
NYSE
Houlihan Lokey Inc Cl A
Finance-Invest Bnk/Bkrs
|
$51.55
|
+0.45
0.88% |
$51.63
|
138,145
73.09% of 50 DAV
50 DAV is 189,000
|
$51.45
0.19%
|
1/3/2018
|
$45.88
|
PP = $47.09
|
|
MB = $49.44
|
Most Recent Note - 1/22/2018 5:33:19 PM
G - Posted a 4th consecutive gain today, rallying further above its "max buy" level. Its 50 DMA line ($45.44) defines near-term support to watch on pullbacks. On 10/26/17 it completed a Secondary Offering. Fundamentals remain strong.
>>> FEATURED STOCK ARTICLE : Tight Weekly Closes Formed Advanced Base Pattern - 1/3/2018 |
View all notes |
Set NEW NOTE alert |
Company Profile |
SEC
News |
Chart |
Request a new note
C
A
S
I |
ICHR
-
NASDAQ
Ichor Holdings Ltd
ELECTRONICS - Semiconductor Equipment
|
$33.24
|
-1.11
-3.23% |
$34.35
|
1,924,748
146.04% of 50 DAV
50 DAV is 1,318,000
|
$35.51
-6.39%
|
1/22/2018
|
$34.00
|
PP = $35.61
|
|
MB = $37.39
|
Most Recent Note - 1/24/2018 5:32:46 PM
Y - Suffered a loss today with above average volume yet ended in the upper half of its intra-day range. New pivot point cited was based on its 10/20/17 high plus 10 cents in the 1/22/18 mid-day report (read here). Rebounded above its 50 DMA line on 1/17/18 and little overhead supply remains after additional volume-driven gains. Gains above the pivot point backed by at least +40% above average volume are still needed to trigger a technical buy signal. See the latest FSU analysis for more details and an annotated graph.
>>> FEATURED STOCK ARTICLE : Found Support at 200 Day Average and Rebounded Near Prior High - 1/22/2018 |
View all notes |
Set NEW NOTE alert |
Company Profile |
SEC
News |
Chart |
Request a new note
C
A
S
I |