You are not logged in.
This means you
CAN ONLY VIEW reports that were published prior to Thursday, April 17, 2025.
You
MUST UPGRADE YOUR MEMBERSHIP if you want to see any current reports.
AFTER MARKET UPDATE - WEDNESDAY, FEBRUARY 7TH, 2018
Previous After Market Report Next After Market Report >>>
|
|
|
|
DOW |
-19.42 |
24,893.35 |
-0.08% |
|
Volume |
1,138,442,650 |
-21% |
|
Volume |
2,357,134,930 |
-24% |
|
NASDAQ |
-63.90 |
7,051.98 |
-0.90% |
|
Advancers |
1,568 |
53% |
|
Advancers |
1,552 |
52% |
|
S&P 500 |
-13.48 |
2,681.66 |
-0.50% |
|
Decliners |
1,399 |
47% |
|
Decliners |
1,409 |
48% |
|
Russell 2000 |
+0.80 |
1,507.97 |
+0.05% |
|
52 Wk Highs |
24 |
|
|
52 Wk Highs |
30 |
|
|
S&P 600 |
+0.13 |
918.54 |
+0.01% |
|
52 Wk Lows |
43 |
|
|
52 Wk Lows |
56 |
|
|
 |
Major Indices Rose With Lighter Volume
Kenneth J. Gruneisen - Passed the CAN SLIM® Master's Exam
Stocks finished lower Wednesday. The Dow declined 19 points to 24893 after climbing as much as 381 points earlier. The S&P 500 fell 3 points to 2691 and recorded its largest one-day reversal since February 2016. The Nasdaq Composite lost 63 points to 7051. Volume totals reported were lighter than the prior session totals on the NYSE and on the Nasdaq exchange. Advancers led decliners by an 8-7 margin on the NYSE and on the Nasdaq exchange. New 52-week lows totals again outnumbered new 52-week highs totals on both the NYSE and the Nasdaq exchange. There were 7 high-ranked companies from the Leaders List that made new 52-week highs and were listed on the BreakOuts Page, versus the total of 1 on the prior session. The Featured Stocks Page provides the latest analysis on noteworthy high-ranked leaders. Charts used courtesy of www.stockcharts.com
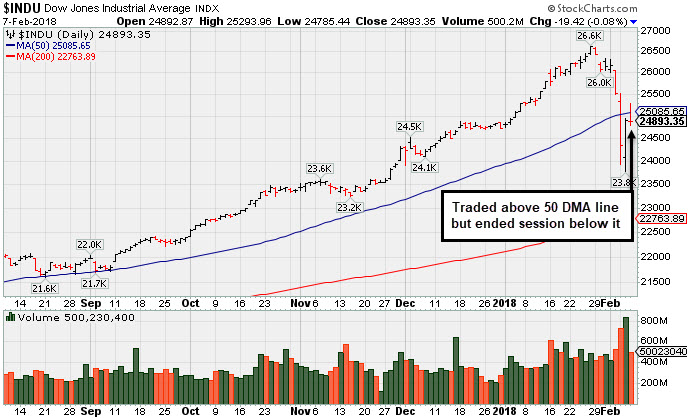 PICTURED: The Dow Jones Industrial Average traded above its 50-day moving average (DMA) line, but ended the session lower. It violated that important short-term average with Monday's big loss on higher volume. Heavier distributional pressure on the major averages (M criteria) took the recently noted "uptrend under pressure" into a worrisome "correction" warranting much greater caution. During market corrections investors should avoid new buying efforts and raise cash by quickly reacting to technical sell signals from stocks on a case-by-case basis.
The major averages fluctuated as investors remained on edge amid another jump in Treasury yields following a soft 10-year auction. The yield on the benchmark 10-year note surged eight basis points to 2.84%, returning to the level that precipitated Friday’s equity selloff. On the data front, a report showed consumer credit growth cooled in December following an upwardly revised gain in the prior month. In central bank news, Chicago Fed President Charles Evans commented that additional rate hikes could be warranted if inflation proves to rise sustainably.
Eight of 11 S&P 500 sectors finished lower, with Energy leading decliners. Exxon Mobil (XOM -1.80%) and Chevron (CVX -1.61%) fell as lower oil prices weighed on the group. Technology shares lagged with Apple (AAPL -2.14%) falling. Industrials outperformed with Boeing (BA +2.11%) up on the session. In other news, Wynn Resorts (WYNN +8.64%) rose after announcing founder and CEO Steve Wynn has resigned.
NYMEX WTI crude settled down 2.4% to $61.86/barrel after a release from the EIA showed U.S. crude inventories increased. COMEX gold lost 0.9% to $1318.00/ounce amid a stronger dollar. |
 Kenneth J. Gruneisen started out as a licensed stockbroker in August 1987, a couple of months prior to the historic stock market crash that took the Dow Jones Industrial Average down -22.6% in a single day. He has published daily fact-based fundamental and technical analysis on high-ranked stocks online for two decades. Through FACTBASEDINVESTING.COM, Kenneth provides educational articles, news, market commentary, and other information regarding proven investment systems that work in good times and bad.
Comments contained in the body of this report are technical opinions only and are not necessarily those of Gruneisen Growth Corp. The material herein has been obtained from sources believed to be reliable and accurate, however, its accuracy and completeness cannot be guaranteed. Our firm, employees, and customers may effect transactions, including transactions contrary to any recommendation herein, or have positions in the securities mentioned herein or options with respect thereto. Any recommendation contained in this report may not be suitable for all investors and it is not to be deemed an offer or solicitation on our part with respect to the purchase or sale of any securities. |
|
 |
Commodity-Linked Groups Led Tech Sector and Retail Index Lower
Kenneth J. Gruneisen - Passed the CAN SLIM® Master's Exam
The Retail Index ($RLX -0.63%) and the Broker/Dealer Index ($XBD -0.74%) both fell while the Bank Index ($BKX +0.34%) edged higher on Wednesday. The Semiconductor Index ($SOX -2.24%) led the tech sector's retreat while the Biotechnology Index ($BTK -0.38%) and Networking Index ($NWX -0.43%) both also edged lower. The Integrated Oil Index ($XOI -1.91%) and the Oil Services Index ($OSX -2.92%) lost ground along with the Gold & Silver Index ($XAU -1.89%). Charts courtesy wwwstockcharts.com
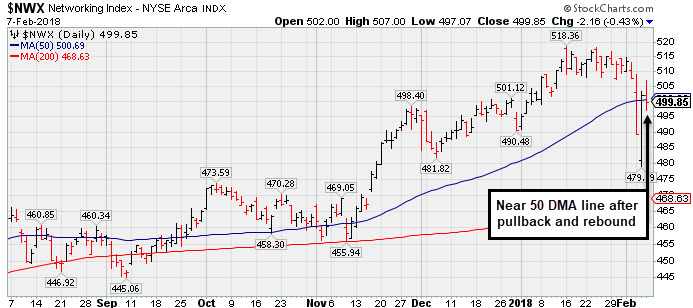 PICTURED: The Networking Index ($NWX -0.43%) is near its 50-day moving average (DMA) line after a pullback and rebound.
| Oil Services |
$OSX |
142.39 |
-4.29 |
-2.92% |
-4.79% |
| Integrated Oil |
$XOI |
1,299.58 |
-25.30 |
-1.91% |
-2.69% |
| Semiconductor |
$SOX |
1,272.50 |
-29.16 |
-2.24% |
+1.55% |
| Networking |
$NWX |
499.85 |
-2.16 |
-0.43% |
+1.90% |
| Broker/Dealer |
$XBD |
270.54 |
-2.00 |
-0.74% |
+2.00% |
| Retail |
$RLX |
1,935.38 |
-12.32 |
-0.63% |
+11.63% |
| Gold & Silver |
$XAU |
80.54 |
-1.56 |
-1.90% |
-5.55% |
| Bank |
$BKX |
110.99 |
+0.38 |
+0.34% |
+4.01% |
| Biotech |
$BTK |
4,581.55 |
-17.47 |
-0.38% |
+8.51% |
|
|
|
 |
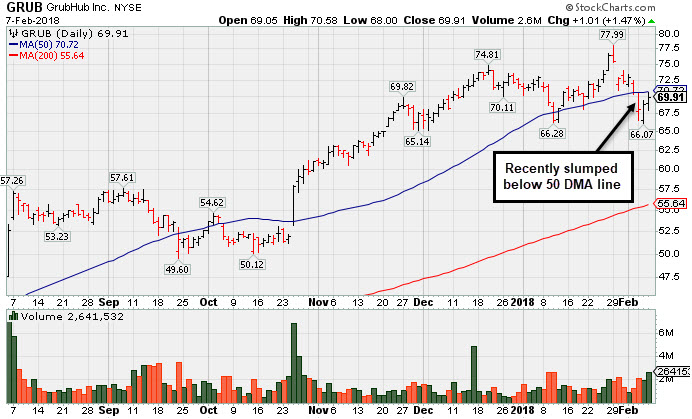
Slumped Below 50-Day Average With Earnings News Due
Kenneth J. Gruneisen - Passed the CAN SLIM® Master's Exam
Grubhub Inc (GRUB +$1.01 or +1.47% to $69.91) undercut the prior low ($66.28 on 1/10/18) and managed a "positive reversal" on the prior session. Only a prompt rebound above the 50-day moving average (DMA) line ($70.72) would help its outlook improve. It is due to report its fourth quarter financial results on Thursday, Feb. 8, 2018 before the market open. Volume and volatility often increase near earnings news.
A lot of bullish action has come even after Grubhub reported Sep '17 quarterly earnings +22% on +32% sales revenues. The 2 latest quarters were below the +25% minimum earnings guideline (C criteria), raising fundamental concerns with regard to the fact-based investment system.
GRUB traded up as much as +76.37% since first highlighted in yellow with pivot point cited based on its 9/29/16 high plus 10 cents in the 4/28/17 mid-day report (read here). Its annual earnings (A criteria) history has been very strong since the high ranked Internet Content firm completed a new Public Offering on 9/03/14.
It has earned a current Timeliness rating of A and a Sponsorship rating of C, but its Accumulation/Distribution rating is D. It was last shown in this FSU section on 1/11/18 with an annotated graph under the headline, "Prompt Rebound Above 50-Day Moving Average Helped Outlook". The number of top-rated funds owning its shares rose from 318 in Jun '16 to 462 in Dec '17, a reassuring sign concerning the I criteria. The current Up/Down Volume Ratio of 1.1 is an unbiased indication its shares have been under slight accumulation over the past 50 days. It has a fairly small supply of only 86.7 million shares (S criteria) outstanding, which can contribute to greater price volatility in the event of institutional buying or selling.
|
|
|
Color Codes Explained :
Y - Better candidates highlighted by our
staff of experts.
G - Previously featured
in past reports as yellow but may no longer be buyable under the
guidelines.
***Last / Change / Volume data in this table is the closing quote data***
Symbol/Exchange
Company Name
Industry Group |
PRICE |
CHANGE
(%Change) |
Day High |
Volume
(% DAV)
(% 50 day avg vol) |
52 Wk Hi
% From Hi |
Featured
Date |
Price
Featured |
Pivot Featured |
|
Max Buy |
ROG
-
NYSE
Rogers Corp
CONSUMER NON-DURABLES - Rubber and Plastics
|
$153.77
|
+2.22
1.46% |
$156.25
|
133,736
84.64% of 50 DAV
50 DAV is 158,000
|
$184.00
-16.43%
|
12/29/2017
|
$162.92
|
PP = $168.17
|
|
MB = $176.58
|
Most Recent Note - 2/6/2018 5:29:54 PM
G - Slumped further below its 50 DMA line ($163.24) today with higher volume after recent losses raised concerns and triggered a technical sell signal. Only a prompt rebound above the 50 DMA line would help its outlook improve.
>>> FEATURED STOCK ARTICLE : Stalled After Recent Technical Breakout - 1/30/2018 |
View all notes |
Set NEW NOTE alert |
Company Profile |
SEC
News |
Chart |
Request a new note
C
A
S
I |
TPL
-
NYSE
Texas Pacific Land Trust
FINANCIAL SERVICES - Diversified Investments
|
$522.19
|
+21.06
4.20% |
$529.75
|
20,376
119.86% of 50 DAV
50 DAV is 17,000
|
$569.99
-8.39%
|
12/21/2017
|
$419.50
|
PP = $435.09
|
|
MB = $456.84
|
 Most Recent Note - 2/7/2018 5:30:10 PM
G - Gapped up today and posted a gain with above average volume. Consolidating after getting very extended from the previously noted base. Its 50 DMA line ($466) defines initial support to watch above prior highs in the $435 area. Reported earnings +29% on +118% sales revenues for the Dec '17 quarter.
>>> FEATURED STOCK ARTICLE : Considerable Gains in First 2-3 Weeks After Recent Breakout - 1/23/2018 |
View all notes |
Set NEW NOTE alert |
Company Profile |
SEC
News |
Chart |
Request a new note
C
A
S
I |
YY
-
NASDAQ
YY Inc
INTERNET - Internet Service Providers
|
$119.99
|
-2.19
-1.79% |
$125.28
|
1,185,925
101.27% of 50 DAV
50 DAV is 1,171,000
|
$142.97
-16.07%
|
12/29/2017
|
$113.06
|
PP = $123.58
|
|
MB = $129.76
|
Most Recent Note - 2/6/2018 5:34:18 PM
G - Today's 3rd consecutive loss had it slumping below prior highs in the $123 area and testing near its 50 DMA line ($120.34) defining important support.
>>> FEATURED STOCK ARTICLE : Retreating After +78% Rally in 5 Months - 2/2/2018 |
View all notes |
Set NEW NOTE alert |
Company Profile |
SEC
News |
Chart |
Request a new note
C
A
S
I |
HTHT
-
NASDAQ
China Lodging Group Ads
LEISURE - Lodging
|
$137.51
|
+0.30
0.22% |
$139.07
|
242,134
33.77% of 50 DAV
50 DAV is 717,000
|
$166.19
-17.26%
|
12/22/2017
|
$138.07
|
PP = $142.90
|
|
MB = $150.05
|
Most Recent Note - 2/6/2018 5:16:45 PM
G - Recently undercut prior highs in the $142 area and it has been sputtering near its 50 DMA line ($137.72). More damaging losses would raise greater concerns.
>>> FEATURED STOCK ARTICLE : Found Support Above Prior High After Latest Breakout - 1/24/2018 |
View all notes |
Set NEW NOTE alert |
Company Profile |
SEC
News |
Chart |
Request a new note
C
A
S
I |
PETS
-
NASDAQ
Petmed Express Inc
RETAIL - Drug Stores
|
$44.12
|
-0.57
-1.28% |
$44.81
|
434,635
60.45% of 50 DAV
50 DAV is 719,000
|
$57.80
-23.67%
|
1/19/2018
|
$53.59
|
PP = $51.00
|
|
MB = $53.55
|
Most Recent Note - 2/6/2018 5:26:40 PM
G - Still sputtering below its 50 DMA line ($45.77). Only a prompt rebound above the 50 DMA line would help its outlook improve. Recently reported earnings +83% on +14% sales revenues, continuing its strong earnings track record.
>>> FEATURED STOCK ARTICLE : Strong Finish Ahead of Earnings News Next Week - 1/19/2018 |
View all notes |
Set NEW NOTE alert |
Company Profile |
SEC
News |
Chart |
Request a new note
C
A
S
I |
Symbol/Exchange
Company Name
Industry Group |
PRICE |
CHANGE
(%Change) |
Day High |
Volume
(% DAV)
(% 50 day avg vol) |
52 Wk Hi
% From Hi |
Featured
Date |
Price
Featured |
Pivot Featured |
|
Max Buy |
ESNT
-
NYSE
Essent Group Ltd
Finance-MrtgandRel Svc
|
$45.02
|
+0.25
0.56% |
$45.64
|
642,927
97.50% of 50 DAV
50 DAV is 659,400
|
$50.08
-10.10%
|
10/9/2017
|
$39.75
|
PP = $41.54
|
|
MB = $43.62
|
Most Recent Note - 2/6/2018 5:08:58 PM
G - Tested near the recent low in the $43.00 area which defines the next important support to watch. Violated its 50 DMA line ($46.06) with a volume-driven loss on the prior session triggering a technical sell signal. Due to report earnings news before the open on Friday, February 9, 2018. See the latest FSU analysis for more details and a new annotated graph.
>>> FEATURED STOCK ARTICLE : Slumped Below 50-Day Average With Earnings News Due Friday - 2/6/2018 |
View all notes |
Set NEW NOTE alert |
Company Profile |
SEC
News |
Chart |
Request a new note
C
A
S
I |
FIVE
-
NASDAQ
Five Below Inc
Retail-DiscountandVariety
|
$64.25
|
+0.61
0.96% |
$65.26
|
808,465
66.00% of 50 DAV
50 DAV is 1,225,000
|
$73.55
-12.64%
|
1/2/2018
|
$69.16
|
PP = $68.99
|
|
MB = $72.44
|
Most Recent Note - 2/6/2018 5:10:26 PM
G - Posted a gain today with near average volume and closed near the session high. Only a prompt rebound above the 50 DMA line ($65.95) would help its outlook improve.
>>> FEATURED STOCK ARTICLE : Consolidating After Negating Breakout From Advanced Base - 1/17/2018 |
View all notes |
Set NEW NOTE alert |
Company Profile |
SEC
News |
Chart |
Request a new note
C
A
S
I |
MDXG
-
NASDAQ
MiMedx Group Inc
Medical-Products
|
$16.41
|
-0.66
-3.87% |
$17.29
|
1,601,766
87.15% of 50 DAV
50 DAV is 1,838,000
|
$18.25
-10.08%
|
1/29/2018
|
$17.43
|
PP = $17.57
|
|
MB = $18.45
|
Most Recent Note - 2/7/2018 5:32:57 PM
Y - Posted a big loss today with below average volume and closed near the session low. Disciplined investors always limit losses by selling any stock that falls more than -7% from their purchase price.
>>> FEATURED STOCK ARTICLE : Hit a New High With it 6th Consecutive Gain - 1/29/2018 |
View all notes |
Set NEW NOTE alert |
Company Profile |
SEC
News |
Chart |
Request a new note
C
A
S
I |
ANET
-
NYSE
Arista Networks Inc
TELECOMMUNICATIONS - Communication Equipment
|
$281.62
|
+9.24
3.39% |
$289.07
|
1,135,829
140.40% of 50 DAV
50 DAV is 809,000
|
$284.76
-1.10%
|
1/8/2018
|
$248.88
|
PP = $245.75
|
|
MB = $258.04
|
Most Recent Note - 2/7/2018 5:29:12 PM
G - Gapped up today and hit a new high with a gain backed by above average volume. Prior highs in the $245 area define initial support to watch along with its 50 DMA line.
>>> FEATURED STOCK ARTICLE : Consolidating After Getting Extended From its Prior High - 1/31/2018 |
View all notes |
Set NEW NOTE alert |
Company Profile |
SEC
News |
Chart |
Request a new note
C
A
S
I |
PAYC
-
NYSE
Paycom Software Inc
COMPUTER SOFTWARE and SERVICES - Application Software
|
$84.50
|
-2.11
-2.44% |
$88.00
|
2,001,777
330.87% of 50 DAV
50 DAV is 605,000
|
$93.61
-9.73%
|
1/12/2018
|
$87.93
|
PP = $86.20
|
|
MB = $90.51
|
Most Recent Note - 2/7/2018 1:08:17 PM
G - Up from early lows after again undercutting its 50 DMA line ($84.20). Managed a "positive reversal" on the prior session. More damaging losses would raise serious concerns. Reported Dec '17 quarterly earnings +61% on +30% sales revenues after the close, continuing its strong earnings track record.
>>> FEATURED STOCK ARTICLE : Finished Strong With Big Gain on +118% Above Average Volume - 1/12/2018 |
View all notes |
Set NEW NOTE alert |
Company Profile |
SEC
News |
Chart |
Request a new note
C
A
S
I |
Symbol/Exchange
Company Name
Industry Group |
PRICE |
CHANGE
(%Change) |
Day High |
Volume
(% DAV)
(% 50 day avg vol) |
52 Wk Hi
% From Hi |
Featured
Date |
Price
Featured |
Pivot Featured |
|
Max Buy |
GRUB
-
NYSE
Grubhub Inc
COMPUTER SOFTWARE and SERVICES - Technical and System Software
|
$69.91
|
+1.01
1.47% |
$70.58
|
2,630,504
197.78% of 50 DAV
50 DAV is 1,330,000
|
$77.99
-10.35%
|
6/21/2017
|
$47.33
|
PP = $46.94
|
|
MB = $49.29
|
Most Recent Note - 2/7/2018 5:25:25 PM
G - Only a prompt rebound above the 50 DMA line ($70.72) would help its outlook improve. Due to report its fourth quarter financial results on Thursday, Feb. 8, 2018 before the market open. Volume and volatility often increase near earnings news. See the latest FSU analysis for more details and a new annotated graph.
>>> FEATURED STOCK ARTICLE : Slumped Below 50-Day Average With Earnings News Due - 2/7/2018 |
View all notes |
Set NEW NOTE alert |
Company Profile |
SEC
News |
Chart |
Request a new note
C
A
S
I |
PYPL
-
NASDAQ
Paypal Holdings Inc
Finance-CrdtCard/PmtPr
|
$75.59
|
-0.09
-0.12% |
$77.58
|
11,596,050
112.23% of 50 DAV
50 DAV is 10,332,000
|
$86.32
-12.43%
|
2/1/2018
|
$80.35
|
PP = $79.49
|
|
MB = $83.46
|
Most Recent Note - 2/6/2018 5:28:00 PM
G - Posted a small gain today, but remains below its 50 DMA line after 3 consecutive losses marked by above average volume. Only a prompt rebound above the 50 DMA line ($77.47) would help its outlook improve.
>>> FEATURED STOCK ARTICLE : Gap Down Following Earnings News Tests Important Support Level - 2/1/2018 |
View all notes |
Set NEW NOTE alert |
Company Profile |
SEC
News |
Chart |
Request a new note
C
A
S
I |
OLLI
-
NASDAQ
Ollie's Bargain Outlet
Retail-DiscountandVariety
|
$55.80
|
+0.55
1.00% |
$56.40
|
572,923
92.71% of 50 DAV
50 DAV is 618,000
|
$58.50
-4.62%
|
11/21/2017
|
$46.78
|
PP = $47.00
|
|
MB = $49.35
|
Most Recent Note - 2/6/2018 5:22:24 PM
G - Slumped below its 50 DMA line ($52.43) today then managed a "positive reversal" for a gain with above average volume. Prior low ($50.15 on 1/04/18) defines the next important near-term support.
>>> FEATURED STOCK ARTICLE : Bargain Outlet Looked Expensive Before +114% Rally in 18 Months - 1/18/2018 |
View all notes |
Set NEW NOTE alert |
Company Profile |
SEC
News |
Chart |
Request a new note
C
A
S
I |
WB
-
NASDAQ
Weibo Corp Cl A Ads
INTERNET - Content
|
$117.53
|
-0.78
-0.66% |
$121.11
|
1,386,374
81.46% of 50 DAV
50 DAV is 1,702,000
|
$136.19
-13.70%
|
1/16/2018
|
$126.33
|
PP = $122.21
|
|
MB = $128.32
|
Most Recent Note - 2/6/2018 5:32:51 PM
G - Slumped below prior highs in the $123 area raising concerns with volume-driven losses. Testing support at its 50 DMA line ($115.13).
>>> FEATURED STOCK ARTICLE : Close in Session's Lower Third a Sign of Distributional Pressure - 1/16/2018 |
View all notes |
Set NEW NOTE alert |
Company Profile |
SEC
News |
Chart |
Request a new note
C
A
S
I |
HLI
-
NYSE
Houlihan Lokey Inc Cl A
Finance-Invest Bnk/Bkrs
|
$47.05
|
+1.34
2.93% |
$47.27
|
270,361
132.53% of 50 DAV
50 DAV is 204,000
|
$52.81
-10.91%
|
1/3/2018
|
$45.88
|
PP = $47.09
|
|
MB = $49.44
|
Most Recent Note - 2/7/2018 5:28:05 PM
G - Today's gain and close back above the 50 DMA line ($46.93) helped its outlook improve. Recently reported earnings +21% on +5% sales revenues for the Dec '17 quarter, below the +25% minimum earnings guideline (C criteria), raising fundamental concerns. On 10/26/17 it completed a Secondary Offering.
>>> FEATURED STOCK ARTICLE : Damaging Violation of 50-Day Moving Average Line - 2/5/2018 |
View all notes |
Set NEW NOTE alert |
Company Profile |
SEC
News |
Chart |
Request a new note
C
A
S
I |
Symbol/Exchange
Company Name
Industry Group |
PRICE |
CHANGE
(%Change) |
Day High |
Volume
(% DAV)
(% 50 day avg vol) |
52 Wk Hi
% From Hi |
Featured
Date |
Price
Featured |
Pivot Featured |
|
Max Buy |
ICHR
-
NASDAQ
Ichor Holdings Ltd
ELECTRONICS - Semiconductor Equipment
|
$26.37
|
-1.56
-5.59% |
$28.28
|
1,936,508
152.12% of 50 DAV
50 DAV is 1,273,000
|
$35.51
-25.74%
|
1/22/2018
|
$34.00
|
PP = $35.61
|
|
MB = $37.39
|
Most Recent Note - 2/7/2018 5:32:05 PM
G - Slumped back below its 50 DMA line ($27.41) with above average volume again behind today's big loss. A prompt rebound above the 50 DMA line is needed for its outlook to improve. Faces near-term resistance due to overhead supply up through the $35 level.
>>> FEATURED STOCK ARTICLE : Found Support at 200 Day Average and Rebounded Near Prior High - 1/22/2018 |
View all notes |
Set NEW NOTE alert |
Company Profile |
SEC
News |
Chart |
Request a new note
C
A
S
I |
|
|
|
THESE ARE NOT BUY RECOMMENDATIONS!
Comments contained in the body of this report are technical
opinions only. The material herein has been obtained
from sources believed to be reliable and accurate, however,
its accuracy and completeness cannot be guaranteed.
This site is not an investment advisor, hence it does
not endorse or recommend any securities or other investments.
Any recommendation contained in this report may not
be suitable for all investors and it is not to be deemed
an offer or solicitation on our part with respect to
the purchase or sale of any securities. All trademarks,
service marks and trade names appearing in this report
are the property of their respective owners, and are
likewise used for identification purposes only.
This report is a service available
only to active Paid Premium Members.
You may opt-out of receiving report notifications
at any time. Questions or comments may be submitted
by writing to Premium Membership Services 665 S.E. 10 Street, Suite 201 Deerfield Beach, FL 33441-5634 or by calling 1-800-965-8307
or 954-785-1121.
|
|
|