You are not logged in.
This means you
CAN ONLY VIEW reports that were published prior to Wednesday, March 26, 2025.
You
MUST UPGRADE YOUR MEMBERSHIP if you want to see any current reports.
AFTER MARKET UPDATE - THURSDAY, FEBRUARY 1ST, 2018
Previous After Market Report Next After Market Report >>>
|
|
|
|
DOW |
+37.32 |
26,186.71 |
+0.14% |
|
Volume |
913,522,820 |
-19% |
|
Volume |
2,294,138,480 |
-5% |
|
NASDAQ |
-25.62 |
7,385.86 |
-0.35% |
|
Advancers |
1,318 |
44% |
|
Advancers |
1,188 |
53% |
|
S&P 500 |
-1.83 |
2,821.98 |
-0.06% |
|
Decliners |
1,647 |
56% |
|
Decliners |
1,072 |
47% |
|
Russell 2000 |
+4.88 |
1,579.87 |
+0.31% |
|
52 Wk Highs |
88 |
|
|
52 Wk Highs |
89 |
|
|
S&P 600 |
+4.53 |
963.92 |
+0.47% |
|
52 Wk Lows |
125 |
|
|
52 Wk Lows |
88 |
|
|
 |
Major Indices Ended Mixed With Less Leadership
Kenneth J. Gruneisen - Passed the CAN SLIM® Master's Exam
U.S. Stocks finished mixed Thursday. The Dow added 37 points to 26186. The S&P 500 lost 2 points to 2821 and the Nasdaq Composite fell 26 points to 7385. Volume totals reported were lighter than the prior session totals on the NYSE and on the Nasdaq exchange. Decliners led advancers by 8-7 on the NYSE while advancers narrowly outnumbered decliners on the Nasdaq exchange. New 52-week highs outnumbered new 52-week lows on the NYSE while the totals were nearly even on the Nasdaq exchange. There were 34 high-ranked companies from the Leaders List that made new 52-week highs and were listed on the BreakOuts Page, versus the total of 35 on the prior session. The Featured Stocks Page provides the latest analysis on noteworthy high-ranked leaders. Charts used courtesy of www.stockcharts.com
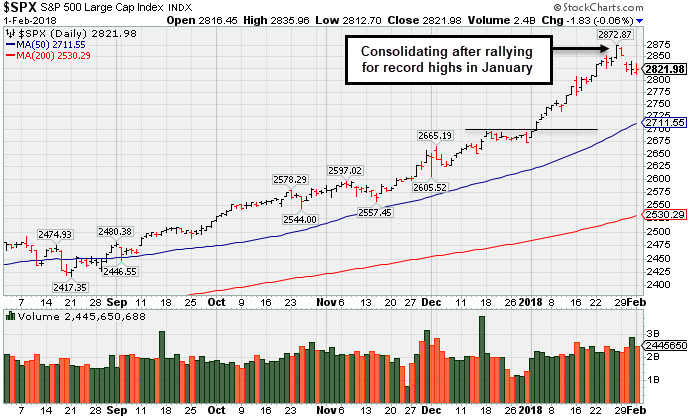 PICTURED: The S&P 500 Index is consolidating after rallying for record highs in January. The major averages (M criteria) are in a confirmed uptrend. Investors should only consider stocks meeting all key criteria of the fact-based investment system as they trigger technical buy signals.
U.S. equities experienced a choppy session as investors digested economic and corporate earnings releases. On the data front, initial jobless claims fell 1,000 to 230,000 in the most recent week. Another report showed construction spending grew 0.7% in December. The Institute for Supply Management (ISM) said the pace of manufacturing activity expanded last month while prices paid by U.S. factories rose to a near seven year high. ISM data also revealed fourth-quarter labor costs increased 2.0%, helping to confirm the Fed’s revised inflation outlook. The yield on the 10-year note jumped seven basis points to 2.79%. The 30-year bond yield topped 3.00% for the first time since May 2017 after the Atlanta Fed suggested U.S. GDP could grow at an annualized 5.4% rate in the current quarter.
Shares of EBay (EBAY +13.82%) surged and Facebook (FB +3.32%) rose following their positive earnings releases. AT&T (T +4.57%) rose after beating analyst revenue projections. United Parcel Service (UPS -6.13%) fell on the company’s disappointing forward guidance. Consumer Discretionary lagged with Tractor Supply (TSCO -6.31%) and Hershey (HSY -5.95%) both down following their quarterly results.
In commodities, NYMEX WTI crude surged 2.1% to $66.08/barrel. COMEX gold gained 0.8% to $1349.80/ounce. |
 Kenneth J. Gruneisen started out as a licensed stockbroker in August 1987, a couple of months prior to the historic stock market crash that took the Dow Jones Industrial Average down -22.6% in a single day. He has published daily fact-based fundamental and technical analysis on high-ranked stocks online for two decades. Through FACTBASEDINVESTING.COM, Kenneth provides educational articles, news, market commentary, and other information regarding proven investment systems that work in good times and bad.
Comments contained in the body of this report are technical opinions only and are not necessarily those of Gruneisen Growth Corp. The material herein has been obtained from sources believed to be reliable and accurate, however, its accuracy and completeness cannot be guaranteed. Our firm, employees, and customers may effect transactions, including transactions contrary to any recommendation herein, or have positions in the securities mentioned herein or options with respect thereto. Any recommendation contained in this report may not be suitable for all investors and it is not to be deemed an offer or solicitation on our part with respect to the purchase or sale of any securities. |
|
 |
Financial, Energy, and Biotech Indexes Rose
Kenneth J. Gruneisen - Passed the CAN SLIM® Master's Exam
The Retail Index ($RLX -2.07%) lost ground while the Bank Index ($BKX +1.06%) and the Broker/Dealer Index ($XBD +2.05%) both were higher. The Biotechnology Index ($BTK +0.75%) and the Networking Index ($NWX +0.25%) both posted gains while the Semiconductor Index ($SOX -0.47%) fell. The Integrated Oil Index ($XOI +0.49%) and the Oil Services Index ($OSX +2.08%) both rose while the Gold & Silver Index ($XAU -0.07%) ended unchanged. Charts courtesy wwwstockcharts.com
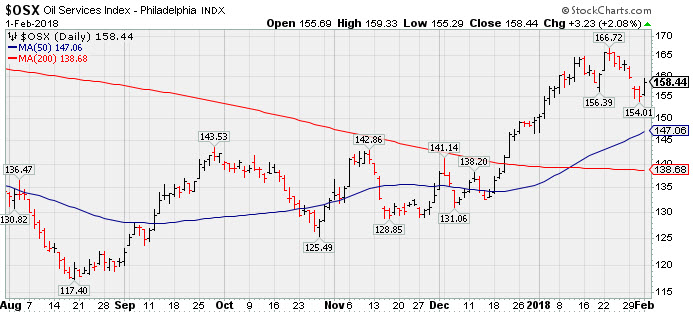 PICTURED: The Oil Services Index ($OSX +2.08%) is consolidating above its 50-day moving average (DMA) line. That short-term average rallied above longer-term 200 DMA line earlier this month, a bullish technical indication for oil services stocks.
| Oil Services |
$OSX |
158.44 |
+3.24 |
+2.09% |
+5.94% |
| Integrated Oil |
$XOI |
1,413.15 |
+6.91 |
+0.49% |
+5.81% |
| Semiconductor |
$SOX |
1,355.07 |
-6.43 |
-0.47% |
+8.14% |
| Networking |
$NWX |
513.47 |
+1.29 |
+0.25% |
+4.68% |
| Broker/Dealer |
$XBD |
284.21 |
+5.70 |
+2.05% |
+7.15% |
| Retail |
$RLX |
1,959.25 |
-41.45 |
-2.07% |
+13.01% |
| Gold & Silver |
$XAU |
87.60 |
-0.06 |
-0.07% |
+2.73% |
| Bank |
$BKX |
116.52 |
+1.22 |
+1.06% |
+9.19% |
| Biotech |
$BTK |
4,807.69 |
+36.01 |
+0.75% |
+13.87% |
|
|
|
 |
Gap Down Following Earnings News Tests Important Support Level
Kenneth J. Gruneisen - Passed the CAN SLIM® Master's Exam
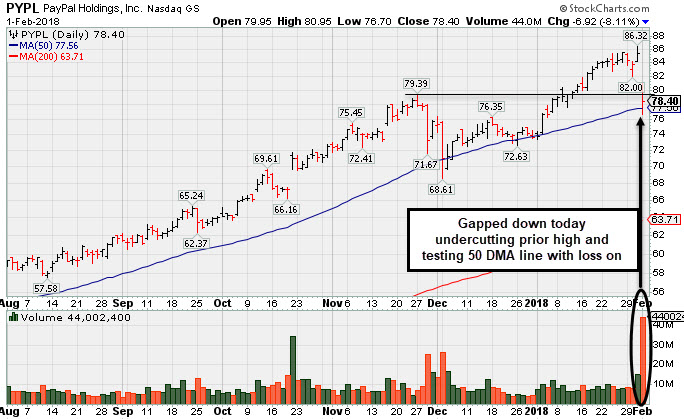
Paypal Holdings Inc (PYPL -$6.92 or -8.11% to $78.40) gapped down today undercutting its prior high and testing support at its 50-day moving average (DMA) line ($77.56). It was highlighted in yellow in the earlier mid-day report (read here) while testing support at prior highs and its 10 week moving average line ($78.00). The well-known digital payments firm is featured at a "secondary buy point" following a breakout in recent weeks from a flat base above its 50-day moving average (DMA) line. More damaging losses, however, may trigger a technical sell signal.
Sales revenues rose by +17%, +18%, +21%, and +26% in the Mar, Jun, Sep, Dec '17 quarters, respectively, versus the year ago periods. This is very encouraging sales revenues and earnings growth rate acceleration in sequential quarterly comparisons, making it a better match with the fact-based investment system's winning models. Its annual earnings (A criteria) history has been very strong and steady. It reported earnings +31% on +26% sales revenues for the Dec '17 quarter, its 3rd consecutive quarterly earnings increase above the +25% minimum guideline (C criteria).
The high-ranked Finance - Credit Card/Payment Processing firm saw the number of top-rated funds owning its shares rise from 2,056 in Mar '17 to 2,351 in Dec '17, a reassuring sign concerning the I criteria. Its current Up/Down Volume Ratio of 1.3 is an unbiased indication its shares have been under accumulation over the past 50 days. It has a Timeliness Rating of A and Sponsorship Rating of B. Charts courtesy wwwstockcharts.com
 |
|
|
Color Codes Explained :
Y - Better candidates highlighted by our
staff of experts.
G - Previously featured
in past reports as yellow but may no longer be buyable under the
guidelines.
***Last / Change / Volume data in this table is the closing quote data***
Symbol/Exchange
Company Name
Industry Group |
PRICE |
CHANGE
(%Change) |
Day High |
Volume
(% DAV)
(% 50 day avg vol) |
52 Wk Hi
% From Hi |
Featured
Date |
Price
Featured |
Pivot Featured |
|
Max Buy |
THO
-
NYSE
Thor Industries Inc
AUTOMOTIVE - Recreational Vehicles
|
$136.89
|
+0.23
0.17% |
$138.64
|
586,467
84.46% of 50 DAV
50 DAV is 694,400
|
$161.48
-15.23%
|
12/19/2017
|
$153.92
|
PP = $156.96
|
|
MB = $164.81
|
Most Recent Note - 1/31/2018 6:59:42 PM
G - Slumped further below its 50 DMA line today after damaging volume-driven losses triggering a technical sell signal. Only a prompt rebound above the 50 DMA line ($149.92) would help its outlook improve.
>>> FEATURED STOCK ARTICLE : Damaging Losses Hurt Companies That Make Recreational Vehicles - 1/26/2018 |
View all notes |
Set NEW NOTE alert |
Company Profile |
SEC
News |
Chart |
Request a new note
C
A
S
I |
ROG
-
NYSE
Rogers Corp
CONSUMER NON-DURABLES - Rubber and Plastics
|
$164.30
|
-0.48
-0.29% |
$164.70
|
223,318
145.01% of 50 DAV
50 DAV is 154,000
|
$184.00
-10.71%
|
12/29/2017
|
$162.92
|
PP = $168.17
|
|
MB = $176.58
|
Most Recent Note - 1/30/2018 7:12:24 PM
Y - Recently stalled and it is quietly consolidating above its 50 DMA line ($163.44) which defines important near-term support to watch. See the latest FSU analysis for more details and an annotated graph.
>>> FEATURED STOCK ARTICLE : Stalled After Recent Technical Breakout - 1/30/2018 |
View all notes |
Set NEW NOTE alert |
Company Profile |
SEC
News |
Chart |
Request a new note
C
A
S
I |
TPL
-
NYSE
Texas Pacific Land Trust
FINANCIAL SERVICES - Diversified Investments
|
$529.12
|
-7.93
-1.48% |
$538.21
|
21,597
134.98% of 50 DAV
50 DAV is 16,000
|
$569.99
-7.17%
|
12/21/2017
|
$419.50
|
PP = $435.09
|
|
MB = $456.84
|
 Most Recent Note - 2/1/2018 1:25:19 PM
G - Reported earnings +29% on +118% sales revenues for the Dec '17 quarter. Still consolidating near its high after getting very extended from the previously noted base. Its 50 DMA line ($458) defines initial support to watch above prior highs in the $434 area.
>>> FEATURED STOCK ARTICLE : Considerable Gains in First 2-3 Weeks After Recent Breakout - 1/23/2018 |
View all notes |
Set NEW NOTE alert |
Company Profile |
SEC
News |
Chart |
Request a new note
C
A
S
I |
YY
-
NASDAQ
YY Inc
INTERNET - Internet Service Providers
|
$133.86
|
+0.90
0.68% |
$137.43
|
1,279,989
104.06% of 50 DAV
50 DAV is 1,230,000
|
$142.97
-6.37%
|
12/29/2017
|
$113.06
|
PP = $123.58
|
|
MB = $129.76
|
Most Recent Note - 1/30/2018 7:16:53 PM
G - Finished near its session high after a gap down deep early losses today tested prior highs in the $123 area. Its 50 DMA line ($118.96) defines the next support to watch on pullbacks. This China-based Internet - Content firm's fundamentals remain strong.
>>> FEATURED STOCK ARTICLE : Touched a New High But Ended Below New Pivot Point Cited - 1/4/2018 |
View all notes |
Set NEW NOTE alert |
Company Profile |
SEC
News |
Chart |
Request a new note
C
A
S
I |
HTHT
-
NASDAQ
China Lodging Group Ads
LEISURE - Lodging
|
$143.45
|
-6.04
-4.04% |
$148.89
|
655,716
92.88% of 50 DAV
50 DAV is 706,000
|
$166.19
-13.68%
|
12/22/2017
|
$138.07
|
PP = $142.90
|
|
MB = $150.05
|
Most Recent Note - 2/1/2018 5:47:29 PM
G - Fell today with higher (near average) volume, slumping near prior highs in the $142 area defining initial support above the 50 DMA line. Abruptly dipped and briefly undercut its 50 DMA line ($135.49) then promptly rebounded from 1/29/18 session lows.
>>> FEATURED STOCK ARTICLE : Found Support Above Prior High After Latest Breakout - 1/24/2018 |
View all notes |
Set NEW NOTE alert |
Company Profile |
SEC
News |
Chart |
Request a new note
C
A
S
I |
Symbol/Exchange
Company Name
Industry Group |
PRICE |
CHANGE
(%Change) |
Day High |
Volume
(% DAV)
(% 50 day avg vol) |
52 Wk Hi
% From Hi |
Featured
Date |
Price
Featured |
Pivot Featured |
|
Max Buy |
PETS
-
NASDAQ
Petmed Express Inc
RETAIL - Drug Stores
|
$44.37
|
-0.83
-1.84% |
$45.56
|
626,586
90.16% of 50 DAV
50 DAV is 695,000
|
$57.80
-23.24%
|
1/19/2018
|
$53.59
|
PP = $51.00
|
|
MB = $53.55
|
Most Recent Note - 1/31/2018 7:07:52 PM
G - Fell to a close just below its 50 DMA line ($45.40) today, slumping further after a "negative reversal" on 1/22/18 following earnings news. Color code is changed to green. Only a prompt rebound above the 50 DMA line would help its outlook improve. Reported earnings +83% on +14% sales revenues, continuing its strong earnings track record.
>>> FEATURED STOCK ARTICLE : Strong Finish Ahead of Earnings News Next Week - 1/19/2018 |
View all notes |
Set NEW NOTE alert |
Company Profile |
SEC
News |
Chart |
Request a new note
C
A
S
I |
PATK
-
NASDAQ
Patrick Industries Inc
Bldg-Mobile/Mfg and RV
|
$63.85
|
-0.20
-0.31% |
$65.50
|
430,820
233.51% of 50 DAV
50 DAV is 184,500
|
$72.35
-11.75%
|
10/26/2017
|
$90.90
|
PP = $87.90
|
|
MB = $92.30
|
Most Recent Note - 2/1/2018 1:08:46 PM
G - Slumped further below its 50 DMA line ($66.70) today after considerable volume-driven losses recently raised concerns and triggering a technical sell signal. Its Relative Strength Rating has slumped to 74, below the 80+ minimum guideline for buy candidates.
>>> FEATURED STOCK ARTICLE : Pulled Back From Record High With Higher Volume - 1/10/2018 |
View all notes |
Set NEW NOTE alert |
Company Profile |
SEC
News |
Chart |
Request a new note
C
A
S
I |
ESNT
-
NYSE
Essent Group Ltd
Finance-MrtgandRel Svc
|
$47.79
|
+1.27
2.73% |
$47.90
|
472,972
72.30% of 50 DAV
50 DAV is 654,200
|
$50.08
-4.57%
|
10/9/2017
|
$39.75
|
PP = $41.54
|
|
MB = $43.62
|
Most Recent Note - 1/29/2018 6:20:55 PM
G - Its 50 DMA line ($45.87) and recent lows in the $43.00 area define important support to watch..Its Relative Strength rating has slumped to 79, but it is still only -5.3% off its high.
>>> FEATURED STOCK ARTICLE : Perched Near High After Brief Consolidation Below 50 DMA Line - 1/9/2018 |
View all notes |
Set NEW NOTE alert |
Company Profile |
SEC
News |
Chart |
Request a new note
C
A
S
I |
FIVE
-
NASDAQ
Five Below Inc
Retail-DiscountandVariety
|
$64.97
|
+0.04
0.06% |
$65.60
|
702,897
58.97% of 50 DAV
50 DAV is 1,192,000
|
$73.55
-11.67%
|
1/2/2018
|
$69.16
|
PP = $68.99
|
|
MB = $72.44
|
Most Recent Note - 2/1/2018 5:52:12 PM
G - Color code is changed to green while sputtering just below its 50 DMA line ($65.74) and undercutting the recent low ($64.73 on 1/10/18) intra-day. Subsequent losses may trigger a more worrisome technical sell signal. Fundamentals remain very strong.
>>> FEATURED STOCK ARTICLE : Consolidating After Negating Breakout From Advanced Base - 1/17/2018 |
View all notes |
Set NEW NOTE alert |
Company Profile |
SEC
News |
Chart |
Request a new note
C
A
S
I |
MDXG
-
NASDAQ
MiMedx Group Inc
Medical-Products
|
$17.13
|
+0.38
2.27% |
$17.33
|
1,481,702
79.32% of 50 DAV
50 DAV is 1,868,000
|
$18.25
-6.14%
|
1/29/2018
|
$17.43
|
PP = $17.57
|
|
MB = $18.45
|
Most Recent Note - 1/31/2018 7:01:58 PM
Y - Pulled back today for a 2nd loss on near average volume. Prior gains backed by above average volume triggered a technical buy signal. Disciplined investors always limit losses by selling any stock that falls more than -7% from their purchase price. See the latest FSU analysis for more details and an annotated graph.
>>> FEATURED STOCK ARTICLE : Hit a New High With it 6th Consecutive Gain - 1/29/2018 |
View all notes |
Set NEW NOTE alert |
Company Profile |
SEC
News |
Chart |
Request a new note
C
A
S
I |
Symbol/Exchange
Company Name
Industry Group |
PRICE |
CHANGE
(%Change) |
Day High |
Volume
(% DAV)
(% 50 day avg vol) |
52 Wk Hi
% From Hi |
Featured
Date |
Price
Featured |
Pivot Featured |
|
Max Buy |
ANET
-
NYSE
Arista Networks Inc
TELECOMMUNICATIONS - Communication Equipment
|
$275.00
|
-0.82
-0.30% |
$276.97
|
825,269
104.46% of 50 DAV
50 DAV is 790,000
|
$284.76
-3.43%
|
1/8/2018
|
$248.88
|
PP = $245.75
|
|
MB = $258.04
|
Most Recent Note - 1/30/2018 12:46:31 PM
G - Rebounded promptly after a sharp pullback at the open briefly undercut its "max buy" level. Prior highs in the $245 area define initial support to watch above its 50 DMA line ($242.70).
>>> FEATURED STOCK ARTICLE : Consolidating After Getting Extended From its Prior High - 1/31/2018 |
View all notes |
Set NEW NOTE alert |
Company Profile |
SEC
News |
Chart |
Request a new note
C
A
S
I |
PAYC
-
NYSE
Paycom Software Inc
COMPUTER SOFTWARE and SERVICES - Application Software
|
$90.17
|
-1.47
-1.60% |
$92.12
|
528,675
91.62% of 50 DAV
50 DAV is 577,000
|
$93.61
-3.67%
|
1/12/2018
|
$87.93
|
PP = $86.20
|
|
MB = $90.51
|
Most Recent Note - 1/31/2018 6:54:32 PM
G - Stubbornly holding its ground perched near its all-time high, extended from any sound base. Prior highs near $86 and its 50 DMA line ($83.90) define initial support to watch on pullbacks.
>>> FEATURED STOCK ARTICLE : Finished Strong With Big Gain on +118% Above Average Volume - 1/12/2018 |
View all notes |
Set NEW NOTE alert |
Company Profile |
SEC
News |
Chart |
Request a new note
C
A
S
I |
GRUB
-
NYSE
Grubhub Inc
COMPUTER SOFTWARE and SERVICES - Technical and System Software
|
$72.86
|
+0.61
0.84% |
$73.47
|
884,287
69.46% of 50 DAV
50 DAV is 1,273,000
|
$77.99
-6.57%
|
6/21/2017
|
$47.33
|
PP = $46.94
|
|
MB = $49.29
|
Most Recent Note - 1/29/2018 12:38:46 PM
G - Hit another new all-time high today. Big volume-driven gain on Friday cleared a short flat base during which it found prompt support near its 50 DMA line. The 2 latest quarterly comparisons were below the +25% minimum earnings guideline, so fundamental concerns were raised and noted before.
>>> FEATURED STOCK ARTICLE : Prompt Rebound Above 50-Day Moving Average Helped Outlook - 1/11/2018 |
View all notes |
Set NEW NOTE alert |
Company Profile |
SEC
News |
Chart |
Request a new note
C
A
S
I |
IBP
-
NYSE
Installed Building Prod
DIVERSIFIED SERVICES - Business/Management Services
|
$71.25
|
-0.70
-0.97% |
$72.85
|
148,357
82.88% of 50 DAV
50 DAV is 179,000
|
$79.40
-10.26%
|
12/26/2017
|
$75.00
|
PP = $79.50
|
|
MB = $83.48
|
Most Recent Note - 1/31/2018 6:52:43 PM
G - Ended near the session low with a loss on higher volume, closing below its 50 DMA line ($73.93) raising concerns and its color code is changed to green. Prior low ($68.30 on 12/13/17) defines the next important support level where a violation may trigger more worrisome technical sell signal. A rebound above the 50 DMA line is needed for its outlook to improve. Subsequent volume-driven gains for new highs may trigger a new (or add-on) technical buy signal.
>>> FEATURED STOCK ARTICLE : Quietly Consolidating Near 50-Day Moving Average Line - 1/25/2018 |
View all notes |
Set NEW NOTE alert |
Company Profile |
SEC
News |
Chart |
Request a new note
C
A
S
I |
PYPL
-
NASDAQ
Paypal Holdings Inc
Finance-CrdtCard/PmtPr
|
$78.40
|
-6.92
-8.11% |
$80.95
|
44,199,459
492.31% of 50 DAV
50 DAV is 8,978,000
|
$86.32
-9.18%
|
2/1/2018
|
$80.35
|
PP = $79.49
|
|
MB = $83.46
|
Most Recent Note - 2/1/2018 5:42:35 PM
Y - Gapped down today testing support at prior highs and its 10 week moving average line ($78.00). The well-known digital payments firm is featured at a "secondary buy point" following a breakout in recent weeks from a flat base above its 50 DMA line. More damaging losses may trigger a technical sell signal. Reported earnings +31% on +26% sales revenues for the Dec '17 quarter, its 3rd consecutive quarterly earnings increase above the +25% minimum guideline (C criteria). Showing very encouraging sales revenues and earnings growth rate acceleration in sequential quarterly comparisons, making it a better match with the fact-based investment system's winning models. See the latest FSU analysis for more details and an annotated graph.
>>> FEATURED STOCK ARTICLE : Gap Down Following Earnings News Tests Important Support Level - 2/1/2018 |
View all notes |
Set NEW NOTE alert |
Company Profile |
SEC
News |
Chart |
Request a new note
C
A
S
I |
Symbol/Exchange
Company Name
Industry Group |
PRICE |
CHANGE
(%Change) |
Day High |
Volume
(% DAV)
(% 50 day avg vol) |
52 Wk Hi
% From Hi |
Featured
Date |
Price
Featured |
Pivot Featured |
|
Max Buy |
OLLI
-
NASDAQ
Ollie's Bargain Outlet
Retail-DiscountandVariety
|
$55.25
|
-0.30
-0.54% |
$55.95
|
468,866
75.26% of 50 DAV
50 DAV is 623,000
|
$58.50
-5.56%
|
11/21/2017
|
$46.78
|
PP = $47.00
|
|
MB = $49.35
|
Most Recent Note - 1/30/2018 7:07:37 PM
G - Pulled back from its all-time high after getting very extended from any sound base. Its 50 DMA line ($51.61) and recent low ($50.15 on 1/04/18) define important near-term support above prior highs in the $46 area. Fundamentals remain very strong.
>>> FEATURED STOCK ARTICLE : Bargain Outlet Looked Expensive Before +114% Rally in 18 Months - 1/18/2018 |
View all notes |
Set NEW NOTE alert |
Company Profile |
SEC
News |
Chart |
Request a new note
C
A
S
I |
WB
-
NASDAQ
Weibo Corp Cl A Ads
INTERNET - Content
|
$130.10
|
+0.53
0.41% |
$133.38
|
1,951,577
117.71% of 50 DAV
50 DAV is 1,658,000
|
$136.19
-4.47%
|
1/16/2018
|
$126.33
|
PP = $122.21
|
|
MB = $128.32
|
Most Recent Note - 1/29/2018 1:13:54 PM
G - Perched near its all-time high today after wedging higher with recent gains lacking great volume conviction. Prior highs in the $123 area define initial support to watch on pullbacks.
>>> FEATURED STOCK ARTICLE : Close in Session's Lower Third a Sign of Distributional Pressure - 1/16/2018 |
View all notes |
Set NEW NOTE alert |
Company Profile |
SEC
News |
Chart |
Request a new note
C
A
S
I |
HLI
-
NYSE
Houlihan Lokey Inc Cl A
Finance-Invest Bnk/Bkrs
|
$48.29
|
+0.59
1.24% |
$48.33
|
329,571
169.01% of 50 DAV
50 DAV is 195,000
|
$52.81
-8.56%
|
1/3/2018
|
$45.88
|
PP = $47.09
|
|
MB = $49.44
|
Most Recent Note - 1/31/2018 7:04:40 PM
G - Reported earnings +21% on +5% sales revenues for the Dec '17 quarter, below the +25% minimum earnings guideline (C criteria), raising fundamental concerns. Pulled back for a 2nd consecutive loss following a "negative reversal" after hitting a new all-time high. Extended from any sound base, its 50 DMA line ($46.63) defines near-term support to watch on pullbacks. On 10/26/17 it completed a Secondary Offering.
>>> FEATURED STOCK ARTICLE : Tight Weekly Closes Formed Advanced Base Pattern - 1/3/2018 |
View all notes |
Set NEW NOTE alert |
Company Profile |
SEC
News |
Chart |
Request a new note
C
A
S
I |
ICHR
-
NASDAQ
Ichor Holdings Ltd
ELECTRONICS - Semiconductor Equipment
|
$30.55
|
-1.37
-4.29% |
$31.90
|
1,267,681
97.89% of 50 DAV
50 DAV is 1,295,000
|
$35.51
-13.97%
|
1/22/2018
|
$34.00
|
PP = $35.61
|
|
MB = $37.39
|
Most Recent Note - 2/1/2018 5:44:16 PM
Y - Pulled back today for a 4th consecutive loss on near average or lighter volume. Subsequent gains above the pivot point backed by at least +40% above average volume are still needed to trigger a technical buy signal.
>>> FEATURED STOCK ARTICLE : Found Support at 200 Day Average and Rebounded Near Prior High - 1/22/2018 |
View all notes |
Set NEW NOTE alert |
Company Profile |
SEC
News |
Chart |
Request a new note
C
A
S
I |
|
|
|
THESE ARE NOT BUY RECOMMENDATIONS!
Comments contained in the body of this report are technical
opinions only. The material herein has been obtained
from sources believed to be reliable and accurate, however,
its accuracy and completeness cannot be guaranteed.
This site is not an investment advisor, hence it does
not endorse or recommend any securities or other investments.
Any recommendation contained in this report may not
be suitable for all investors and it is not to be deemed
an offer or solicitation on our part with respect to
the purchase or sale of any securities. All trademarks,
service marks and trade names appearing in this report
are the property of their respective owners, and are
likewise used for identification purposes only.
This report is a service available
only to active Paid Premium Members.
You may opt-out of receiving report notifications
at any time. Questions or comments may be submitted
by writing to Premium Membership Services 665 S.E. 10 Street, Suite 201 Deerfield Beach, FL 33441-5634 or by calling 1-800-965-8307
or 954-785-1121.
|
|
|

