You are not logged in.
This means you
CAN ONLY VIEW reports that were published prior to Wednesday, March 26, 2025.
You
MUST UPGRADE YOUR MEMBERSHIP if you want to see any current reports.
AFTER MARKET UPDATE - MONDAY, FEBRUARY 5TH, 2018
Previous After Market Report Next After Market Report >>>
|
|
|
|
DOW |
-1,175.21 |
24,345.75 |
-4.60% |
|
Volume |
1,323,301,160 |
+29% |
|
Volume |
3,075,164,400 |
+20% |
|
NASDAQ |
-273.42 |
6,967.53 |
-3.78% |
|
Advancers |
324 |
11% |
|
Advancers |
381 |
12% |
|
S&P 500 |
-113.19 |
2,648.94 |
-4.10% |
|
Decliners |
2,739 |
89% |
|
Decliners |
2,746 |
88% |
|
Russell 2000 |
-56.18 |
1,491.09 |
-3.63% |
|
52 Wk Highs |
16 |
|
|
52 Wk Highs |
21 |
|
|
S&P 600 |
-34.75 |
908.74 |
-3.68% |
|
52 Wk Lows |
454 |
|
|
52 Wk Lows |
204 |
|
|
 |
Damaging Losses on Heavier Volume Signal Market Correction
Kenneth J. Gruneisen - Passed the CAN SLIM® Master's Exam
Stocks retreated on Monday. The Dow fell 1175 points after briefly trading more than 1,500 points lower. The S&P 500 slid 113 points to 2648, with only two stocks in the index finishing higher. The Nasdaq Composite declined 273 points to 6967. Volume totals reported were higher than the prior session totals on the NYSE and on the Nasdaq exchange as the indices clearly endured more worrisome distributional pressure. Decliners led advancers by a decisive 8-1 margin on the NYSE and by 7-1 on the Nasdaq exchange. New 52-week lows totals swelled and outnumbered shrinking new 52-week highs totals on both the NYSE and the Nasdaq exchange. Leadership evaporated as there were 6 high-ranked companies from the Leaders List that made new 52-week highs and were listed on the BreakOuts Page, versus the total of 21 on the prior session. The Featured Stocks Page provides the latest analysis on noteworthy high-ranked leaders. Charts used courtesy of www.stockcharts.com
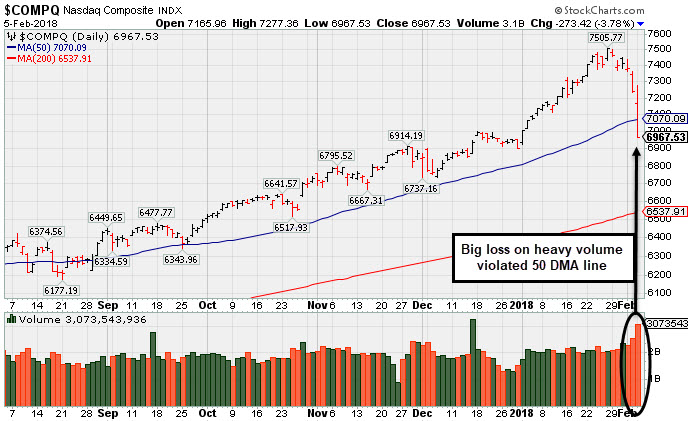 PICTURED: The Nasdaq Composite Index violated its 50-day moving average (DMA) line with Monday's big loss on higher volume. Heavier distributional pressure on the major averages (M criteria) took the recently noted "uptrend under pressure" into a worrisome "correction" warranting much greater caution. During market corrections investors should avoid new buying efforts and raise cash by quickly reacting to technical sell signals from stocks on a case-by-case basis.
The major averages extended last week’s pullback, with Monday’s session representing the steepest percentage decline since 2011 for both the S&P 500 and Dow. The three day decline which started Thursday also left both indices in negative territory for the year, despite strong January gains. The CBOE Volatility Index (VIX) more than doubled on the session to its highest level in more than two years, while perceived “safe haven” assets such as gold and Treasuries rose. The yield on the benchmark 10-year note, which started the session near 2.84%, dipped 11 basis points to 2.73%.
All 11 sectors in the S&P 500 finished firmly lower. Financials led the losses on the session, with every bank in the S&P 500 losing at least 2%. Industrials also lagged, with 2017 high-flyers Boeing (BA -5.74%) and 3M (MMM -5.60%) each losing more than 5%. Energy shares in the S&P 500 lost 4.4% as West Texas Intermediate crude prices slipped 2.6%. The perceived defensive sectors such as Utilities and Real Estate outperformed on a relative basis amid the drop in interest rates.
On the data front, The Institute for Supply Management revealed services activity rose to near the highest level in a decade at 59.9, beating expectations of 56.7. |
 Kenneth J. Gruneisen started out as a licensed stockbroker in August 1987, a couple of months prior to the historic stock market crash that took the Dow Jones Industrial Average down -22.6% in a single day. He has published daily fact-based fundamental and technical analysis on high-ranked stocks online for two decades. Through FACTBASEDINVESTING.COM, Kenneth provides educational articles, news, market commentary, and other information regarding proven investment systems that work in good times and bad.
Comments contained in the body of this report are technical opinions only and are not necessarily those of Gruneisen Growth Corp. The material herein has been obtained from sources believed to be reliable and accurate, however, its accuracy and completeness cannot be guaranteed. Our firm, employees, and customers may effect transactions, including transactions contrary to any recommendation herein, or have positions in the securities mentioned herein or options with respect thereto. Any recommendation contained in this report may not be suitable for all investors and it is not to be deemed an offer or solicitation on our part with respect to the purchase or sale of any securities. |
|
 |
Financial, Retail, Tech, and Commodity-Linked Groups Fell
Kenneth J. Gruneisen - Passed the CAN SLIM® Master's Exam
The Bank Index ($BKX -4.92%), Broker/Dealer Index ($XBD -3.80%) and the Retail Index ($RLX -3.51%) ended solidly lower on Monday. The Semiconductor Index ($SOX -4.72%), Biotechnology Index ($BTK -4.24%), and Networking Index ($NWX -3.59%) ended unanimously lower. The Integrated Oil Index ($XOI -4.27%) and the Oil Services Index ($OSX -4.01%) both fell more than -4%, meanwhile the Gold & Silver Index ($XAU -0.96%) suffered a smaller loss. Charts courtesy wwwstockcharts.com
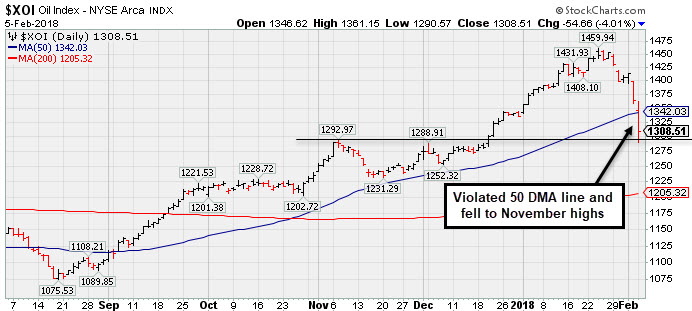 PICTURED: The Integrated Oil Index ($XOI -4.27%) suffered a big loss and violated its 50-day moving average (DMA) line as it fell back to its November highs.
| Oil Services |
$OSX |
144.26 |
-6.43 |
-4.27% |
-3.54% |
| Integrated Oil |
$XOI |
1,308.51 |
-54.66 |
-4.01% |
-2.02% |
| Semiconductor |
$SOX |
1,255.81 |
-62.17 |
-4.72% |
+0.22% |
| Networking |
$NWX |
489.43 |
-18.25 |
-3.59% |
-0.22% |
| Broker/Dealer |
$XBD |
265.84 |
-10.50 |
-3.80% |
+0.23% |
| Retail |
$RLX |
1,884.94 |
-68.53 |
-3.51% |
+8.72% |
| Gold & Silver |
$XAU |
83.07 |
-0.81 |
-0.97% |
-2.58% |
| Bank |
$BKX |
108.77 |
-5.62 |
-4.91% |
+1.93% |
| Biotech |
$BTK |
4,515.20 |
-199.88 |
-4.24% |
+6.94% |
|
|
|
 |
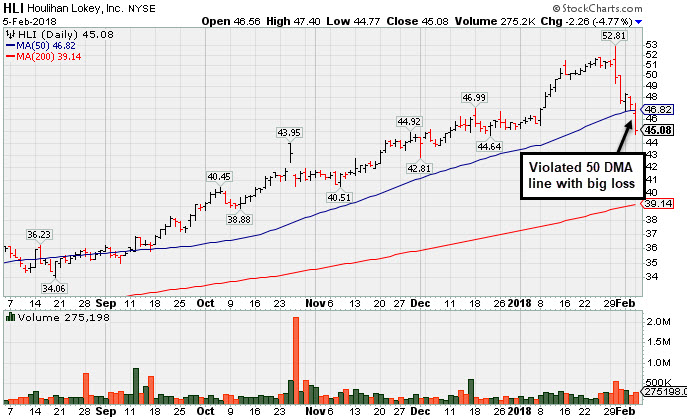
Damaging Violation of 50-Day Moving Average Line
Kenneth J. Gruneisen - Passed the CAN SLIM® Master's Exam
Houlihan Lokey Inc (HLI -$2.26 or -4.77% to $45.08) violated its 50-day moving average DMA line ($43.70) with today's volume-driven loss triggering a technical sell signal. Only a prompt rebound above the 50 DMA line would help its outlook improve. Recently it reported earnings +21% on +5% sales revenues for the Dec '17 quarter, below the +25% minimum earnings guideline (C criteria), raising fundamental concerns. On 10/26/17 it completed a Secondary Offering.
The high ranked Finance - Invest Bank/Broker firm was last shown in this FSU section on 1/03/18 with an annotated graph under the headline, "Tight Weekly Closes Formed Advanced Base Pattern". Annual earnings growth (A criteria) history is a good match with the fact-based investment system's guidelines. It has an Earnings Per share rating of 96.
Its current Up/Down Volume Ratio of 1.4 is an unbiased indication its shares have been under only slight accumulation over the past 50 days.It has a current Timeliness rating of A and a Sponsorship rating of C. The number of top-rated funds owning its shares rose from 165 in Jun '16 to 312 in Dec '17, also a reassuring sign concerning the I criteria. Its small supply of only 26.3 million shares (S criteria) in the public float can contribute to greater price volatility in the event of institutional buying or selling. HLI traded up as much as +39.6% since first highlighted in yellow at $35.85 in the 5/11/17 mid-day report (read here) with pivot point cited based on its 3/31/17 high plus 10 cents after an orderly flat base.
|
|
|
Color Codes Explained :
Y - Better candidates highlighted by our
staff of experts.
G - Previously featured
in past reports as yellow but may no longer be buyable under the
guidelines.
***Last / Change / Volume data in this table is the closing quote data***
Symbol/Exchange
Company Name
Industry Group |
PRICE |
CHANGE
(%Change) |
Day High |
Volume
(% DAV)
(% 50 day avg vol) |
52 Wk Hi
% From Hi |
Featured
Date |
Price
Featured |
Pivot Featured |
|
Max Buy |
ROG
-
NYSE
Rogers Corp
CONSUMER NON-DURABLES - Rubber and Plastics
|
$154.55
|
-6.87
-4.26% |
$160.59
|
166,158
107.20% of 50 DAV
50 DAV is 155,000
|
$184.00
-16.01%
|
12/29/2017
|
$162.92
|
PP = $168.17
|
|
MB = $176.58
|
 Most Recent Note - 2/5/2018 5:21:42 PM
G - Slumped below its 50 DMA line ($163.47) raising concerns and triggering a technical sell signal. Color code is changed to green. Only a prompt rebound above the 50 DMA line would help its outlook improve.
>>> FEATURED STOCK ARTICLE : Stalled After Recent Technical Breakout - 1/30/2018 |
View all notes |
Set NEW NOTE alert |
Company Profile |
SEC
News |
Chart |
Request a new note
C
A
S
I |
TPL
-
NYSE
Texas Pacific Land Trust
FINANCIAL SERVICES - Diversified Investments
|
$500.90
|
-19.27
-3.70% |
$518.70
|
24,209
151.31% of 50 DAV
50 DAV is 16,000
|
$569.99
-12.12%
|
12/21/2017
|
$419.50
|
PP = $435.09
|
|
MB = $456.84
|
Most Recent Note - 2/1/2018 1:25:19 PM
G - Reported earnings +29% on +118% sales revenues for the Dec '17 quarter. Still consolidating near its high after getting very extended from the previously noted base. Its 50 DMA line ($458) defines initial support to watch above prior highs in the $434 area.
>>> FEATURED STOCK ARTICLE : Considerable Gains in First 2-3 Weeks After Recent Breakout - 1/23/2018 |
View all notes |
Set NEW NOTE alert |
Company Profile |
SEC
News |
Chart |
Request a new note
C
A
S
I |
YY
-
NASDAQ
YY Inc
INTERNET - Internet Service Providers
|
$123.88
|
-4.44
-3.46% |
$130.90
|
1,140,730
96.10% of 50 DAV
50 DAV is 1,187,000
|
$142.97
-13.35%
|
12/29/2017
|
$113.06
|
PP = $123.58
|
|
MB = $129.76
|
Most Recent Note - 2/2/2018 5:42:00 PM
G - Consolidating above prior highs in the $123 area and its 50 DMA line ($120.23) defining important support. See the latest FSU analysis for more details and a new annotated graph.
>>> FEATURED STOCK ARTICLE : Retreating After +78% Rally in 5 Months - 2/2/2018 |
View all notes |
Set NEW NOTE alert |
Company Profile |
SEC
News |
Chart |
Request a new note
C
A
S
I |
HTHT
-
NASDAQ
China Lodging Group Ads
LEISURE - Lodging
|
$136.82
|
-4.17
-2.96% |
$145.35
|
495,853
69.64% of 50 DAV
50 DAV is 712,000
|
$166.19
-17.67%
|
12/22/2017
|
$138.07
|
PP = $142.90
|
|
MB = $150.05
|
Most Recent Note - 2/1/2018 5:47:29 PM
G - Fell today with higher (near average) volume, slumping near prior highs in the $142 area defining initial support above the 50 DMA line. Abruptly dipped and briefly undercut its 50 DMA line ($135.49) then promptly rebounded from 1/29/18 session lows.
>>> FEATURED STOCK ARTICLE : Found Support Above Prior High After Latest Breakout - 1/24/2018 |
View all notes |
Set NEW NOTE alert |
Company Profile |
SEC
News |
Chart |
Request a new note
C
A
S
I |
PETS
-
NASDAQ
Petmed Express Inc
RETAIL - Drug Stores
|
$43.92
|
+0.65
1.50% |
$46.27
|
874,818
125.15% of 50 DAV
50 DAV is 699,000
|
$57.80
-24.01%
|
1/19/2018
|
$53.59
|
PP = $51.00
|
|
MB = $53.55
|
Most Recent Note - 1/31/2018 7:07:52 PM
G - Fell to a close just below its 50 DMA line ($45.40) today, slumping further after a "negative reversal" on 1/22/18 following earnings news. Color code is changed to green. Only a prompt rebound above the 50 DMA line would help its outlook improve. Reported earnings +83% on +14% sales revenues, continuing its strong earnings track record.
>>> FEATURED STOCK ARTICLE : Strong Finish Ahead of Earnings News Next Week - 1/19/2018 |
View all notes |
Set NEW NOTE alert |
Company Profile |
SEC
News |
Chart |
Request a new note
C
A
S
I |
Symbol/Exchange
Company Name
Industry Group |
PRICE |
CHANGE
(%Change) |
Day High |
Volume
(% DAV)
(% 50 day avg vol) |
52 Wk Hi
% From Hi |
Featured
Date |
Price
Featured |
Pivot Featured |
|
Max Buy |
ESNT
-
NYSE
Essent Group Ltd
Finance-MrtgandRel Svc
|
$44.85
|
-1.98
-4.23% |
$46.85
|
735,381
114.19% of 50 DAV
50 DAV is 644,000
|
$50.08
-10.44%
|
10/9/2017
|
$39.75
|
PP = $41.54
|
|
MB = $43.62
|
Most Recent Note - 2/5/2018 5:18:42 PM
G - Violated its 50 DMA line ($46.06) with a volume-driven loss today triggering a technical sell signal. Recent low in the $43.00 area defines the next important support to watch. Due to report earnings news before the open on Friday, February 9, 2018.
>>> FEATURED STOCK ARTICLE : Perched Near High After Brief Consolidation Below 50 DMA Line - 1/9/2018 |
View all notes |
Set NEW NOTE alert |
Company Profile |
SEC
News |
Chart |
Request a new note
C
A
S
I |
FIVE
-
NASDAQ
Five Below Inc
Retail-DiscountandVariety
|
$61.94
|
-1.00
-1.59% |
$63.43
|
1,626,351
135.08% of 50 DAV
50 DAV is 1,204,000
|
$73.55
-15.79%
|
1/2/2018
|
$69.16
|
PP = $68.99
|
|
MB = $72.44
|
Most Recent Note - 2/2/2018 5:47:32 PM
G - Slumped further below its 50 DMA line with today's volume driven loss raising concerns and triggering a more worrisome technical sell signal. Only a prompt rebound above the 50 DMA line ($65.81) would help its outlook improve.
>>> FEATURED STOCK ARTICLE : Consolidating After Negating Breakout From Advanced Base - 1/17/2018 |
View all notes |
Set NEW NOTE alert |
Company Profile |
SEC
News |
Chart |
Request a new note
C
A
S
I |
MDXG
-
NASDAQ
MiMedx Group Inc
Medical-Products
|
$15.87
|
-0.26
-1.61% |
$17.20
|
2,452,726
132.87% of 50 DAV
50 DAV is 1,846,000
|
$18.25
-13.04%
|
1/29/2018
|
$17.43
|
PP = $17.57
|
|
MB = $18.45
|
Most Recent Note - 2/5/2018 5:24:55 PM
Y - Fell again today with above average volume amid widespread market weakness. Disciplined investors always limit losses by selling any stock that falls more than -7% from their purchase price.
>>> FEATURED STOCK ARTICLE : Hit a New High With it 6th Consecutive Gain - 1/29/2018 |
View all notes |
Set NEW NOTE alert |
Company Profile |
SEC
News |
Chart |
Request a new note
C
A
S
I |
ANET
-
NYSE
Arista Networks Inc
TELECOMMUNICATIONS - Communication Equipment
|
$265.37
|
-8.11
-2.97% |
$279.89
|
1,213,245
152.42% of 50 DAV
50 DAV is 796,000
|
$284.76
-6.81%
|
1/8/2018
|
$248.88
|
PP = $245.75
|
|
MB = $258.04
|
Most Recent Note - 2/5/2018 5:28:39 PM
G - Finished near the session low with a loss on above average volume. Prior highs in the $245 area define initial support to watch along with its 50 DMA line.
>>> FEATURED STOCK ARTICLE : Consolidating After Getting Extended From its Prior High - 1/31/2018 |
View all notes |
Set NEW NOTE alert |
Company Profile |
SEC
News |
Chart |
Request a new note
C
A
S
I |
PAYC
-
NYSE
Paycom Software Inc
COMPUTER SOFTWARE and SERVICES - Application Software
|
$84.07
|
-4.48
-5.06% |
$88.86
|
1,179,634
203.39% of 50 DAV
50 DAV is 580,000
|
$93.61
-10.19%
|
1/12/2018
|
$87.93
|
PP = $86.20
|
|
MB = $90.51
|
Most Recent Note - 2/5/2018 5:33:47 PM
G - Suffered a big loss today with heavy volume while undercutting prior highs near $86 and testing near its 50 DMA line ($84.15). Due to report its results for the quarter and the year-ended Dec. 31, 2017, after the market closes on Tuesday, February 6th.
>>> FEATURED STOCK ARTICLE : Finished Strong With Big Gain on +118% Above Average Volume - 1/12/2018 |
View all notes |
Set NEW NOTE alert |
Company Profile |
SEC
News |
Chart |
Request a new note
C
A
S
I |
Symbol/Exchange
Company Name
Industry Group |
PRICE |
CHANGE
(%Change) |
Day High |
Volume
(% DAV)
(% 50 day avg vol) |
52 Wk Hi
% From Hi |
Featured
Date |
Price
Featured |
Pivot Featured |
|
Max Buy |
GRUB
-
NYSE
Grubhub Inc
COMPUTER SOFTWARE and SERVICES - Technical and System Software
|
$68.16
|
-2.49
-3.52% |
$70.50
|
2,132,892
165.34% of 50 DAV
50 DAV is 1,290,000
|
$77.99
-12.60%
|
6/21/2017
|
$47.33
|
PP = $46.94
|
|
MB = $49.29
|
Most Recent Note - 2/5/2018 5:13:38 PM
G - Violated its 50 DMA line ($70.67) today with a volume-driven loss triggering a technical sell signal. Only a prompt rebound above the 50 DMA line would help its outlook improve. Due to report its fourth quarter financial results on Thursday, Feb. 8, 2018 before the market open. The 2 latest quarterly comparisons were below the +25% minimum earnings guideline, so fundamental concerns were raised and noted before.
>>> FEATURED STOCK ARTICLE : Prompt Rebound Above 50-Day Moving Average Helped Outlook - 1/11/2018 |
View all notes |
Set NEW NOTE alert |
Company Profile |
SEC
News |
Chart |
Request a new note
C
A
S
I |
PYPL
-
NASDAQ
Paypal Holdings Inc
Finance-CrdtCard/PmtPr
|
$74.71
|
-1.87
-2.44% |
$78.98
|
18,615,041
187.50% of 50 DAV
50 DAV is 9,928,000
|
$86.32
-13.46%
|
2/1/2018
|
$80.35
|
PP = $79.49
|
|
MB = $83.46
|
Most Recent Note - 2/5/2018 5:27:11 PM
G - Slumped below its 50 DMA line with 3 consecutive losses marked by above average volume and its color code is changed to green. Only a prompt rebound above the 50 DMA line ($77.51) would help its outlook improve.
>>> FEATURED STOCK ARTICLE : Gap Down Following Earnings News Tests Important Support Level - 2/1/2018 |
View all notes |
Set NEW NOTE alert |
Company Profile |
SEC
News |
Chart |
Request a new note
C
A
S
I |
OLLI
-
NASDAQ
Ollie's Bargain Outlet
Retail-DiscountandVariety
|
$52.65
|
-1.10
-2.05% |
$54.90
|
530,068
85.91% of 50 DAV
50 DAV is 617,000
|
$58.50
-10.00%
|
11/21/2017
|
$46.78
|
PP = $47.00
|
|
MB = $49.35
|
Most Recent Note - 2/5/2018 5:30:44 PM
G - Slumped near its 50 DMA line ($52.27) today with a 5th consecutive loss. Prior low ($50.15 on 1/04/18) defines the next important near-term support.
>>> FEATURED STOCK ARTICLE : Bargain Outlet Looked Expensive Before +114% Rally in 18 Months - 1/18/2018 |
View all notes |
Set NEW NOTE alert |
Company Profile |
SEC
News |
Chart |
Request a new note
C
A
S
I |
WB
-
NASDAQ
Weibo Corp Cl A Ads
INTERNET - Content
|
$117.51
|
-3.93
-3.24% |
$126.19
|
2,696,891
162.76% of 50 DAV
50 DAV is 1,657,000
|
$136.19
-13.72%
|
1/16/2018
|
$126.33
|
PP = $122.21
|
|
MB = $128.32
|
Most Recent Note - 2/2/2018 1:04:18 PM
G - Pulling back from its all-time high with a gap down today after wedging higher with recent gains lacking great volume conviction. Testing prior highs in the $123 area which define initial support above its 50 DMA line ($115.22).
>>> FEATURED STOCK ARTICLE : Close in Session's Lower Third a Sign of Distributional Pressure - 1/16/2018 |
View all notes |
Set NEW NOTE alert |
Company Profile |
SEC
News |
Chart |
Request a new note
C
A
S
I |
HLI
-
NYSE
Houlihan Lokey Inc Cl A
Finance-Invest Bnk/Bkrs
|
$45.08
|
-2.26
-4.77% |
$47.40
|
273,337
139.46% of 50 DAV
50 DAV is 196,000
|
$52.81
-14.64%
|
1/3/2018
|
$45.88
|
PP = $47.09
|
|
MB = $49.44
|
Most Recent Note - 2/5/2018 5:36:15 PM
G - Violated its 50 DMA line ($46.84) with a volume-driven loss today triggering a technical sell signal. Only a prompt rebound would help its outlook improve. Recently reported earnings +21% on +5% sales revenues for the Dec '17 quarter, below the +25% minimum earnings guideline (C criteria), raising fundamental concerns. On 10/26/17 it completed a Secondary Offering.
>>> FEATURED STOCK ARTICLE : Damaging Violation of 50-Day Moving Average Line - 2/5/2018 |
View all notes |
Set NEW NOTE alert |
Company Profile |
SEC
News |
Chart |
Request a new note
C
A
S
I |
Symbol/Exchange
Company Name
Industry Group |
PRICE |
CHANGE
(%Change) |
Day High |
Volume
(% DAV)
(% 50 day avg vol) |
52 Wk Hi
% From Hi |
Featured
Date |
Price
Featured |
Pivot Featured |
|
Max Buy |
ICHR
-
NASDAQ
Ichor Holdings Ltd
ELECTRONICS - Semiconductor Equipment
|
$26.81
|
-1.69
-5.93% |
$29.55
|
1,635,403
126.97% of 50 DAV
50 DAV is 1,288,000
|
$35.51
-24.50%
|
1/22/2018
|
$34.00
|
PP = $35.61
|
|
MB = $37.39
|
Most Recent Note - 2/5/2018 5:23:55 PM
G - Color code is changed to green after violating its 50 DMA line ($27.50) with a 6th consecutive loss. Only a prompt rebound above the 50 DMA line would help its outlook improve.
>>> FEATURED STOCK ARTICLE : Found Support at 200 Day Average and Rebounded Near Prior High - 1/22/2018 |
View all notes |
Set NEW NOTE alert |
Company Profile |
SEC
News |
Chart |
Request a new note
C
A
S
I |
|
|
|
THESE ARE NOT BUY RECOMMENDATIONS!
Comments contained in the body of this report are technical
opinions only. The material herein has been obtained
from sources believed to be reliable and accurate, however,
its accuracy and completeness cannot be guaranteed.
This site is not an investment advisor, hence it does
not endorse or recommend any securities or other investments.
Any recommendation contained in this report may not
be suitable for all investors and it is not to be deemed
an offer or solicitation on our part with respect to
the purchase or sale of any securities. All trademarks,
service marks and trade names appearing in this report
are the property of their respective owners, and are
likewise used for identification purposes only.
This report is a service available
only to active Paid Premium Members.
You may opt-out of receiving report notifications
at any time. Questions or comments may be submitted
by writing to Premium Membership Services 665 S.E. 10 Street, Suite 201 Deerfield Beach, FL 33441-5634 or by calling 1-800-965-8307
or 954-785-1121.
|
|
|