You are not logged in.
This means you
CAN ONLY VIEW reports that were published prior to Wednesday, March 26, 2025.
You
MUST UPGRADE YOUR MEMBERSHIP if you want to see any current reports.
AFTER MARKET UPDATE - TUESDAY, FEBRUARY 6TH, 2018
Previous After Market Report Next After Market Report >>>
|
|
|
|
DOW |
+567.02 |
24,912.77 |
+2.33% |
|
Volume |
1,447,055,140 |
+9% |
|
Volume |
3,107,282,900 |
+1% |
|
NASDAQ |
+148.35 |
7,115.88 |
+2.13% |
|
Advancers |
2,161 |
71% |
|
Advancers |
1,940 |
65% |
|
S&P 500 |
+46.20 |
2,695.14 |
+1.74% |
|
Decliners |
865 |
29% |
|
Decliners |
1,062 |
35% |
|
Russell 2000 |
+16.08 |
1,507.17 |
+1.08% |
|
52 Wk Highs |
10 |
|
|
52 Wk Highs |
23 |
|
|
S&P 600 |
+9.67 |
918.41 |
+1.06% |
|
52 Wk Lows |
476 |
|
|
52 Wk Lows |
233 |
|
|
 |
Indices Rose From Early Lows With Elusive Leadership
Kenneth J. Gruneisen - Passed the CAN SLIM® Master's Exam
Stocks recovered from early morning losses Tuesday amid a choppy session. The Dow traded in a 1200 point range before finishing up 567 points to 24912. The S&P 500 added 42 points to 2691. The Nasdaq Composite gained 148 points to 7115. Volume totals reported were higher than the prior session totals on the NYSE and on the Nasdaq exchange. Advancers led decliners by more than a 2-1 margin on the NYSE and by nearly 2-1 on the Nasdaq exchange. New 52-week lows totals swelled and solidly outnumbered new 52-week highs totals on both the NYSE and the Nasdaq exchange. Leadership evaporated as there was only 1 high-ranked company from the Leaders List that made a new 52-week high and was listed on the BreakOuts Page, versus the total of 6 on the prior session. The Featured Stocks Page provides the latest analysis on noteworthy high-ranked leaders. Charts used courtesy of www.stockcharts.com
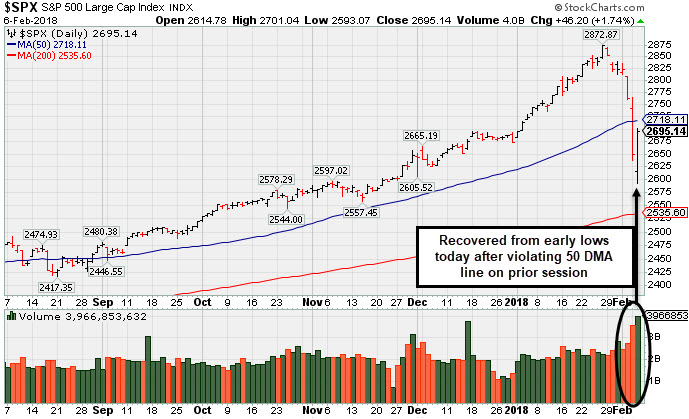 PICTURED: The S&P 500 Index rebounded from early lows to post a gain on higher volume. It violated its 50-day moving average (DMA) line with Monday's big loss on higher volume. Heavier distributional pressure on the major averages (M criteria) took the recently noted "uptrend under pressure" into a worrisome "correction" warranting much greater caution. During market corrections investors should avoid new buying efforts and raise cash by quickly reacting to technical sell signals from stocks on a case-by-case basis.
U.S. equities finished firmly higher after a whirlwind session. Stocks opened lower, with the Dow losing as much as 567 points before a mid-session rebound. By the close of trading, all three major averages moved back into positive territory for the year. Trading volume on the S&P 500 was 70% above its 30-day moving average. The CBOE Volatility Index (VIX), which notched a record increase on Monday, retreated 20% on Tuesday.
Nine of 11 S&P 500 sectors finished higher as Technology and Materials paced gains. Apple (AAPL +4.22%) and DowDuPont (DWDP +5.97%) rose. Consumer Discretionary also outperformed as General Motors (GM +5.87%) rose after the automaker topped earnings projections. Industrials and Financials also rebounded from the recent selloff as each group added over 1.0% on the session.
Treasuries were little changed with the yield on the 10-year note finishing near the flat line at 2.79%. In commodities, NYMEX WTI crude lost 1.0% to $63.54/barrel. COMEX gold declined 0.9% to $1324.40/ounce amid a stronger dollar.
On the data front, a report showed the U.S. trade deficit widened to $53.1 billion in December to its largest level since the financial crisis in 2008. |
 Kenneth J. Gruneisen started out as a licensed stockbroker in August 1987, a couple of months prior to the historic stock market crash that took the Dow Jones Industrial Average down -22.6% in a single day. He has published daily fact-based fundamental and technical analysis on high-ranked stocks online for two decades. Through FACTBASEDINVESTING.COM, Kenneth provides educational articles, news, market commentary, and other information regarding proven investment systems that work in good times and bad.
Comments contained in the body of this report are technical opinions only and are not necessarily those of Gruneisen Growth Corp. The material herein has been obtained from sources believed to be reliable and accurate, however, its accuracy and completeness cannot be guaranteed. Our firm, employees, and customers may effect transactions, including transactions contrary to any recommendation herein, or have positions in the securities mentioned herein or options with respect thereto. Any recommendation contained in this report may not be suitable for all investors and it is not to be deemed an offer or solicitation on our part with respect to the purchase or sale of any securities. |
|
 |
Retail, Tech, and Financial Groups Led Rebound
Kenneth J. Gruneisen - Passed the CAN SLIM® Master's Exam
The Retail Index ($RLX +3.33%) outpaced the Bank Index ($BKX +1.70%) and the Broker/Dealer Index ($XBD +2.52%) as the market rebounded on Tuesday. The Semiconductor Index ($SOX +3.65%), Biotechnology Index ($BTK +1.86%), and Networking Index ($NWX +2.57%) ended unanimously higher. The Integrated Oil Index ($XOI +1.25%) and the Oil Services Index ($OSX +1.68%) both posted gains, meanwhile the Gold & Silver Index ($XAU -1.17%) suffered another loss. Charts courtesy wwwstockcharts.com
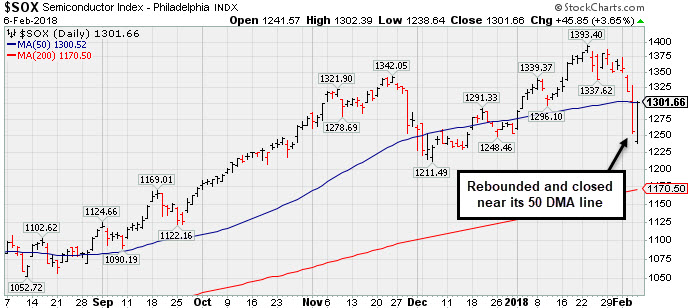 PICTURED: The Semiconductor Index ($SOX +3.65%) rebounded and closed near its 50-day moving average (DMA) line after slumping toward its December low.
| Oil Services |
$OSX |
146.68 |
+2.42 |
+1.68% |
-1.92% |
| Integrated Oil |
$XOI |
1,324.89 |
+16.38 |
+1.25% |
-0.80% |
| Semiconductor |
$SOX |
1,301.66 |
+45.85 |
+3.65% |
+3.88% |
| Networking |
$NWX |
502.01 |
+12.58 |
+2.57% |
+2.34% |
| Broker/Dealer |
$XBD |
272.54 |
+6.70 |
+2.52% |
+2.75% |
| Retail |
$RLX |
1,947.70 |
+62.76 |
+3.33% |
+12.34% |
| Gold & Silver |
$XAU |
82.10 |
-0.97 |
-1.17% |
-3.72% |
| Bank |
$BKX |
110.61 |
+1.84 |
+1.69% |
+3.65% |
| Biotech |
$BTK |
4,599.01 |
+83.81 |
+1.86% |
+8.92% |
|
|
|
 |
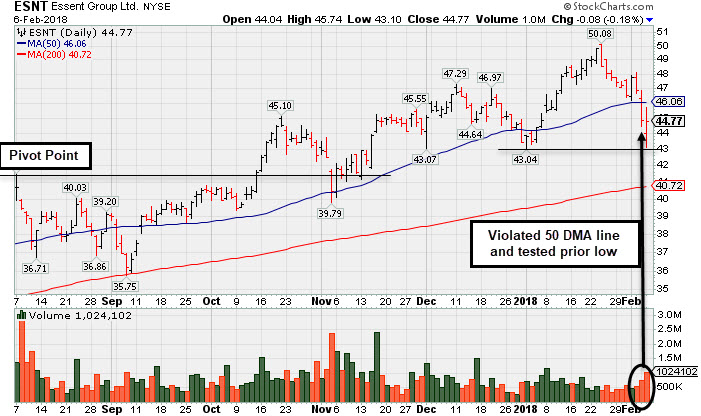
Slumped Below 50-Day Average With Earnings News Due Friday
Kenneth J. Gruneisen - Passed the CAN SLIM® Master's Exam
Essent Group Ltd (ESNT -$0.08 or -0.18% to $44.77) rebounded from earlier lows to finish the session little changed. It violated its 50 DMA line ($46.06) with a big loss on the prior session triggering a technical sell signal. Today it tested near the recent low in the $43.00 area defining important support to watch. More damaging losses would raise greater concerns, meanwhile a rebound above the 50 DMA line is needed for its outlook to improve. Keep in mind that it is due to report earnings news before the open on Friday, February 9, 2018. Volume and volatility often increase near earnings news.
Fundamentals remain strong. It currently has a Timeliness rating of A and a Sponsorship rating of C. The high-ranked Finance-Mrtg and Rel Svc firm's quarterly earnings have been above the +25% minimum guideline (C criteria) and sales revenues increases in comparisons through Sep '17 have been strong. Its annual earnings (A criteria) history has been good since its $17 IPO on 10/31/13.
Essent has traded up as much as +46.9% since first highlighted in yellow with pivot point cited based on its 12/12/16 high plus 10 cents in the 1/25/17 mid-day report (read here). The number of top-rated funds owning its shares rose from 317 in Mar '16 to 541 in Dec '17, a reassuring sign concerning the I criteria. Its current Up/Down Volume ratio of 1.6 is an unbiased indication its shares have been under accumulation over the past 50 days. |
|
|
Color Codes Explained :
Y - Better candidates highlighted by our
staff of experts.
G - Previously featured
in past reports as yellow but may no longer be buyable under the
guidelines.
***Last / Change / Volume data in this table is the closing quote data***
Symbol/Exchange
Company Name
Industry Group |
PRICE |
CHANGE
(%Change) |
Day High |
Volume
(% DAV)
(% 50 day avg vol) |
52 Wk Hi
% From Hi |
Featured
Date |
Price
Featured |
Pivot Featured |
|
Max Buy |
ROG
-
NYSE
Rogers Corp
CONSUMER NON-DURABLES - Rubber and Plastics
|
$151.55
|
-3.00
-1.94% |
$154.72
|
275,924
178.02% of 50 DAV
50 DAV is 155,000
|
$184.00
-17.64%
|
12/29/2017
|
$162.92
|
PP = $168.17
|
|
MB = $176.58
|
 Most Recent Note - 2/6/2018 5:29:54 PM
G - Slumped further below its 50 DMA line ($163.24) today with higher volume after recent losses raised concerns and triggered a technical sell signal. Only a prompt rebound above the 50 DMA line would help its outlook improve.
>>> FEATURED STOCK ARTICLE : Stalled After Recent Technical Breakout - 1/30/2018 |
View all notes |
Set NEW NOTE alert |
Company Profile |
SEC
News |
Chart |
Request a new note
C
A
S
I |
TPL
-
NYSE
Texas Pacific Land Trust
FINANCIAL SERVICES - Diversified Investments
|
$501.13
|
+0.23
0.05% |
$507.49
|
17,282
101.66% of 50 DAV
50 DAV is 17,000
|
$569.99
-12.08%
|
12/21/2017
|
$419.50
|
PP = $435.09
|
|
MB = $456.84
|
Most Recent Note - 2/6/2018 5:30:56 PM
G - Reported earnings +29% on +118% sales revenues for the Dec '17 quarter. Consolidating after getting very extended from the previously noted base. Its 50 DMA line ($464) defines initial support to watch above prior highs in the $434 area.
>>> FEATURED STOCK ARTICLE : Considerable Gains in First 2-3 Weeks After Recent Breakout - 1/23/2018 |
View all notes |
Set NEW NOTE alert |
Company Profile |
SEC
News |
Chart |
Request a new note
C
A
S
I |
YY
-
NASDAQ
YY Inc
INTERNET - Internet Service Providers
|
$122.18
|
-1.70
-1.37% |
$125.27
|
1,888,532
162.80% of 50 DAV
50 DAV is 1,160,000
|
$142.97
-14.54%
|
12/29/2017
|
$113.06
|
PP = $123.58
|
|
MB = $129.76
|
Most Recent Note - 2/6/2018 5:34:18 PM
G - Today's 3rd consecutive loss had it slumping below prior highs in the $123 area and testing near its 50 DMA line ($120.34) defining important support.
>>> FEATURED STOCK ARTICLE : Retreating After +78% Rally in 5 Months - 2/2/2018 |
View all notes |
Set NEW NOTE alert |
Company Profile |
SEC
News |
Chart |
Request a new note
C
A
S
I |
HTHT
-
NASDAQ
China Lodging Group Ads
LEISURE - Lodging
|
$137.21
|
+0.39
0.29% |
$137.63
|
416,548
58.34% of 50 DAV
50 DAV is 714,000
|
$166.19
-17.44%
|
12/22/2017
|
$138.07
|
PP = $142.90
|
|
MB = $150.05
|
Most Recent Note - 2/6/2018 5:16:45 PM
G - Recently undercut prior highs in the $142 area and it has been sputtering near its 50 DMA line ($137.72). More damaging losses would raise greater concerns.
>>> FEATURED STOCK ARTICLE : Found Support Above Prior High After Latest Breakout - 1/24/2018 |
View all notes |
Set NEW NOTE alert |
Company Profile |
SEC
News |
Chart |
Request a new note
C
A
S
I |
PETS
-
NASDAQ
Petmed Express Inc
RETAIL - Drug Stores
|
$44.69
|
+0.77
1.75% |
$45.36
|
659,081
92.83% of 50 DAV
50 DAV is 710,000
|
$57.80
-22.68%
|
1/19/2018
|
$53.59
|
PP = $51.00
|
|
MB = $53.55
|
Most Recent Note - 2/6/2018 5:26:40 PM
G - Still sputtering below its 50 DMA line ($45.77). Only a prompt rebound above the 50 DMA line would help its outlook improve. Recently reported earnings +83% on +14% sales revenues, continuing its strong earnings track record.
>>> FEATURED STOCK ARTICLE : Strong Finish Ahead of Earnings News Next Week - 1/19/2018 |
View all notes |
Set NEW NOTE alert |
Company Profile |
SEC
News |
Chart |
Request a new note
C
A
S
I |
Symbol/Exchange
Company Name
Industry Group |
PRICE |
CHANGE
(%Change) |
Day High |
Volume
(% DAV)
(% 50 day avg vol) |
52 Wk Hi
% From Hi |
Featured
Date |
Price
Featured |
Pivot Featured |
|
Max Buy |
ESNT
-
NYSE
Essent Group Ltd
Finance-MrtgandRel Svc
|
$44.77
|
-0.08
-0.18% |
$45.74
|
1,022,802
157.35% of 50 DAV
50 DAV is 650,000
|
$50.08
-10.60%
|
10/9/2017
|
$39.75
|
PP = $41.54
|
|
MB = $43.62
|
Most Recent Note - 2/6/2018 5:08:58 PM
G - Tested near the recent low in the $43.00 area which defines the next important support to watch. Violated its 50 DMA line ($46.06) with a volume-driven loss on the prior session triggering a technical sell signal. Due to report earnings news before the open on Friday, February 9, 2018. See the latest FSU analysis for more details and a new annotated graph.
>>> FEATURED STOCK ARTICLE : Slumped Below 50-Day Average With Earnings News Due Friday - 2/6/2018 |
View all notes |
Set NEW NOTE alert |
Company Profile |
SEC
News |
Chart |
Request a new note
C
A
S
I |
FIVE
-
NASDAQ
Five Below Inc
Retail-DiscountandVariety
|
$63.64
|
+1.70
2.74% |
$64.00
|
1,174,830
97.09% of 50 DAV
50 DAV is 1,210,000
|
$73.55
-13.47%
|
1/2/2018
|
$69.16
|
PP = $68.99
|
|
MB = $72.44
|
Most Recent Note - 2/6/2018 5:10:26 PM
G - Posted a gain today with near average volume and closed near the session high. Only a prompt rebound above the 50 DMA line ($65.95) would help its outlook improve.
>>> FEATURED STOCK ARTICLE : Consolidating After Negating Breakout From Advanced Base - 1/17/2018 |
View all notes |
Set NEW NOTE alert |
Company Profile |
SEC
News |
Chart |
Request a new note
C
A
S
I |
MDXG
-
NASDAQ
MiMedx Group Inc
Medical-Products
|
$17.07
|
+1.20
7.56% |
$17.21
|
2,028,756
111.23% of 50 DAV
50 DAV is 1,824,000
|
$18.25
-6.47%
|
1/29/2018
|
$17.43
|
PP = $17.57
|
|
MB = $18.45
|
Most Recent Note - 2/6/2018 5:21:02 PM
Y - Posted a big gain today with near average volume and closed near the session high. Disciplined investors always limit losses by selling any stock that falls more than -7% from their purchase price.
>>> FEATURED STOCK ARTICLE : Hit a New High With it 6th Consecutive Gain - 1/29/2018 |
View all notes |
Set NEW NOTE alert |
Company Profile |
SEC
News |
Chart |
Request a new note
C
A
S
I |
ANET
-
NYSE
Arista Networks Inc
TELECOMMUNICATIONS - Communication Equipment
|
$272.38
|
+7.01
2.64% |
$274.31
|
1,001,945
125.09% of 50 DAV
50 DAV is 801,000
|
$284.76
-4.35%
|
1/8/2018
|
$248.88
|
PP = $245.75
|
|
MB = $258.04
|
Most Recent Note - 2/6/2018 5:07:21 PM
G - Managed a "positive reversal" for a gain today backed by +25% above average volume. Prior highs in the $245 area define initial support to watch along with its 50 DMA line.
>>> FEATURED STOCK ARTICLE : Consolidating After Getting Extended From its Prior High - 1/31/2018 |
View all notes |
Set NEW NOTE alert |
Company Profile |
SEC
News |
Chart |
Request a new note
C
A
S
I |
PAYC
-
NYSE
Paycom Software Inc
COMPUTER SOFTWARE and SERVICES - Application Software
|
$86.61
|
+2.54
3.02% |
$87.44
|
1,433,582
245.48% of 50 DAV
50 DAV is 584,000
|
$93.61
-7.48%
|
1/12/2018
|
$87.93
|
PP = $86.20
|
|
MB = $90.51
|
Most Recent Note - 2/6/2018 5:25:09 PM
G - Undercut its 50 DMA line ($84.19) today then managed a "positive reversal" for a gain on higher volume. Reported Dec '17 quarterly earnings +61% on +30% sales revenues after the close, continuing its strong earnings track record.
>>> FEATURED STOCK ARTICLE : Finished Strong With Big Gain on +118% Above Average Volume - 1/12/2018 |
View all notes |
Set NEW NOTE alert |
Company Profile |
SEC
News |
Chart |
Request a new note
C
A
S
I |
Symbol/Exchange
Company Name
Industry Group |
PRICE |
CHANGE
(%Change) |
Day High |
Volume
(% DAV)
(% 50 day avg vol) |
52 Wk Hi
% From Hi |
Featured
Date |
Price
Featured |
Pivot Featured |
|
Max Buy |
GRUB
-
NYSE
Grubhub Inc
COMPUTER SOFTWARE and SERVICES - Technical and System Software
|
$68.90
|
+0.74
1.09% |
$69.43
|
1,941,744
147.89% of 50 DAV
50 DAV is 1,313,000
|
$77.99
-11.65%
|
6/21/2017
|
$47.33
|
PP = $46.94
|
|
MB = $49.29
|
Most Recent Note - 2/6/2018 5:12:45 PM
G - Undercut the prior low ($66.28 on 1/10/18) and managed a "positive reversal" today. Only a prompt rebound above the 50 DMA line ($70.69) would help its outlook improve. Due to report its fourth quarter financial results on Thursday, Feb. 8, 2018 before the market open. Volume and volatility often increase near earnings news.
>>> FEATURED STOCK ARTICLE : Prompt Rebound Above 50-Day Moving Average Helped Outlook - 1/11/2018 |
View all notes |
Set NEW NOTE alert |
Company Profile |
SEC
News |
Chart |
Request a new note
C
A
S
I |
PYPL
-
NASDAQ
Paypal Holdings Inc
Finance-CrdtCard/PmtPr
|
$75.68
|
+0.98
1.31% |
$76.52
|
19,318,834
191.31% of 50 DAV
50 DAV is 10,098,000
|
$86.32
-12.33%
|
2/1/2018
|
$80.35
|
PP = $79.49
|
|
MB = $83.46
|
Most Recent Note - 2/6/2018 5:28:00 PM
G - Posted a small gain today, but remains below its 50 DMA line after 3 consecutive losses marked by above average volume. Only a prompt rebound above the 50 DMA line ($77.47) would help its outlook improve.
>>> FEATURED STOCK ARTICLE : Gap Down Following Earnings News Tests Important Support Level - 2/1/2018 |
View all notes |
Set NEW NOTE alert |
Company Profile |
SEC
News |
Chart |
Request a new note
C
A
S
I |
OLLI
-
NASDAQ
Ollie's Bargain Outlet
Retail-DiscountandVariety
|
$55.25
|
+2.60
4.94% |
$55.70
|
755,654
123.88% of 50 DAV
50 DAV is 610,000
|
$58.50
-5.56%
|
11/21/2017
|
$46.78
|
PP = $47.00
|
|
MB = $49.35
|
Most Recent Note - 2/6/2018 5:22:24 PM
G - Slumped below its 50 DMA line ($52.43) today then managed a "positive reversal" for a gain with above average volume. Prior low ($50.15 on 1/04/18) defines the next important near-term support.
>>> FEATURED STOCK ARTICLE : Bargain Outlet Looked Expensive Before +114% Rally in 18 Months - 1/18/2018 |
View all notes |
Set NEW NOTE alert |
Company Profile |
SEC
News |
Chart |
Request a new note
C
A
S
I |
WB
-
NASDAQ
Weibo Corp Cl A Ads
INTERNET - Content
|
$118.31
|
+0.80
0.68% |
$120.82
|
3,028,967
180.73% of 50 DAV
50 DAV is 1,676,000
|
$136.19
-13.13%
|
1/16/2018
|
$126.33
|
PP = $122.21
|
|
MB = $128.32
|
Most Recent Note - 2/6/2018 5:32:51 PM
G - Slumped below prior highs in the $123 area raising concerns with volume-driven losses. Testing support at its 50 DMA line ($115.13).
>>> FEATURED STOCK ARTICLE : Close in Session's Lower Third a Sign of Distributional Pressure - 1/16/2018 |
View all notes |
Set NEW NOTE alert |
Company Profile |
SEC
News |
Chart |
Request a new note
C
A
S
I |
HLI
-
NYSE
Houlihan Lokey Inc Cl A
Finance-Invest Bnk/Bkrs
|
$45.71
|
+0.63
1.40% |
$45.84
|
391,494
196.73% of 50 DAV
50 DAV is 199,000
|
$52.81
-13.44%
|
1/3/2018
|
$45.88
|
PP = $47.09
|
|
MB = $49.44
|
Most Recent Note - 2/6/2018 5:14:22 PM
G - Managed a "positive reversal" today for a gain with higher volume. Only a prompt rebound above the 50 DMA line ($46.87) would help its outlook improve. Recently reported earnings +21% on +5% sales revenues for the Dec '17 quarter, below the +25% minimum earnings guideline (C criteria), raising fundamental concerns. On 10/26/17 it completed a Secondary Offering.
>>> FEATURED STOCK ARTICLE : Damaging Violation of 50-Day Moving Average Line - 2/5/2018 |
View all notes |
Set NEW NOTE alert |
Company Profile |
SEC
News |
Chart |
Request a new note
C
A
S
I |
Symbol/Exchange
Company Name
Industry Group |
PRICE |
CHANGE
(%Change) |
Day High |
Volume
(% DAV)
(% 50 day avg vol) |
52 Wk Hi
% From Hi |
Featured
Date |
Price
Featured |
Pivot Featured |
|
Max Buy |
ICHR
-
NASDAQ
Ichor Holdings Ltd
ELECTRONICS - Semiconductor Equipment
|
$27.93
|
+1.12
4.18% |
$27.95
|
1,813,813
140.93% of 50 DAV
50 DAV is 1,287,000
|
$35.51
-21.35%
|
1/22/2018
|
$34.00
|
PP = $35.61
|
|
MB = $37.39
|
Most Recent Note - 2/6/2018 5:19:40 PM
G - Managed a "positive reversal" to close back above its 50 DMA line ($27.46) with today's gain breaking a streak of 6 consecutive losses. The prompt rebound above the 50 DMA line helped its outlook improve. Still faces near-term resistance due to overhead supply up through the $35 level.
>>> FEATURED STOCK ARTICLE : Found Support at 200 Day Average and Rebounded Near Prior High - 1/22/2018 |
View all notes |
Set NEW NOTE alert |
Company Profile |
SEC
News |
Chart |
Request a new note
C
A
S
I |
|
|
|
THESE ARE NOT BUY RECOMMENDATIONS!
Comments contained in the body of this report are technical
opinions only. The material herein has been obtained
from sources believed to be reliable and accurate, however,
its accuracy and completeness cannot be guaranteed.
This site is not an investment advisor, hence it does
not endorse or recommend any securities or other investments.
Any recommendation contained in this report may not
be suitable for all investors and it is not to be deemed
an offer or solicitation on our part with respect to
the purchase or sale of any securities. All trademarks,
service marks and trade names appearing in this report
are the property of their respective owners, and are
likewise used for identification purposes only.
This report is a service available
only to active Paid Premium Members.
You may opt-out of receiving report notifications
at any time. Questions or comments may be submitted
by writing to Premium Membership Services 665 S.E. 10 Street, Suite 201 Deerfield Beach, FL 33441-5634 or by calling 1-800-965-8307
or 954-785-1121.
|
|
|