You are not logged in.
This means you
CAN ONLY VIEW reports that were published prior to Thursday, March 20, 2025.
You
MUST UPGRADE YOUR MEMBERSHIP if you want to see any current reports.
AFTER MARKET UPDATE - MONDAY, DECEMBER 4TH, 2017
Previous After Market Report Next After Market Report >>>
|
|
|
|
DOW |
+58.46 |
24,290.05 |
+0.24% |
|
Volume |
987,246,310 |
+2% |
|
Volume |
2,439,151,360 |
+6% |
|
NASDAQ |
-72.22 |
6,775.37 |
-1.05% |
|
Advancers |
1,497 |
51% |
|
Advancers |
1,060 |
48% |
|
S&P 500 |
-2.78 |
2,639.44 |
-0.11% |
|
Decliners |
1,454 |
49% |
|
Decliners |
1,160 |
52% |
|
Russell 2000 |
-4.61 |
1,532.41 |
-0.30% |
|
52 Wk Highs |
292 |
|
|
52 Wk Highs |
292 |
|
|
S&P 600 |
+0.70 |
938.01 |
+0.07% |
|
52 Wk Lows |
28 |
|
|
52 Wk Lows |
40 |
|
|
 |
Indices Ended Mixed After Erasing Much of Early Session Gains
Kenneth J. Gruneisen - Passed the CAN SLIM® Master's Exam
Stocks were mixed Monday. The Dow was up 58 points to a record high of 24290. The S&P 500 lost 2 points to 2639 and the Nasdaq Composite fell 72 points to 6775. Volume totals reported were higher than the prior session totals on the NYSE and on the Nasdaq exchange. Advancers led decliners by a very narrow margin on the NYSE while decliners led advancers by an 11-10 margin on the Nasdaq exchange. There were 106 high-ranked companies from the Leaders List that made new 52-week highs and were listed on the BreakOuts Page, versus the total of 41 on the prior session. New 52-week highs totals expanded and solidly outnumbered new 52-week lows on both the NYSE and the Nasdaq exchange. The Featured Stocks Page provides the latest analysis on noteworthy high-ranked leaders. Charts used courtesy of www.stockcharts.com
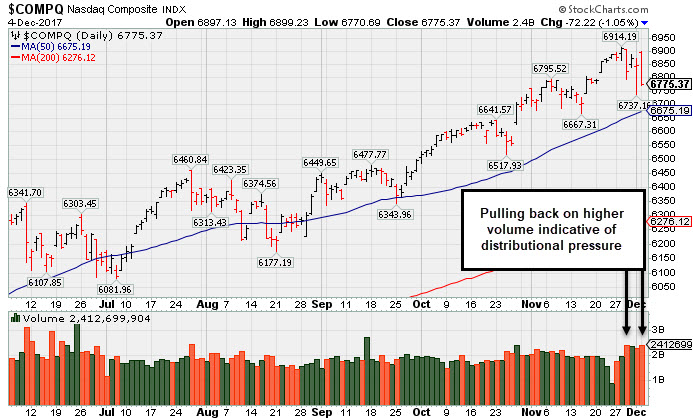 PICTURED: The Nasdaq Composite Index pulled back on Monday with higher volume. Recent losses on higher volume are indicative of distributional pressure.
The major averages (M criteria) are in a confirmed uptrend. Investors should only consider stocks meeting all key criteria of the fact-based investment system as they trigger technical buy signals.
The major averages fluctuated as investors moved into sectors expected to benefit the most from the potential reduction in the corporate tax rate. On the economic front, a report from the Commerce Department showed factory orders declined by 0.1% in October versus a revised 1.7% increase in September. A separate release revealed durable goods orders fell 0.8% in October, below consensus estimates of a 1.2% decline.
Six of 11 S&P 500 sectors were higher. Financials and Industrials paced gains, as these sectors are expected to be the main benefactors of the proposed tax reform. Shares of Bank of America (BAC +3.42%) and Boeing (BA +2.43%) rose. Technology stocks underperformed as Nvidia (NVDA -5.57%) and Microsoft (MSFT -3.77%) fell. Media companies were active in today’s session, as CBS Corp (CBS +5.24%) rose. In M&A news, Disney (DIS +4.72%) rose on reports it’s close to acquiring Twenty-First Century Fox’s (FOX +2.67%) movie and TV studio assets.
Treasury prices were slightly lower, sending the yield of the 10-year note up one basis point to 2.37%. In commodities, NYMEX WTI crude fell 1.6% to $57.40/barrel. COMEX gold lost 0.3% to $1278.80/ounce amid a stronger dollar. |
 Kenneth J. Gruneisen started out as a licensed stockbroker in August 1987, a couple of months prior to the historic stock market crash that took the Dow Jones Industrial Average down -22.6% in a single day. He has published daily fact-based fundamental and technical analysis on high-ranked stocks online for two decades. Through FACTBASEDINVESTING.COM, Kenneth provides educational articles, news, market commentary, and other information regarding proven investment systems that work in good times and bad.
Comments contained in the body of this report are technical opinions only and are not necessarily those of Gruneisen Growth Corp. The material herein has been obtained from sources believed to be reliable and accurate, however, its accuracy and completeness cannot be guaranteed. Our firm, employees, and customers may effect transactions, including transactions contrary to any recommendation herein, or have positions in the securities mentioned herein or options with respect thereto. Any recommendation contained in this report may not be suitable for all investors and it is not to be deemed an offer or solicitation on our part with respect to the purchase or sale of any securities. |
|
 |
Financial Groups Rose; Tech and Commodity-Linked Groups Fell
Kenneth J. Gruneisen - Passed the CAN SLIM® Master's Exam
The Bank Index ($BKX +2.06%) and the Broker/Dealer Index ($XBD +1.49) rose while the Retail Index ($RLX +0.06%) finished flat on Monday. The tech sector was led lower by the Semiconductor Index ($SOX -2.45%) while the Biotechnology Index ($BTK -1.99%) and the Networking Index ($NWX -1.33%) also fell. Commodity-linked groups also had a negative bias as the Gold & Silver Index ($XAU -1.16%) outpaced both the Oil Services Index ($OSX -0.17%) and Integrated Oil Index ($XOI -0.23%) to the downside. Charts courtesy www.stockcharts.com
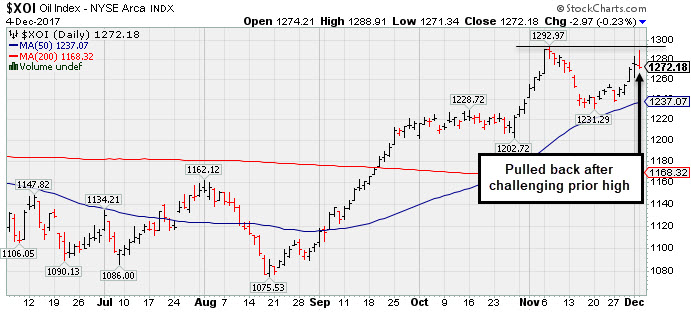 PICTURED: The Integrated Oil Index ($XOI -0.23%) pulled back after the session's early gains challenged the prior high.
| Oil Services |
$OSX |
137.66 |
-0.24 |
-0.17% |
-25.10% |
| Integrated Oil |
$XOI |
1,272.18 |
-2.97 |
-0.23% |
+0.33% |
| Semiconductor |
$SOX |
1,227.85 |
-30.80 |
-2.45% |
+35.45% |
| Networking |
$NWX |
487.15 |
-6.58 |
-1.33% |
+9.20% |
| Broker/Dealer |
$XBD |
263.62 |
+3.88 |
+1.49% |
+28.42% |
| Retail |
$RLX |
1,689.34 |
+0.94 |
+0.06% |
+25.79% |
| Gold & Silver |
$XAU |
78.73 |
-0.93 |
-1.17% |
-0.16% |
| Bank |
$BKX |
106.84 |
+2.16 |
+2.06% |
+16.40% |
| Biotech |
$BTK |
4,171.40 |
-84.50 |
-1.99% |
+35.65% |
|
|
|
 |
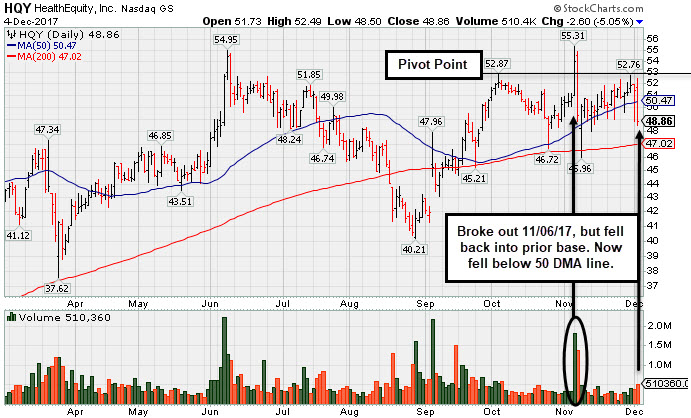
Sank Below 50-Day Moving Average With Loss on Higher Volume
Kenneth J. Gruneisen - Passed the CAN SLIM® Master's Exam
Healthequity Inc (HQY -$2.60 or -5.05% to $48.86) slumped below its 50-day moving average (DMA) line ($50.47) with today's big loss on higher volume. An abrupt retreat back into the prior base raised concerns after a recent breakout. Disciplined investors always limit losses by selling any stock that falls more than -7% from their purchase price.
HQY was shown in this FSU section on 11/06/17 with an annotated graph under the headline, "Hit New High With Big Volume-Driven Gain". It was highlighted in yellow with new pivot point cited based on its 10/04/17 high in the 11/06/17 mid-day report (read here). It hit a new high with a considerable volume-driven gain triggering a technical buy signal.
Fundamentals remain strong as three of the past 4 quarterly comparisons through Jul '17 were above the +25% minimum earnings guideline (C criteria) and underpinned by strong sales revenues increases.
The number of top-rated funds owning its shares rose from 369 in Dec '16 to 442 in Sep '17, a reassuring sign concerning the I criteria. Its current Up/Down Volume Ratio of 1.2 is also an unbiased indication its shares have been under slight accumulation over the past 50 days. It has a fairly small supply of only 48.6 million shares (S criteria) outstanding, which can contribute to greater price volatility in the event of institutional buying or selling. It currently has a Timeliness Rating of B and a Sponsorship Rating of B.
The Commercial Services - Outsourcing industry group currently has a Group Relative Strength Rating of 69, however there are other strong leaders in the group hitting new highs, a reassuring sign concerning the L criteria. It completed its $14 IPO on 7/31/14 followed by an additional Public Offering on 5/05/15 and Secondary Offerings on both 10/20/16 and 9/23/15. |
|
|
Color Codes Explained :
Y - Better candidates highlighted by our
staff of experts.
G - Previously featured
in past reports as yellow but may no longer be buyable under the
guidelines.
***Last / Change / Volume data in this table is the closing quote data***
Symbol/Exchange
Company Name
Industry Group |
PRICE |
CHANGE
(%Change) |
Day High |
Volume
(% DAV)
(% 50 day avg vol) |
52 Wk Hi
% From Hi |
Featured
Date |
Price
Featured |
Pivot Featured |
|
Max Buy |
THO
-
NYSE
Thor Industries Inc
AUTOMOTIVE - Recreational Vehicles
|
$148.67
|
-2.92
-1.93% |
$154.64
|
848,188
109.87% of 50 DAV
50 DAV is 772,000
|
$156.86
-5.22%
|
8/14/2017
|
$106.67
|
PP = $110.01
|
|
MB = $115.51
|
 Most Recent Note - 12/4/2017 5:57:23 PM
G - Pulled back for a 3rd consecutive loss on average volume, retreating from its all-time high. It is extended from its prior base. Its 50 DMA line ($132.75) and recent low ($127.29 on 11/08/17) define near-term support to watch. Reported earnings +63% on +31% sales revenues for the Oct '17 quarter, continuing its strong earnings track record.
>>> FEATURED STOCK ARTICLE : Encountered Distributional Pressure After Getting Extended From Base - 11/10/2017 |
View all notes |
Set NEW NOTE alert |
Company Profile |
SEC
News |
Chart |
Request a new note
C
A
S
I |
PFBC
-
NASDAQ
Preferred Bank Los Angls
BANKING - Regional - Pacific Banks
|
$65.95
|
+2.62
4.14% |
$66.14
|
186,806
236.46% of 50 DAV
50 DAV is 79,000
|
$66.58
-0.95%
|
10/10/2017
|
$59.38
|
PP = $59.08
|
|
MB = $62.03
|
Most Recent Note - 12/4/2017 12:25:29 PM
G - Challenging its prior high with today's gap up gain. Found prompt support at its 50 DMA line ($60.17) during its recent consolidation.
>>> FEATURED STOCK ARTICLE : Slump Back Into Prior Base Raised Concerns - 11/8/2017 |
View all notes |
Set NEW NOTE alert |
Company Profile |
SEC
News |
Chart |
Request a new note
C
A
S
I |
AVGO
-
NASDAQ
Broadcom Limited
ELECTRONICS - Semiconductor - Broad Line
|
$263.61
|
-7.95
-2.93% |
$274.52
|
4,837,328
161.03% of 50 DAV
50 DAV is 3,004,000
|
$285.68
-7.73%
|
10/30/2017
|
$261.19
|
PP = $259.46
|
|
MB = $272.43
|
Most Recent Note - 12/4/2017 5:46:12 PM
G - Fell with above average volume for a 3rd time in the span of 4 sessions. Prior highs in the $259 area and its 50 DMA line ($257.38) define near-term support to watch. Due to report earnings on Wednesday, December 6, 2017 after the close of the market. Volume and volatility often increase near earnings news. Recently made bids to acquire Qualcomm Inc (QCOM).
>>> FEATURED STOCK ARTICLE : Consolidating Near Record High Following Volume-Driven Gains - 11/13/2017 |
View all notes |
Set NEW NOTE alert |
Company Profile |
SEC
News |
Chart |
Request a new note
C
A
S
I |
YY
-
NASDAQ
YY Inc Ads
INTERNET - Internet Service Providers
|
$101.12
|
+0.39
0.39% |
$105.79
|
1,383,348
83.74% of 50 DAV
50 DAV is 1,652,000
|
$123.48
-18.11%
|
9/25/2017
|
$80.26
|
PP = $83.10
|
|
MB = $87.26
|
Most Recent Note - 11/29/2017 1:30:23 PM
G - Prior high in the $97.59 area defines near-term support along with its 50 DMA line ($93.78). Abruptly retreating from its all-time high after getting very extended from any sound base. Fundamentals remain strong.
>>> FEATURED STOCK ARTICLE : Chinese Social Media Firm Reported Earnings - 11/14/2017 |
View all notes |
Set NEW NOTE alert |
Company Profile |
SEC
News |
Chart |
Request a new note
C
A
S
I |
HTHT
-
NASDAQ
China Lodging Group Ads
LEISURE - Lodging
|
$109.92
|
+2.39
2.22% |
$111.76
|
932,687
188.80% of 50 DAV
50 DAV is 494,000
|
$142.80
-23.03%
|
9/29/2016
|
$46.12
|
PP = $47.82
|
|
MB = $50.21
|
Most Recent Note - 11/29/2017 1:28:38 PM
G - Damaging volume-driven losses triggered technical sell signals as it slumped well below its 50 DMA line ($126). Reported Sep '17 quarterly earnings +58% on +34% sales revenues versus the year ago period, above the +25% minimum earnings guideline (C criteria). Sequential quarterly comparisons have shown encouraging sales revenues growth acceleration.
>>> FEATURED STOCK ARTICLE : Weak Technical Action Raises Concerns Despite Strong Fundamentals - 11/29/2017 |
View all notes |
Set NEW NOTE alert |
Company Profile |
SEC
News |
Chart |
Request a new note
C
A
S
I |
Symbol/Exchange
Company Name
Industry Group |
PRICE |
CHANGE
(%Change) |
Day High |
Volume
(% DAV)
(% 50 day avg vol) |
52 Wk Hi
% From Hi |
Featured
Date |
Price
Featured |
Pivot Featured |
|
Max Buy |
LMAT
-
NASDAQ
Lemaitre Vascular Inc
Medical-Products
|
$31.39
|
-1.38
-4.21% |
$33.14
|
147,335
75.13% of 50 DAV
50 DAV is 196,100
|
$39.88
-21.29%
|
7/28/2017
|
$33.50
|
PP = $33.32
|
|
MB = $34.99
|
Most Recent Note - 12/4/2017 5:53:49 PM
Finished near the session low with today's 4th consecutive loss testing its 200 DMA line ($31.09). A rebound above the 50 DMA line ($35.39) is needed for its outlook to improve. Its Relative Strength rating has slumped to 59, well below the 80+ minimum guideline for buy candidates. It will be dropped from the Featured Stocks list tonight. Losses below the 200 DMA line and recent low would raise greater concerns.
>>> FEATURED STOCK ARTICLE : Halted Slide After Damaging 50-Day Moving Average Breach - 11/15/2017 |
View all notes |
Set NEW NOTE alert |
Company Profile |
SEC
News |
Chart |
Request a new note
C
A
S
I |
PATK
-
NASDAQ
Patrick Industries Inc
Bldg-Mobile/Mfg and RV
|
$98.00
|
-1.10
-1.11% |
$102.95
|
110,221
129.67% of 50 DAV
50 DAV is 85,000
|
$101.88
-3.80%
|
10/26/2017
|
$90.90
|
PP = $87.90
|
|
MB = $92.30
|
Most Recent Note - 11/28/2017 12:43:11 PM
G - Rallying to a new all-time high and its color code is changed to green after getting extended from its prior base. Prior highs and its 50 DMA line ($87.02) define important near-term support to watch. Fundamentals remain strong.
>>> FEATURED STOCK ARTICLE : Best Ever Close After Pullback Found Support Near Prior High - 11/21/2017 |
View all notes |
Set NEW NOTE alert |
Company Profile |
SEC
News |
Chart |
Request a new note
C
A
S
I |
ESNT
-
NYSE
Essent Group Ltd
Finance-MrtgandRel Svc
|
$45.52
|
+0.45
1.00% |
$46.15
|
903,228
97.86% of 50 DAV
50 DAV is 923,000
|
$45.55
-0.07%
|
10/9/2017
|
$39.75
|
PP = $41.54
|
|
MB = $43.62
|
Most Recent Note - 12/4/2017 5:47:39 PM
G - Gapped up and quietly hit a new high today. Its 50 DMA line ($42.55) and recent low ($39.79 on 11/03/17) define important near-term support to watch on pullbacks. Fundamentals remain strong.
>>> FEATURED STOCK ARTICLE : Recent Consolidation Was Not a Sufficient Length New Base - 11/20/2017 |
View all notes |
Set NEW NOTE alert |
Company Profile |
SEC
News |
Chart |
Request a new note
C
A
S
I |
FIVE
-
NASDAQ
Five Below Inc
Retail-DiscountandVariety
|
$65.00
|
+3.49
5.67% |
$65.48
|
1,726,672
189.54% of 50 DAV
50 DAV is 911,000
|
$63.34
2.63%
|
10/6/2017
|
$57.13
|
PP = $54.23
|
|
MB = $56.94
|
Most Recent Note - 12/4/2017 5:49:00 PM
G - Hit another new all-time high today with additional volume-driven gains. It is extended from its prior base, and its 50 DMA line ($57.12) defines near-term support to watch. Reported earnings +80% on +29% sales revenues for the Oct '17 quarter, continuing its strong earnings track record.
>>> FEATURED STOCK ARTICLE : Getting Extended From Prior Base With Earnings News Due - 11/24/2017 |
View all notes |
Set NEW NOTE alert |
Company Profile |
SEC
News |
Chart |
Request a new note
C
A
S
I |
OLED
-
NASDAQ
Universal Display Corp
Elec-Misc Products
|
$167.55
|
-9.15
-5.18% |
$181.50
|
1,542,882
172.39% of 50 DAV
50 DAV is 895,000
|
$192.75
-13.07%
|
8/31/2017
|
$128.22
|
PP = $127.78
|
|
MB = $134.17
|
Most Recent Note - 11/29/2017 1:00:46 PM
G - Retreating from its all-time high with today's loss on higher volume indicative of distributional pressure. Very extended from any sound base pattern. Its 50 DMA line ($149.10) and prior high in the $145 area define important near-term support to watch on pullbacks.
>>> FEATURED STOCK ARTICLE : Electronic Products Firm Perched at Record High - 11/17/2017 |
View all notes |
Set NEW NOTE alert |
Company Profile |
SEC
News |
Chart |
Request a new note
C
A
S
I |
Symbol/Exchange
Company Name
Industry Group |
PRICE |
CHANGE
(%Change) |
Day High |
Volume
(% DAV)
(% 50 day avg vol) |
52 Wk Hi
% From Hi |
Featured
Date |
Price
Featured |
Pivot Featured |
|
Max Buy |
ANET
-
NYSE
Arista Networks Inc
TELECOMMUNICATIONS - Communication Equipment
|
$209.48
|
-19.17
-8.38% |
$233.78
|
2,585,678
336.68% of 50 DAV
50 DAV is 768,000
|
$245.65
-14.72%
|
10/27/2017
|
$195.65
|
PP = $196.37
|
|
MB = $206.19
|
Most Recent Note - 12/4/2017 12:11:55 PM
G - Pulling back with today's 4th consecutive loss after getting very extended from the previously noted base. Its 50 DMA line ($206.01) and prior highs in the $196 area define near-term support to watch on pullbacks.
>>> FEATURED STOCK ARTICLE : Perched at Record High Following Volume-Driven Gains - 11/9/2017 |
View all notes |
Set NEW NOTE alert |
Company Profile |
SEC
News |
Chart |
Request a new note
C
A
S
I |
GRUB
-
NYSE
Grubhub Inc
COMPUTER SOFTWARE and SERVICES - Technical and System Software
|
$66.94
|
+0.34
0.51% |
$68.08
|
1,515,008
99.34% of 50 DAV
50 DAV is 1,525,000
|
$69.82
-4.12%
|
6/21/2017
|
$47.33
|
PP = $46.94
|
|
MB = $49.29
|
Most Recent Note - 11/28/2017 5:58:22 PM
G - It is very extended from any sound base after wedging higher with gains lacking great volume conviction. Prior highs and its 50 DMA line define support near $57. Reported Sep '17 quarterly earnings +22% on +32% sales revenues. The 2 latest quarters were below the +25% minimum earnings guideline (C criteria), raising fundamental concerns with regard to the fact-based investment system.
>>> FEATURED STOCK ARTICLE : Extended From Prior Highs After Gains on Light Volume - 11/22/2017 |
View all notes |
Set NEW NOTE alert |
Company Profile |
SEC
News |
Chart |
Request a new note
C
A
S
I |
IBP
-
NYSE
Installed Building Prod
DIVERSIFIED SERVICES - Business/Management Services
|
$76.55
|
+0.00
0.00% |
$79.40
|
236,686
125.23% of 50 DAV
50 DAV is 189,000
|
$78.20
-2.11%
|
9/19/2017
|
$59.15
|
PP = $60.10
|
|
MB = $63.11
|
Most Recent Note - 12/1/2017 7:04:44 PM
G - Perched near its all-time high, extended from any sound base. The 50 DMA line ($66.79 and recent low ($59.84 on 11/08/17) define important near-term support to watch on pullbacks. See the latest FSU analysis for more details and a new annotated graph.
>>> FEATURED STOCK ARTICLE : Extended From Any Sound Base After Impressive Rebound and Rally - 12/1/2017 |
View all notes |
Set NEW NOTE alert |
Company Profile |
SEC
News |
Chart |
Request a new note
C
A
S
I |
HQY
-
NASDAQ
Healthequity Inc
COMPUTER SOFTWARE and SERVICES - Healthcare Information Service
|
$48.86
|
-2.60
-5.05% |
$52.49
|
510,360
126.33% of 50 DAV
50 DAV is 404,000
|
$55.31
-11.66%
|
11/6/2017
|
$54.63
|
PP = $52.87
|
|
MB = $55.51
|
Most Recent Note - 12/4/2017 5:41:41 PM
G - Fell below its 50 DMA line ($50.47) with a loss today on higher volume raising concerns and its color code is changed to green. Disciplined investors always limit losses by selling any stock that falls more than -7% from their purchase price. See the latest FSU analysis for more details and a new annotated graph.
>>> FEATURED STOCK ARTICLE : Sank Below 50-Day Moving Average With Loss on Higher Volume - 12/4/2017 |
View all notes |
Set NEW NOTE alert |
Company Profile |
SEC
News |
Chart |
Request a new note
C
A
S
I |
OLLI
-
NASDAQ
Ollie's Bargain Outlet
Retail-DiscountandVariety
|
$49.60
|
+2.10
4.42% |
$49.75
|
1,117,314
253.36% of 50 DAV
50 DAV is 441,000
|
$48.10
3.12%
|
11/21/2017
|
$46.78
|
PP = $47.00
|
|
MB = $49.35
|
Most Recent Note - 12/4/2017 12:23:04 PM
Y - Hitting a new high with today's 6th consecutive gain. Gains above the pivot point triggered a new (or add-on) technical buy signal. Its 50 DMA line ($45.51) and prior lows in the $42 area define the next important support level.
>>> FEATURED STOCK ARTICLE : Recently Stalled After Reaching a New High - 11/27/2017 |
View all notes |
Set NEW NOTE alert |
Company Profile |
SEC
News |
Chart |
Request a new note
C
A
S
I |
Symbol/Exchange
Company Name
Industry Group |
PRICE |
CHANGE
(%Change) |
Day High |
Volume
(% DAV)
(% 50 day avg vol) |
52 Wk Hi
% From Hi |
Featured
Date |
Price
Featured |
Pivot Featured |
|
Max Buy |
HLI
-
NYSE
Houlihan Lokey Inc Cl A
Finance-Invest Bnk/Bkrs
|
$44.84
|
+0.87
1.98% |
$44.89
|
155,461
62.94% of 50 DAV
50 DAV is 247,000
|
$45.12
-0.62%
|
9/18/2017
|
$37.04
|
PP = $39.78
|
|
MB = $41.77
|
Most Recent Note - 12/4/2017 5:50:06 PM
G - Posted a quiet gain today for a best-ever close. Perched at its all-time high, extended from any sound base. Its 50 DMA line and prior lows define near-term support in the $41 area. On 10/26/17 it priced a Secondary Offering. Fundamentals remain strong.
>>> FEATURED STOCK ARTICLE : Holding Ground Near Record High - 11/16/2017 |
View all notes |
Set NEW NOTE alert |
Company Profile |
SEC
News |
Chart |
Request a new note
C
A
S
I |
|
|
|
THESE ARE NOT BUY RECOMMENDATIONS!
Comments contained in the body of this report are technical
opinions only. The material herein has been obtained
from sources believed to be reliable and accurate, however,
its accuracy and completeness cannot be guaranteed.
This site is not an investment advisor, hence it does
not endorse or recommend any securities or other investments.
Any recommendation contained in this report may not
be suitable for all investors and it is not to be deemed
an offer or solicitation on our part with respect to
the purchase or sale of any securities. All trademarks,
service marks and trade names appearing in this report
are the property of their respective owners, and are
likewise used for identification purposes only.
This report is a service available
only to active Paid Premium Members.
You may opt-out of receiving report notifications
at any time. Questions or comments may be submitted
by writing to Premium Membership Services 665 S.E. 10 Street, Suite 201 Deerfield Beach, FL 33441-5634 or by calling 1-800-965-8307
or 954-785-1121.
|
|
|