You are not logged in.
This means you
CAN ONLY VIEW reports that were published prior to Thursday, March 20, 2025.
You
MUST UPGRADE YOUR MEMBERSHIP if you want to see any current reports.
AFTER MARKET UPDATE - FRIDAY, JANUARY 29TH, 2021
Previous After Market Report Next After Market Report >>>
|
|
|
|
DOW |
-620.74 |
29,982.62 |
-2.03% |
|
Volume |
1,553,044,329 |
+15% |
|
Volume |
7,745,896,100 |
-20% |
|
NASDAQ |
-273.58 |
13,063.57 |
-2.05% |
|
Advancers |
865 |
28% |
|
Advancers |
1,164 |
31% |
|
S&P 500 |
-73.14 |
3,714.24 |
-1.93% |
|
Decliners |
2,175 |
72% |
|
Decliners |
2,580 |
69% |
|
Russell 2000 |
-32.97 |
2,073.64 |
-1.56% |
|
52 Wk Highs |
54 |
|
|
52 Wk Highs |
86 |
|
|
S&P 600 |
-18.07 |
1,188.71 |
-1.50% |
|
52 Wk Lows |
5 |
|
|
52 Wk Lows |
23 |
|
|
 |
Market Clearly Faced Pressure This Week as Leadership Thinned
Kenneth J. Gruneisen - Passed the CAN SLIM® Master's Exam
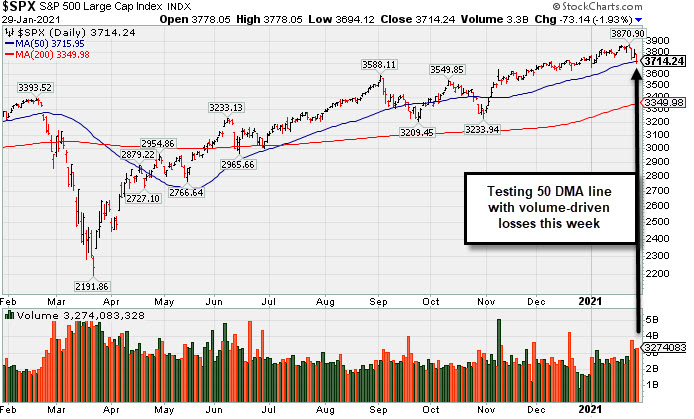
The Dow fell 620 points, extending its weekly decline to 3.3%. The S&P 500 slid 1.9% for the day and 3.3% for the week. The Nasdaq Composite retreated 2%, capping a 3.5% drop for the week. The downward pressure this week pushed the Dow and S&P 500 into negative for the year, with the benchmarks ending the month 2.0% and 1.1% lower, respectively. The Nasdaq Composite bucked the downtrend, remaining 1.4% higher in January. The volume totals on Friday were mixed, higher than the prior session on the NYSE and lighter on the Nasdaq exchange. Decliners led advancers by more than a 2-1 margin on the NYSE and on the Nasdaq exchange. There were 16 high-ranked companies from the Leaders List that hit new 52-week highs and were listed on the BreakOuts Page, versus the total of 25 on the prior session, and down abruptly from 96 on Monday. New 52-week highs totals contracted again but still outnumbered the new 52-week lows totals. The major indices clearly saw their uptrend come under pressure (M criteria) this week while leadership thinned. Investors are reminded to always make buying and selling decisions based based on the strict criteria and rules of the fact-based investment system. PICTURED: The S&P 500 Index pulled back testing its 50-day moving average (DMA) line with higher volume behind losses this week from its record high.
U.S. equities ended firmly lower on Friday, capping Wall Street’s worst week for stocks since late October. Volatility remained elevated on a number of small-cap stocks favored by some retail investors on Friday. Also weighing on sentiment was disappointing COVID-19 vaccine updates, with Johnson & Johnson (JNJ -3.56%) noting lower efficacy of its single shot inoculation against certain variants of the virus. Meanwhile, Novavax (NVAX +64.87%) rallied after it reported its vaccine was 90% effective overall, but only 60% effective in the highly contagious South African strain.
On the data front, personal income ticked up 0.6% in December, while spending fell 0.2%. The core PCE deflator (ex-food and energy), climbed 1.5% year-over-year. Treasuries declined, with the yield on the 10-year note adding two basis points to 1.07%.
All 11 S&P 500 sectors finished in negative territory, with nine groups shedding more than 1%. Energy stocks led laggards with Chevron (CVX -4.27%) fell after reporting a surprise loss in the most recent quarter. In other earnings, Mondelez (MDLZ -2.94%) fell despite fourth quarter earnings and revenue coming in above consensus estimates. Drug maker Eli Lilly (LLY -0.96%) fell despite its profit tally beating on the top and bottom line. |
 Kenneth J. Gruneisen started out as a licensed stockbroker in August 1987, a couple of months prior to the historic stock market crash that took the Dow Jones Industrial Average down -22.6% in a single day. He has published daily fact-based fundamental and technical analysis on high-ranked stocks online for two decades. Through FACTBASEDINVESTING.COM, Kenneth provides educational articles, news, market commentary, and other information regarding proven investment systems that work in good times and bad.
Comments contained in the body of this report are technical opinions only and are not necessarily those of Gruneisen Growth Corp. The material herein has been obtained from sources believed to be reliable and accurate, however, its accuracy and completeness cannot be guaranteed. Our firm, employees, and customers may effect transactions, including transactions contrary to any recommendation herein, or have positions in the securities mentioned herein or options with respect thereto. Any recommendation contained in this report may not be suitable for all investors and it is not to be deemed an offer or solicitation on our part with respect to the purchase or sale of any securities. |
|
 |
Financial, Retail, Tech, and Energy-Linked Groups Fell
Kenneth J. Gruneisen - Passed the CAN SLIM® Master's Exam
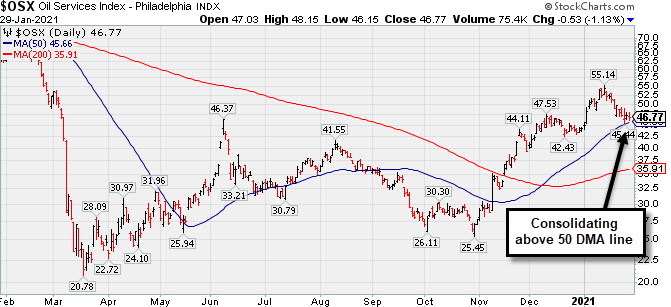
The Bank Index ($BKX -2.51%) and Broker/Dealer Index ($XBD -2.04%) created a drag on the major indices along with the Retail Index ($RLX -1.65%). The Gold & Silver Index ($XAU -0.07%) finished flat while the Integrated Oil Index ($XOI -3.87%) and Oil Services Index ($OSX -1.16%) both slumped. The tech sector also had a negative bias as the Semiconductor Index ($SOX -1.71%) Networking Index ($NWX -1.77%) both outpaced the Biotech Index ($BTK -0.49%) to the downside.
PICTURED: The Oil Services Index ($OSX -1.16%) is consolidating above its 50-day moving average (DMA) line.
| Oil Services |
$OSX |
46.76 |
-0.55 |
-1.16% |
+5.48% |
| Integrated Oil |
$XOI |
812.58 |
-32.68 |
-3.87% |
+2.54% |
| Semiconductor |
$SOX |
2,884.93 |
-50.19 |
-1.71% |
+3.20% |
| Networking |
$NWX |
758.29 |
-13.70 |
-1.77% |
+5.74% |
| Broker/Dealer |
$XBD |
377.72 |
-7.85 |
-2.04% |
+0.03% |
| Retail |
$RLX |
3,521.31 |
-59.15 |
-1.65% |
-1.17% |
| Gold & Silver |
$XAU |
138.59 |
-0.09 |
-0.07% |
-3.88% |
| Bank |
$BKX |
97.78 |
-2.52 |
-2.51% |
-0.13% |
| Biotech |
$BTK |
5,984.62 |
-29.64 |
-0.49% |
+4.28% |
|
|
|
 |
Testing Important Support on Pullback
Kenneth J. Gruneisen - Passed the CAN SLIM® Master's Exam
Charles River Labs Intl (CRL -$1.83 or -0.70% to $259.05) pulled back further with lighter volume behind today's loss. The prior high ($257) and support at its 50-day moving average DMA line ($250.46) were tested with the pullback this week. More damaging losses would raise concerns and trigger technical sell signals.
It is due to report Dec '20 quarterly results on 2/17/21. Volume and volatility often increase near earnings news. CRL reported Sep '20 quarterly earnings +38% on +11% sales revenues versus the year ago period, above the +25% minimum earnings guideline (C criteria). It now has a 90 Earnings Per Share Rating. Annual earnings (A criteria) history has been strong and steady.
It hails from the Medical - Research Equipment/Services industry group which currently has a mediocre C(37) Group Relative Strength Rating (L criteria). CRL traded up as much as +29.9% since it was highlighted in yellow with pivot point cited based on its 6/03/20 high plus 10 cents in the 7/15/20 mid-day report (read here). It was last shown in this FSU section on 1/05/21 with an annotated graph under the headline, "Hovering in Tight Range Holding Ground Near High".
The number of top-rated funds owning its shares rose from 681 in Dec '19 to 810 in Dec '20, and its Up/Down Volume Ratio is 1.0 is an unbiased indication its shares have been neutral concerning accumulation/distribution over the past 50 days. There is a small number of only 49.7 million shares (S criteria) outstanding, which can contribute to greater price volatility in the event of institutional buying or selling.
|
|
|
Color Codes Explained :
Y - Better candidates highlighted by our
staff of experts.
G - Previously featured
in past reports as yellow but may no longer be buyable under the
guidelines.
***Last / Change / Volume data in this table is the closing quote data***
Symbol/Exchange
Company Name
Industry Group |
PRICE |
CHANGE
(%Change) |
Day High |
Volume
(% DAV)
(% 50 day avg vol) |
52 Wk Hi
% From Hi |
Featured
Date |
Price
Featured |
Pivot Featured |
|
Max Buy |
 CRL
-
NYSE
CRL
-
NYSE
Charles River Labs Intl
DRUGS - Biotechnology
|
$259.05
|
-1.83
-0.70% |
$262.54
|
229,289
82.87% of 50 DAV
50 DAV is 276,700
|
$284.60
-8.98%
|
12/17/2020
|
$247.06
|
PP = $257.98
|
|
MB = $270.88
|
 Most Recent Note - 1/29/2021 5:07:35 PM
Y - Pulled back with lighter volume today. Losses this week tested the prior high ($257) and its 50 DMA line ($250.46). Reported Sep '20 quarterly earnings +38% on +11% sales revenues versus the year ago period, above the +25% minimum earnings guideline (C criteria). See the latest FSU analysis for more details and a new annotated graph.
>>> FEATURED STOCK ARTICLE : Testing Important Support on Pullback - 1/29/2021 |
View all notes |
Set NEW NOTE alert |
Company Profile |
SEC
News |
Chart |
Request a new note
C
A
S
I |
AMD
-
NYSE
Advanced Micro Devices
ELECTRONICS - Semiconductor - Broad Line
|
$85.64
|
-1.88
-2.15% |
$88.33
|
56,415,113
127.89% of 50 DAV
50 DAV is 44,111,200
|
$99.23
-13.70%
|
11/18/2020
|
$82.54
|
PP = $88.72
|
|
MB = $93.16
|
Most Recent Note - 1/27/2021 4:51:15 PM
G - Fundamentals remain strong after it reported Dec '20 quarterly earnings +63% on +53% sales revenues versus the year ago period. Color code is changed to green after today's damaging volume-driven loss violated the 50 DMA line ($91.14) hurting its outlook. Its current Relative Strength rating of 77 is still below the 80+ minimum guideline for buy candidates.
>>> FEATURED STOCK ARTICLE : Distributional Pressure Brings Pullback Below "Max Buy" Level - 1/13/2021 |
View all notes |
Set NEW NOTE alert |
Company Profile |
SEC
News |
Chart |
Request a new note
C
A
S
I |
TER
-
NASDAQ
Teradyne Inc
ELECTRONICS - Semiconductor Equipment and Mate
|
$113.48
|
-6.46
-5.39% |
$119.72
|
4,652,807
313.11% of 50 DAV
50 DAV is 1,486,000
|
$143.40
-20.86%
|
10/21/2020
|
$92.22
|
PP = $93.54
|
|
MB = $98.22
|
Most Recent Note - 1/29/2021 5:05:35 PM
Today's big volume-driven loss more deeply violated its 50 DMA line ($121.17) after prior damaging losses raised concerns and triggered a technical sell signal. A rebound above the 50 DMA line is needed for its outlook to improve. It will be dropped from the Featured Stocks list.
>>> FEATURED STOCK ARTICLE : Traded +55.5% Higher in 3 Months Since Featured - 1/25/2021 |
View all notes |
Set NEW NOTE alert |
Company Profile |
SEC
News |
Chart |
Request a new note
C
A
S
I |
AMRC
-
NYSE
Ameresco Inc Cl A
ENERGY - Alternative
|
$56.09
|
-0.04
-0.07% |
$58.41
|
530,567
123.39% of 50 DAV
50 DAV is 430,000
|
$63.45
-11.60%
|
12/15/2020
|
$46.72
|
PP = $47.10
|
|
MB = $49.46
|
Most Recent Note - 1/27/2021 4:47:59 PM
G - Suffered a large volume-driven loss today retreating from its all-time high. It remains very extended from any sound base. Its 50 DMA line ($50.05) and prior highs in the $46-47 area define important near-term support to watch.
>>> FEATURED STOCK ARTICLE : Very Extended From Base After Another Powerful Gain - 1/6/2021 |
View all notes |
Set NEW NOTE alert |
Company Profile |
SEC
News |
Chart |
Request a new note
C
A
S
I |
TREX
-
NYSE
Trex Company Inc
MATERIALS and CONSTRUCTION - General Building Materials
|
$91.77
|
-0.20
-0.22% |
$92.62
|
902,783
131.79% of 50 DAV
50 DAV is 685,000
|
$104.35
-12.06%
|
6/26/2020
|
$54.53
|
PP = $66.47
|
|
MB = $69.79
|
Most Recent Note - 1/25/2021 1:10:40 PM
G - Off earlier highs after rallying for new all-time highs with 4 consecutive gains. Prior highs in the $80-81 area define important support to watch coinciding with its 50 DMA line ($81.89). Sep '20 quarterly earnings were +14% on +19% sales revenues versus the year ago period, below the +25% minimum guideline (C criteria) raising fundamental concerns.
>>> FEATURED STOCK ARTICLE : Hit New All-Time High With Gain Backed by Average Volume - 1/19/2021 |
View all notes |
Set NEW NOTE alert |
Company Profile |
SEC
News |
Chart |
Request a new note
C
A
S
I |
Symbol/Exchange
Company Name
Industry Group |
PRICE |
CHANGE
(%Change) |
Day High |
Volume
(% DAV)
(% 50 day avg vol) |
52 Wk Hi
% From Hi |
Featured
Date |
Price
Featured |
Pivot Featured |
|
Max Buy |
CLFD
-
NASDAQ
Clearfield Inc
TELECOMMUNICATIONS - Cables / Satalite Equipment
|
$31.41
|
-2.02
-6.04% |
$34.75
|
325,841
273.82% of 50 DAV
50 DAV is 119,000
|
$37.54
-16.33%
|
1/20/2021
|
$31.38
|
PP = $28.42
|
|
MB = $29.84
|
Most Recent Note - 1/29/2021 12:06:36 PM
G - Reported Dec '20 quarterly earnings +475% on +40% sales revenues versus the year ago period, continuing its strong earning track record. Prior highs in the $28 area define initial support to watch on pullbacks. Found prompt support at its 50 DMA line and upward trendline when consolidating. See the latest FSU analysis for more details and an annotated graph.
>>> FEATURED STOCK ARTICLE : Perched Near Record High With Earnings Report Due Soon - 1/27/2021 |
View all notes |
Set NEW NOTE alert |
Company Profile |
SEC
News |
Chart |
Request a new note
C
A
S
I |
NOW
-
NYSE
Servicenow Inc
Computer Sftwr-Enterprse
|
$543.16
|
-11.08
-2.00% |
$552.00
|
2,289,045
174.23% of 50 DAV
50 DAV is 1,313,800
|
$566.74
-4.16%
|
8/20/2020
|
$453.34
|
PP = $454.79
|
|
MB = $477.53
|
Most Recent Note - 1/28/2021 12:42:24 PM
G - Gapped up today promptly rebounding above its 50 DMA line ($531) and challenging its prior high. Fundamental concerns remain after it reported Dec '20 quarterly earnings +22% on +31% sales revenues versus the year ago period, its 2nd consecutive comparison below the +25% minimum guideline (C criteria) of the fact-based investment system.
>>> FEATURED STOCK ARTICLE : Gain Today and Rebound Above 50-Day Moving Average Line - 1/8/2021 |
View all notes |
Set NEW NOTE alert |
Company Profile |
SEC
News |
Chart |
Request a new note
C
A
S
I |
SMPL
-
NASDAQ
Simply Good Foods Co
Food-Confectionery
|
$28.54
|
-0.24
-0.83% |
$29.43
|
500,702
39.71% of 50 DAV
50 DAV is 1,261,000
|
$32.03
-10.90%
|
12/28/2020
|
$30.40
|
PP = $31.44
|
|
MB = $33.01
|
Most Recent Note - 1/25/2021 6:07:30 PM
G - Posted a big gain today with lighter than average volume. Its Relative Strength Rating is still 68, well below the 80+ minimum guideline. See the latest FSU analysis for more details and an annotated graph.
>>> FEATURED STOCK ARTICLE : Relative Strength Rating Suffered During Stalling Action - 1/21/2021 |
View all notes |
Set NEW NOTE alert |
Company Profile |
SEC
News |
Chart |
Request a new note
C
A
S
I |
ALRM
-
NASDAQ
Alarm.com Holdings Inc
Security/Sfty
|
$92.92
|
-2.75
-2.87% |
$96.57
|
406,619
87.26% of 50 DAV
50 DAV is 466,000
|
$108.67
-14.49%
|
11/6/2020
|
$71.88
|
PP = $74.76
|
|
MB = $78.50
|
Most Recent Note - 1/29/2021 5:10:29 PM
G - It was down again today with lighter than average volume, slumping near the 50 DMA line ($89.52) which defines important near-term support to watch.
>>> FEATURED STOCK ARTICLE : Encountered Distributional Pressure After Big Rally - 1/20/2021 |
View all notes |
Set NEW NOTE alert |
Company Profile |
SEC
News |
Chart |
Request a new note
C
A
S
I |
TEAM
-
NASDAQ
Atlassian Corp Plc
Comp Sftwr-Spec Enterprs
|
$231.13
|
+4.11
1.81% |
$234.27
|
2,987,300
189.31% of 50 DAV
50 DAV is 1,578,000
|
$250.03
-7.56%
|
10/12/2020
|
$193.77
|
PP = $199.60
|
|
MB = $209.58
|
Most Recent Note - 1/29/2021 12:50:46 PM
G - Sputtering below its 50 DMA line ($228) which acted as resistance after a violation raised concerns. Recent low ($208.62 on 1/27/21) defines important near-term support to watch. Its current Relative Strength Rating is 62, below the +80 minimum guideline for buy candidates. Earnings rose +7% on +26% sales revenues for the Sep '20 quarter versus the year ago period, below the +25% minimum earnings guideline (C criteria), raising fundamental concerns.
>>> FEATURED STOCK ARTICLE : Relative Strength Rating Remains Below 80+ Minimum Guideline - 1/11/2021 |
View all notes |
Set NEW NOTE alert |
Company Profile |
SEC
News |
Chart |
Request a new note
C
A
S
I |
Symbol/Exchange
Company Name
Industry Group |
PRICE |
CHANGE
(%Change) |
Day High |
Volume
(% DAV)
(% 50 day avg vol) |
52 Wk Hi
% From Hi |
Featured
Date |
Price
Featured |
Pivot Featured |
|
Max Buy |
SHOP
-
NYSE
Shopify Inc Cl A
Computer Sftwr-Enterprse
|
$1,098.59
|
-21.98
-1.96% |
$1,124.81
|
988,995
76.79% of 50 DAV
50 DAV is 1,288,000
|
$1,285.19
-14.52%
|
12/16/2020
|
$1,146.00
|
PP = $1,147.01
|
|
MB = $1,204.36
|
Most Recent Note - 1/27/2021 4:54:10 PM
G - Violated its 50 DMA line ($1,105) with today's big volume-driven loss raising concerns and its color code is changed to green. Prior low ($1,076 on 1/06/21) defines the next important support to watch.
>>> FEATURED STOCK ARTICLE : Rebounded After Undercutting Prior Highs - 1/7/2021 |
View all notes |
Set NEW NOTE alert |
Company Profile |
SEC
News |
Chart |
Request a new note
C
A
S
I |
YETI
-
NYSE
Yeti Holdings Inc
Leisure-Products
|
$65.82
|
-3.15
-4.57% |
$69.63
|
924,062
66.91% of 50 DAV
50 DAV is 1,381,000
|
$80.89
-18.63%
|
11/5/2020
|
$57.25
|
PP = $55.14
|
|
MB = $57.90
|
Most Recent Note - 1/28/2021 5:33:03 PM
G - Quietly consolidating near its 50 DMA line ($68.54) which has been acting as support. More damaging losses would raise concerns and trigger a technical sell signal.
>>> FEATURED STOCK ARTICLE : 50-Day Moving Average and Prior Lows Define Near-Term Support - 1/22/2021 |
View all notes |
Set NEW NOTE alert |
Company Profile |
SEC
News |
Chart |
Request a new note
C
A
S
I |
BJ
-
NYSE
BJs Wholesale Club Hldgs
Retail-DiscountandVariety
|
$42.07
|
-1.58
-3.62% |
$45.50
|
3,910,011
144.30% of 50 DAV
50 DAV is 2,709,600
|
$50.18
-16.16%
|
1/28/2021
|
$44.74
|
PP = $47.56
|
|
MB = $49.94
|
Most Recent Note - 1/29/2021 5:09:05 PM
Y - Suffered a 2nd consecutive loss today with above average volume. Finished weak on the prior session after highlighted in yellow with pivot point cited based on its 8/26/21 high. Abruptly retreated after a volume-driven breakout on the prior session capped a 7 session winning streak. See the latest FSU analysis for more details and an annotated graph.
>>> FEATURED STOCK ARTICLE : Pulled Back After Breakout Capped 7-Day Winning Streak - 1/28/2021 |
View all notes |
Set NEW NOTE alert |
Company Profile |
SEC
News |
Chart |
Request a new note
C
A
S
I |
DOCU
-
NASDAQ
Docusign Inc
Computer Sftwr-Enterprse
|
$232.89
|
-1.25
-0.53% |
$235.64
|
1,940,272
54.70% of 50 DAV
50 DAV is 3,547,000
|
$290.23
-19.76%
|
1/12/2021
|
$253.50
|
PP = $256.10
|
|
MB = $268.91
|
Most Recent Note - 1/27/2021 5:01:40 PM
G - Color code is changed to green after today's 3rd big loss with near average volume raised concerns and triggered a technical sell signal by violating its 50 DMA line ($233). Only a prompt rebound above the 50 DMA line would help its outlook improve. The prior low ($216.50 on 1/04/21) defines the next important support to watch. Fundamentals remain strong.
>>> FEATURED STOCK ARTICLE : Twice Average Volume Behind Breakout Gain - 1/12/2021 |
View all notes |
Set NEW NOTE alert |
Company Profile |
SEC
News |
Chart |
Request a new note
C
A
S
I |
AAXN
-
NASDAQ
Axon Enterprise Inc
Security/Sfty
|
$164.16
|
+0.19
0.12% |
$168.97
|
355,895
57.65% of 50 DAV
50 DAV is 617,300
|
$180.69
-9.15%
|
12/22/2020
|
$127.84
|
PP = $130.51
|
|
MB = $137.04
|
Most Recent Note - 1/25/2021 6:05:38 PM
G - Getting more extended from any sound base, it hit yet another new all-time high with today's gain on average volume. Prior high ($134) defines initial support to watch. Found prompt support near its 50 DMA line ($130) during the recent consolidation. Fundamentals remain strong.
>>> FEATURED STOCK ARTICLE : Hit New Highs With Streak of Big Volume-Driven Gains - 1/15/2021 |
View all notes |
Set NEW NOTE alert |
Company Profile |
SEC
News |
Chart |
Request a new note
C
A
S
I |
Symbol/Exchange
Company Name
Industry Group |
PRICE |
CHANGE
(%Change) |
Day High |
Volume
(% DAV)
(% 50 day avg vol) |
52 Wk Hi
% From Hi |
Featured
Date |
Price
Featured |
Pivot Featured |
|
Max Buy |
QTWO
-
NYSE
Q2 Holdings Inc
Computer Sftwr-Financial
|
$127.99
|
-3.43
-2.61% |
$131.53
|
557,779
117.67% of 50 DAV
50 DAV is 474,000
|
$142.76
-10.35%
|
11/12/2020
|
$105.14
|
PP = $106.54
|
|
MB = $111.87
|
Most Recent Note - 1/26/2021 6:02:04 PM
G - Perched at its all-time high, extended from any sound base. Its 50 DMA line ($121.54) defines important near term support to watch on pullbacks. See the latest FSU analysis for more details and a new annotated graph.
>>> FEATURED STOCK ARTICLE : Perched Near All-Time High Stubbornly Holding Ground - 1/26/2021 |
View all notes |
Set NEW NOTE alert |
Company Profile |
SEC
News |
Chart |
Request a new note
C
A
S
I |
|
|
|
THESE ARE NOT BUY RECOMMENDATIONS!
Comments contained in the body of this report are technical
opinions only. The material herein has been obtained
from sources believed to be reliable and accurate, however,
its accuracy and completeness cannot be guaranteed.
This site is not an investment advisor, hence it does
not endorse or recommend any securities or other investments.
Any recommendation contained in this report may not
be suitable for all investors and it is not to be deemed
an offer or solicitation on our part with respect to
the purchase or sale of any securities. All trademarks,
service marks and trade names appearing in this report
are the property of their respective owners, and are
likewise used for identification purposes only.
This report is a service available
only to active Paid Premium Members.
You may opt-out of receiving report notifications
at any time. Questions or comments may be submitted
by writing to Premium Membership Services 665 S.E. 10 Street, Suite 201 Deerfield Beach, FL 33441-5634 or by calling 1-800-965-8307
or 954-785-1121.
|
|
|