You are not logged in.
This means you
CAN ONLY VIEW reports that were published prior to Thursday, March 20, 2025.
You
MUST UPGRADE YOUR MEMBERSHIP if you want to see any current reports.
AFTER MARKET UPDATE - WEDNESDAY, JANUARY 27TH, 2021
Previous After Market Report Next After Market Report >>>
|
|
|
|
DOW |
-633.87 |
30,303.17 |
-2.05% |
|
Volume |
1,742,547,411 |
+67% |
|
Volume |
10,899,015,000 |
+61% |
|
NASDAQ |
-358.42 |
13,267.64 |
-2.63% |
|
Advancers |
541 |
17% |
|
Advancers |
595 |
16% |
|
S&P 500 |
-98.85 |
3,750.77 |
-2.57% |
|
Decliners |
2,562 |
83% |
|
Decliners |
3,125 |
84% |
|
Russell 2000 |
-41.16 |
2,108.70 |
-1.91% |
|
52 Wk Highs |
118 |
|
|
52 Wk Highs |
183 |
|
|
S&P 600 |
-3.93 |
1,229.29 |
-0.32% |
|
52 Wk Lows |
33 |
|
|
52 Wk Lows |
55 |
|
|
 |
Major Indices Fell Under Heavier Distributional Pressure
Kenneth J. Gruneisen - Passed the CAN SLIM® Master's Exam
The Dow slumped 633 points, falling for a fifth straight session and turning negative for the year. The S&P 500 and Nasdaq Composite retreated from record levels reached on Monday, with each tumbling 2.6%. The volume totals were much higher than the prior session on the NYSE and on the Nasdaq exchange, action indicative of heavy distributional selling from institutional investors. Decliners led advancers by almost a 5-1 margin on the NYSE and more than a 5-1 margin on the Nasdaq exchange. There were 41 high-ranked companies from the Leaders List that hit new 52-week highs and were listed on the BreakOuts Page, versus the total of 96 on the prior session. New 52-week highs totals contracted but still outnumbered the new 52-week lows totals. The major indices have clearly seen the uptrend come under pressure (M criteria). Investors are reminded to always make buying and selling decisions based based on the strict criteria and rules of the fact-based investment system. PICTURED: The Dow Jones Industrial Average pulled back testing its 50-day moving average (DMA) line with higher volume behind its 5th consecutive loss from its record high.
U.S. stocks dropped on Wednesday, as investors weighed commentary from the Federal Reserve and awaited earnings results from some of the world’s largest companies by market cap. Also receiving outsized attention was a number of stocks that have seen share prices swell in recent days amid mass speculative trading among retail investors.
All 11 S&P 500 sectors fell more than 1% on the day. The Communication Services group lagged with a 3.8% drop, as Google parent Alphabet (GOOGL -4.57%) sank. In earnings, Microsoft (MSFT +0.26%) pared earlier gains despite easily topping analysts' earnings and revenue expectations. Starbucks (SBUX -6.51%) fell after global same-store sales fell more than anticipated. Boeing (BA -3.97%) fell after its quarterly earnings report capped a record net loss for 2020. Meanwhile, Walgreens Boots Alliance (WBA +4.05%) rose after naming Starbucks's current COO as the company's new CEO.
In central bank news, the Federal Reserve left interest rates steady following its first policy meeting of 2021. Fed Chair Jerome Powell reiterated the bank's accommodative policies during the post-meeting press conference, as officials noted the pace of the economic recovery was moderating. On the data front, December durable goods orders rose 0.2%, coming in well under projection for a 1% uptick and November's upwardly revised 1.2% rise. Treasuries advanced, with the yield on the 10-year note down three basis points to 1.01%. Elsewhere, gold slipped 0.6% to $1840.20/ounce amid a stronger dollar. |
 Kenneth J. Gruneisen started out as a licensed stockbroker in August 1987, a couple of months prior to the historic stock market crash that took the Dow Jones Industrial Average down -22.6% in a single day. He has published daily fact-based fundamental and technical analysis on high-ranked stocks online for two decades. Through FACTBASEDINVESTING.COM, Kenneth provides educational articles, news, market commentary, and other information regarding proven investment systems that work in good times and bad.
Comments contained in the body of this report are technical opinions only and are not necessarily those of Gruneisen Growth Corp. The material herein has been obtained from sources believed to be reliable and accurate, however, its accuracy and completeness cannot be guaranteed. Our firm, employees, and customers may effect transactions, including transactions contrary to any recommendation herein, or have positions in the securities mentioned herein or options with respect thereto. Any recommendation contained in this report may not be suitable for all investors and it is not to be deemed an offer or solicitation on our part with respect to the purchase or sale of any securities. |
|
 |
Semiconductor, Gold & Silver, Retail, and Financial Groups Fell
Kenneth J. Gruneisen - Passed the CAN SLIM® Master's Exam
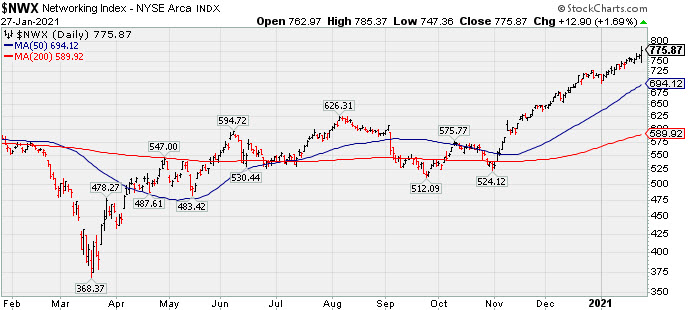
Losses for the Retail Index ($RLX -3.11%) and financials pressured the major averages as the Broker/Dealer Index ($XBD -3.17%) and Bank Index ($BKX -3.52%) both fell. The Semiconductor Index ($SOX -5.21%) led the tech sector lower and the Biotech Index ($BTK -2.45%) slumped while the Networking Index ($NWX +1.77%) posted a standout gain. The Gold & Silver Index ($XAU -4.29%) clearly was a laggard and the Oil Services Index ($OSX -1.15%) and Integrated Oil Index ($XOI -1.25%) also fell.
PICTURED: The Networking Index ($NWX +1.77%) posted a gain and is perched at a record high.
| Oil Services |
$OSX |
46.63 |
-0.54 |
-1.15% |
+5.19% |
| Integrated Oil |
$XOI |
837.56 |
-10.57 |
-1.25% |
+5.69% |
| Semiconductor |
$SOX |
2,873.88 |
-157.89 |
-5.21% |
+2.80% |
| Networking |
$NWX |
776.49 |
+13.52 |
+1.77% |
+8.28% |
| Broker/Dealer |
$XBD |
377.36 |
-12.35 |
-3.17% |
-0.06% |
| Retail |
$RLX |
3,544.42 |
-113.84 |
-3.11% |
-0.53% |
| Gold & Silver |
$XAU |
131.57 |
-5.90 |
-4.29% |
-8.75% |
| Bank |
$BKX |
98.06 |
-3.57 |
-3.52% |
+0.15% |
| Biotech |
$BTK |
5,997.68 |
-150.65 |
-2.45% |
+4.51% |
|
|
|
 |
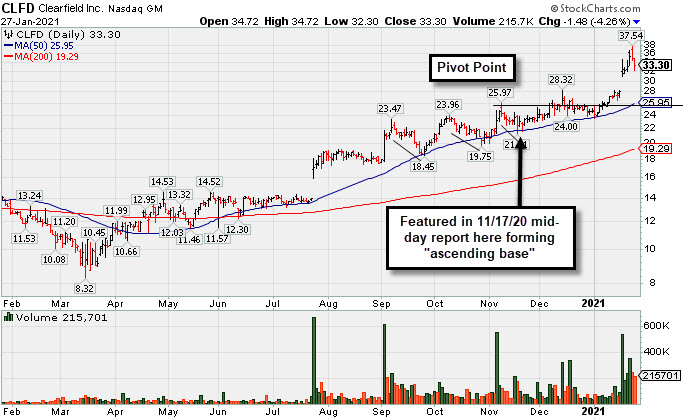
Perched Near Record High With Earnings Report Due Soon
Kenneth J. Gruneisen - Passed the CAN SLIM® Master's Exam
Clearfield Inc (CLFD -$1.48 or -4.26% to $33.30) retreated from a 2nd consecutive volume-driven loss today after 5 consecutive volume-driven gains into new high territory. Its impressive winning streak included the 1/20/21 big "breakaway gap" previously noted. Keep in mind it is due to report Dec '20 quarterly results after the close on Thursday, January 28, 2021. Volume and volatility often increase near earnings news. Prior highs in the $28 area define initial support to watch on pullbacks. It found prompt support at its 50-day moving average (DMA) line ($25.95) and upward trendline when consolidating.
The high-ranked TELECOMMUNICATIONS - Fiber Optics firm reported earnings +57% on +14% sales revenues for the Sep '20 quarter versus the year ago period, its 3rd consecutive quarterly earnings comparison above the +25% minimum guideline (C criteria). Annual earnings (A criteria) history has improved after a downturn in FY '17.
The number of top-rated funds owning its shares rose from 132 in Jun '20 to 139 in Sep '20. Its current Up/Down Volume Ratio of 2.6 is an unbiased indication its shares have been under accumulation over the past 50 days. Its Accumulation/Distribution Rating is A+ and Timeliness Rating is A, but it still has a Sponsorship Rating of D.
|
|
|
Color Codes Explained :
Y - Better candidates highlighted by our
staff of experts.
G - Previously featured
in past reports as yellow but may no longer be buyable under the
guidelines.
***Last / Change / Volume data in this table is the closing quote data***
Symbol/Exchange
Company Name
Industry Group |
PRICE |
CHANGE
(%Change) |
Day High |
Volume
(% DAV)
(% 50 day avg vol) |
52 Wk Hi
% From Hi |
Featured
Date |
Price
Featured |
Pivot Featured |
|
Max Buy |
 CRL
-
NYSE
CRL
-
NYSE
Charles River Labs Intl
DRUGS - Biotechnology
|
$252.87
|
-12.61
-4.75% |
$261.97
|
359,889
129.69% of 50 DAV
50 DAV is 277,500
|
$284.60
-11.15%
|
12/17/2020
|
$247.06
|
PP = $257.98
|
|
MB = $270.88
|
 Most Recent Note - 1/27/2021 4:58:26 PM
Y - Pulled back further with higher volume behind today's 5th consecutive loss, undercutting the prior high ($257) and raising concerns while testing support at its 50 DMA line ($249.60). Reported Sep '20 quarterly earnings +38% on +11% sales revenues versus the year ago period, above the +25% minimum earnings guideline (C criteria).
>>> FEATURED STOCK ARTICLE : Hovering in Tight Range Holding Ground Near High - 1/5/2021 |
View all notes |
Set NEW NOTE alert |
Company Profile |
SEC
News |
Chart |
Request a new note
C
A
S
I |
AMD
-
NYSE
Advanced Micro Devices
ELECTRONICS - Semiconductor - Broad Line
|
$88.84
|
-5.87
-6.20% |
$91.88
|
72,866,502
169.23% of 50 DAV
50 DAV is 43,058,500
|
$99.23
-10.47%
|
11/18/2020
|
$82.54
|
PP = $88.72
|
|
MB = $93.16
|
Most Recent Note - 1/27/2021 4:51:15 PM
G - Fundamentals remain strong after it reported Dec '20 quarterly earnings +63% on +53% sales revenues versus the year ago period. Color code is changed to green after today's damaging volume-driven loss violated the 50 DMA line ($91.14) hurting its outlook. Its current Relative Strength rating of 77 is still below the 80+ minimum guideline for buy candidates.
>>> FEATURED STOCK ARTICLE : Distributional Pressure Brings Pullback Below "Max Buy" Level - 1/13/2021 |
View all notes |
Set NEW NOTE alert |
Company Profile |
SEC
News |
Chart |
Request a new note
C
A
S
I |
TER
-
NASDAQ
Teradyne Inc
ELECTRONICS - Semiconductor Equipment and Mate
|
$130.11
|
-7.99
-5.79% |
$135.51
|
2,336,774
166.56% of 50 DAV
50 DAV is 1,403,000
|
$143.40
-9.27%
|
10/21/2020
|
$92.22
|
PP = $93.54
|
|
MB = $98.22
|
Most Recent Note - 1/27/2021 4:56:20 PM
G - Today's big volume-driven loss had it pulling back abruptly from its all-time high. It is very extended from any sound base. Support to watch on pullbacks is its 50 DMA line ($120.81). See the latest FSU analysis for more details and an annotated graph.
>>> FEATURED STOCK ARTICLE : Traded +55.5% Higher in 3 Months Since Featured - 1/25/2021 |
View all notes |
Set NEW NOTE alert |
Company Profile |
SEC
News |
Chart |
Request a new note
C
A
S
I |
AMRC
-
NYSE
Ameresco Inc Cl A
ENERGY - Alternative
|
$53.41
|
-7.34
-12.08% |
$58.68
|
780,923
187.72% of 50 DAV
50 DAV is 416,000
|
$63.45
-15.82%
|
12/15/2020
|
$46.72
|
PP = $47.10
|
|
MB = $49.46
|
Most Recent Note - 1/27/2021 4:47:59 PM
G - Suffered a large volume-driven loss today retreating from its all-time high. It remains very extended from any sound base. Its 50 DMA line ($50.05) and prior highs in the $46-47 area define important near-term support to watch.
>>> FEATURED STOCK ARTICLE : Very Extended From Base After Another Powerful Gain - 1/6/2021 |
View all notes |
Set NEW NOTE alert |
Company Profile |
SEC
News |
Chart |
Request a new note
C
A
S
I |
TREX
-
NYSE
Trex Company Inc
MATERIALS and CONSTRUCTION - General Building Materials
|
$94.19
|
-3.84
-3.92% |
$98.83
|
1,068,714
156.02% of 50 DAV
50 DAV is 685,000
|
$104.35
-9.74%
|
6/26/2020
|
$54.53
|
PP = $66.47
|
|
MB = $69.79
|
Most Recent Note - 1/25/2021 1:10:40 PM
G - Off earlier highs after rallying for new all-time highs with 4 consecutive gains. Prior highs in the $80-81 area define important support to watch coinciding with its 50 DMA line ($81.89). Sep '20 quarterly earnings were +14% on +19% sales revenues versus the year ago period, below the +25% minimum guideline (C criteria) raising fundamental concerns.
>>> FEATURED STOCK ARTICLE : Hit New All-Time High With Gain Backed by Average Volume - 1/19/2021 |
View all notes |
Set NEW NOTE alert |
Company Profile |
SEC
News |
Chart |
Request a new note
C
A
S
I |
Symbol/Exchange
Company Name
Industry Group |
PRICE |
CHANGE
(%Change) |
Day High |
Volume
(% DAV)
(% 50 day avg vol) |
52 Wk Hi
% From Hi |
Featured
Date |
Price
Featured |
Pivot Featured |
|
Max Buy |
CLFD
-
NASDAQ
Clearfield Inc
TELECOMMUNICATIONS - Cables / Satalite Equipment
|
$33.30
|
-1.48
-4.26% |
$34.72
|
215,701
192.59% of 50 DAV
50 DAV is 112,000
|
$37.54
-11.29%
|
1/20/2021
|
$31.38
|
PP = $28.42
|
|
MB = $29.84
|
Most Recent Note - 1/27/2021 4:43:05 PM
G - Due to report Dec '20 quarterly earnings results after the close on Thursday, 1/28/21. Suffered a 2nd consecutive loss today after 5 consecutive volume-driven gains into new high territory, an impressive winning streak including the 1/20/21 big "breakaway gap" previously noted. Prior highs in the $28 area define initial support to watch on pullbacks. Found prompt support at its 50 DMA line and upward trendline when consolidating. See the latest FSU analysis for more details and a new annotated graph.
>>> FEATURED STOCK ARTICLE : Perched Near Record High With Earnings Report Due Soon - 1/27/2021 |
View all notes |
Set NEW NOTE alert |
Company Profile |
SEC
News |
Chart |
Request a new note
C
A
S
I |
NOW
-
NYSE
Servicenow Inc
Computer Sftwr-Enterprse
|
$516.50
|
-15.96
-3.00% |
$533.07
|
2,207,039
175.08% of 50 DAV
50 DAV is 1,260,600
|
$566.74
-8.86%
|
8/20/2020
|
$453.34
|
PP = $454.79
|
|
MB = $477.53
|
Most Recent Note - 1/26/2021 6:09:00 PM
G - Consolidating near its 50 DMA line ($530). Due to report Dec '20 quarterly results on 1/27/21. Fundamental concerns were raised when it reported Sep '20 quarterly earnings +22% on +30% sales revenues versus the year ago period, below the +25% minimum guideline (C criteria) of the fact-based investment system.
>>> FEATURED STOCK ARTICLE : Gain Today and Rebound Above 50-Day Moving Average Line - 1/8/2021 |
View all notes |
Set NEW NOTE alert |
Company Profile |
SEC
News |
Chart |
Request a new note
C
A
S
I |
SMPL
-
NASDAQ
Simply Good Foods Co
Food-Confectionery
|
$28.53
|
-0.44
-1.52% |
$28.84
|
808,939
63.39% of 50 DAV
50 DAV is 1,276,100
|
$32.03
-10.93%
|
12/28/2020
|
$30.40
|
PP = $31.44
|
|
MB = $33.01
|
Most Recent Note - 1/25/2021 6:07:30 PM
G - Posted a big gain today with lighter than average volume. Its Relative Strength Rating is still 68, well below the 80+ minimum guideline. See the latest FSU analysis for more details and an annotated graph.
>>> FEATURED STOCK ARTICLE : Relative Strength Rating Suffered During Stalling Action - 1/21/2021 |
View all notes |
Set NEW NOTE alert |
Company Profile |
SEC
News |
Chart |
Request a new note
C
A
S
I |
ALRM
-
NASDAQ
Alarm.com Holdings Inc
Security/Sfty
|
$97.82
|
+1.24
1.28% |
$98.55
|
584,309
127.02% of 50 DAV
50 DAV is 460,000
|
$108.67
-9.98%
|
11/6/2020
|
$71.88
|
PP = $74.76
|
|
MB = $78.50
|
Most Recent Note - 1/22/2021 4:54:12 PM
G - Posted a small gain today with lighter volume. Encountered distributional pressure after a big rally. Its 50 DMA line ($87) defines important near-term support to watch.
>>> FEATURED STOCK ARTICLE : Encountered Distributional Pressure After Big Rally - 1/20/2021 |
View all notes |
Set NEW NOTE alert |
Company Profile |
SEC
News |
Chart |
Request a new note
C
A
S
I |
TEAM
-
NASDAQ
Atlassian Corp Plc
Comp Sftwr-Spec Enterprs
|
$217.30
|
-6.58
-2.94% |
$222.49
|
2,226,680
145.34% of 50 DAV
50 DAV is 1,532,100
|
$250.03
-13.09%
|
10/12/2020
|
$193.77
|
PP = $199.60
|
|
MB = $209.58
|
Most Recent Note - 1/26/2021 6:05:25 PM
G - Volume was higher (near average) behind today's big loss as it slumped to close below its 50 DMA line ($226) raising concerns. Prior high in the $216 area defines the next important near-term support to watch. However, its current Relative Strength Rating is 59, below the +80 minimum guideline for buy candidates. Earnings rose +7% on +26% sales revenues for the Sep '20 quarter versus the year ago period, below the +25% minimum earnings guideline (C criteria), raising fundamental concerns.
>>> FEATURED STOCK ARTICLE : Relative Strength Rating Remains Below 80+ Minimum Guideline - 1/11/2021 |
View all notes |
Set NEW NOTE alert |
Company Profile |
SEC
News |
Chart |
Request a new note
C
A
S
I |
Symbol/Exchange
Company Name
Industry Group |
PRICE |
CHANGE
(%Change) |
Day High |
Volume
(% DAV)
(% 50 day avg vol) |
52 Wk Hi
% From Hi |
Featured
Date |
Price
Featured |
Pivot Featured |
|
Max Buy |
SHOP
-
NYSE
Shopify Inc Cl A
Computer Sftwr-Enterprse
|
$1,092.08
|
-67.69
-5.84% |
$1,149.92
|
1,601,165
124.90% of 50 DAV
50 DAV is 1,282,000
|
$1,285.19
-15.03%
|
12/16/2020
|
$1,146.00
|
PP = $1,147.01
|
|
MB = $1,204.36
|
Most Recent Note - 1/27/2021 4:54:10 PM
G - Violated its 50 DMA line ($1,105) with today's big volume-driven loss raising concerns and its color code is changed to green. Prior low ($1,076 on 1/06/21) defines the next important support to watch.
>>> FEATURED STOCK ARTICLE : Rebounded After Undercutting Prior Highs - 1/7/2021 |
View all notes |
Set NEW NOTE alert |
Company Profile |
SEC
News |
Chart |
Request a new note
C
A
S
I |
YETI
-
NYSE
Yeti Holdings Inc
Leisure-Products
|
$68.05
|
+0.22
0.32% |
$71.40
|
1,575,278
114.07% of 50 DAV
50 DAV is 1,381,000
|
$80.89
-15.87%
|
11/5/2020
|
$57.25
|
PP = $55.14
|
|
MB = $57.90
|
Most Recent Note - 1/22/2021 4:51:10 PM
G - Consolidating above the prior low ($67) and its 50 DMA line ($67.53) which coincide defining important near-term support to watch. Gapped down for 2 consecutive sessions following a "negative reversal" noted at its all-time high. See the latest FSU analysis for more details and a new annotated graph.
>>> FEATURED STOCK ARTICLE : 50-Day Moving Average and Prior Lows Define Near-Term Support - 1/22/2021 |
View all notes |
Set NEW NOTE alert |
Company Profile |
SEC
News |
Chart |
Request a new note
C
A
S
I |
DOCU
-
NASDAQ
Docusign Inc
Computer Sftwr-Enterprse
|
$225.19
|
-9.92
-4.22% |
$232.85
|
3,751,541
106.43% of 50 DAV
50 DAV is 3,525,000
|
$290.23
-22.41%
|
1/12/2021
|
$253.50
|
PP = $256.10
|
|
MB = $268.91
|
Most Recent Note - 1/27/2021 5:01:40 PM
G - Color code is changed to green after today's 3rd big loss with near average volume raised concerns and triggered a technical sell signal by violating its 50 DMA line ($233). Only a prompt rebound above the 50 DMA line would help its outlook improve. The prior low ($216.50 on 1/04/21) defines the next important support to watch. Fundamentals remain strong.
>>> FEATURED STOCK ARTICLE : Twice Average Volume Behind Breakout Gain - 1/12/2021 |
View all notes |
Set NEW NOTE alert |
Company Profile |
SEC
News |
Chart |
Request a new note
C
A
S
I |
AAXN
-
NASDAQ
Axon Enterprise Inc
Security/Sfty
|
$170.04
|
-6.61
-3.74% |
$176.65
|
657,531
108.52% of 50 DAV
50 DAV is 605,900
|
$180.69
-5.89%
|
12/22/2020
|
$127.84
|
PP = $130.51
|
|
MB = $137.04
|
Most Recent Note - 1/25/2021 6:05:38 PM
G - Getting more extended from any sound base, it hit yet another new all-time high with today's gain on average volume. Prior high ($134) defines initial support to watch. Found prompt support near its 50 DMA line ($130) during the recent consolidation. Fundamentals remain strong.
>>> FEATURED STOCK ARTICLE : Hit New Highs With Streak of Big Volume-Driven Gains - 1/15/2021 |
View all notes |
Set NEW NOTE alert |
Company Profile |
SEC
News |
Chart |
Request a new note
C
A
S
I |
QTWO
-
NYSE
Q2 Holdings Inc
Computer Sftwr-Financial
|
$136.20
|
-3.12
-2.24% |
$139.24
|
777,500
163.34% of 50 DAV
50 DAV is 476,000
|
$142.76
-4.60%
|
11/12/2020
|
$105.14
|
PP = $106.54
|
|
MB = $111.87
|
Most Recent Note - 1/26/2021 6:02:04 PM
G - Perched at its all-time high, extended from any sound base. Its 50 DMA line ($121.54) defines important near term support to watch on pullbacks. See the latest FSU analysis for more details and a new annotated graph.
>>> FEATURED STOCK ARTICLE : Perched Near All-Time High Stubbornly Holding Ground - 1/26/2021 |
View all notes |
Set NEW NOTE alert |
Company Profile |
SEC
News |
Chart |
Request a new note
C
A
S
I |
Symbol/Exchange
Company Name
Industry Group |
PRICE |
CHANGE
(%Change) |
Day High |
Volume
(% DAV)
(% 50 day avg vol) |
52 Wk Hi
% From Hi |
Featured
Date |
Price
Featured |
Pivot Featured |
|
Max Buy |
|
|
|
THESE ARE NOT BUY RECOMMENDATIONS!
Comments contained in the body of this report are technical
opinions only. The material herein has been obtained
from sources believed to be reliable and accurate, however,
its accuracy and completeness cannot be guaranteed.
This site is not an investment advisor, hence it does
not endorse or recommend any securities or other investments.
Any recommendation contained in this report may not
be suitable for all investors and it is not to be deemed
an offer or solicitation on our part with respect to
the purchase or sale of any securities. All trademarks,
service marks and trade names appearing in this report
are the property of their respective owners, and are
likewise used for identification purposes only.
This report is a service available
only to active Paid Premium Members.
You may opt-out of receiving report notifications
at any time. Questions or comments may be submitted
by writing to Premium Membership Services 665 S.E. 10 Street, Suite 201 Deerfield Beach, FL 33441-5634 or by calling 1-800-965-8307
or 954-785-1121.
|
|
|