You are not logged in.
This means you
CAN ONLY VIEW reports that were published prior to Thursday, March 20, 2025.
You
MUST UPGRADE YOUR MEMBERSHIP if you want to see any current reports.
AFTER MARKET UPDATE - TUESDAY, JANUARY 12TH, 2021
Previous After Market Report Next After Market Report >>>
|
|
|
|
DOW |
+60.00 |
31,068.69 |
+0.19% |
|
Volume |
1,055,690,699 |
+10% |
|
Volume |
7,226,381,900 |
+6% |
|
NASDAQ |
+47.44 |
13,083.87 |
+0.36% |
|
Advancers |
2,086 |
66% |
|
Advancers |
2,591 |
69% |
|
S&P 500 |
+1.58 |
3,801.19 |
+0.04% |
|
Decliners |
1,051 |
33% |
|
Decliners |
1,162 |
31% |
|
Russell 2000 |
+36.95 |
2,127.96 |
+1.77% |
|
52 Wk Highs |
354 |
|
|
52 Wk Highs |
477 |
|
|
S&P 600 |
+20.24 |
1,215.46 |
+1.69% |
|
52 Wk Lows |
11 |
|
|
52 Wk Lows |
11 |
|
|
 |
Leadership Improved With Positive Breadth as Major Indices Rose
Kenneth J. Gruneisen - Passed the CAN SLIM® Master's Exam
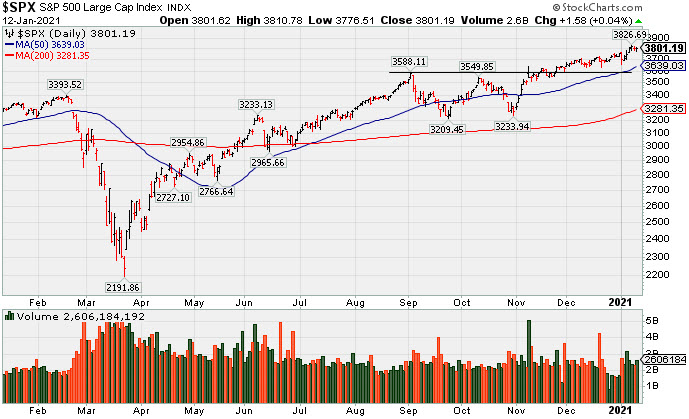
The Dow climbed 60 points, while the S&P 500 advanced less than 0.1%. The Nasdaq Composite rose 0.3%. The volume totals were higher than the prior session on both the NYSE and the Nasdaq exchange. Breadth was positive as advancers led decliners by a 2-1 margin on the NYSE and on the Nasdaq exchange. There were 124 high-ranked companies from the Leaders List that hit new 52-week highs and were listed on the BreakOuts Page, up from 72 total on the prior session. New 52-week highs totals expanded and easily outnumbered the new 52-week lows totals on both exchanges. The major indices are in a confirmed uptrend (M criteria). Investors are reminded to always make buying and selling decisions based based on the strict criteria and rules of the fact-based investment system. PICTURED: The S&P 500 Index is perched near its record high.
U.S. major averages toggled between small gains and losses before pushing higher on Tuesday, as investors focused on the prospects of an economic recovery and anticipated the unofficial start of fourth quarter earnings season. Market participants also kept tabs on the bond market as Treasuries reversed early session declines to advance for the first time in seven days. The yield on the benchmark 10-year note climbed as high as 1.18% before ending one basis point lower to 1.13%.
Six of 11 S&P 500 sectors finished in positive territory. Energy outperformed for a second day, with WTI crude adding 1.7% to $53.12/barrel. Consumer Discretionary stocks also outperformed, with online retailer Etsy (ETSY +12.08%) rose following positive analyst comments. In other corporate news, Intel (INTC +3.30%) rose after the company unveiled new line of computer chips. Albertsons (ACI +2.09%) rose after the grocer easily topped Wall Street's earnings estimates and upwardly revised its 2020 fiscal year EPS expectations.
On the data front, a report from the National Federation of Independent Business (NFIB) showed small business optimism declined more than anticipated in December. The Jobs Opening and Labor Turnover Survey revealed the number of jobs fell modestly to 6.5 million in November from the prior month's 6.6 million. In commodities, gold rose 0.3% to $1855.60/ounce amid a 0.5% drop in the U.S. dollar index. |
 Kenneth J. Gruneisen started out as a licensed stockbroker in August 1987, a couple of months prior to the historic stock market crash that took the Dow Jones Industrial Average down -22.6% in a single day. He has published daily fact-based fundamental and technical analysis on high-ranked stocks online for two decades. Through FACTBASEDINVESTING.COM, Kenneth provides educational articles, news, market commentary, and other information regarding proven investment systems that work in good times and bad.
Comments contained in the body of this report are technical opinions only and are not necessarily those of Gruneisen Growth Corp. The material herein has been obtained from sources believed to be reliable and accurate, however, its accuracy and completeness cannot be guaranteed. Our firm, employees, and customers may effect transactions, including transactions contrary to any recommendation herein, or have positions in the securities mentioned herein or options with respect thereto. Any recommendation contained in this report may not be suitable for all investors and it is not to be deemed an offer or solicitation on our part with respect to the purchase or sale of any securities. |
|
 |
Energy Groups Post Standout Gains; Financial, Retail, and Tech Rose
Kenneth J. Gruneisen - Passed the CAN SLIM® Master's Exam
The Bank Index ($BKX +1.63%) and Broker/Dealer Index ($XBD +0.81%) posted influential gain and the Retail Index ($RLX +0.86%) also helped boost the major averages. The Oil Services Index ($OSX +6.25%) and Integrated Oil Index ($XOI +3.44%) posted standout gains. The Networking Index ($NWX +1.58%) led the tech sector higher and the Semiconductor Index ($SOX +0.68%) also posted a modest gain, but the Biotech Index ($BTK -0.21%) ended slightly lower. The Gold & Silver Index ($XAU +0.55%) posted a small gain.
PICTURED: The Networking Index ($NWX +1.58%) rallied to a new all-time high.
| Oil Services |
$OSX |
53.74 |
+3.16 |
+6.25% |
+21.23% |
| Integrated Oil |
$XOI |
907.14 |
+30.18 |
+3.44% |
+14.47% |
| Semiconductor |
$SOX |
2,990.24 |
+20.33 |
+0.68% |
+6.97% |
| Networking |
$NWX |
741.28 |
+11.52 |
+1.58% |
+3.37% |
| Broker/Dealer |
$XBD |
401.35 |
+3.22 |
+0.81% |
+6.29% |
| Retail |
$RLX |
3,564.60 |
+30.54 |
+0.86% |
+0.04% |
| Gold & Silver |
$XAU |
144.74 |
+0.79 |
+0.55% |
+0.38% |
| Bank |
$BKX |
109.22 |
+1.75 |
+1.63% |
+11.55% |
| Biotech |
$BTK |
6,003.48 |
-12.63 |
-0.21% |
+4.61% |
|
|
|
 |
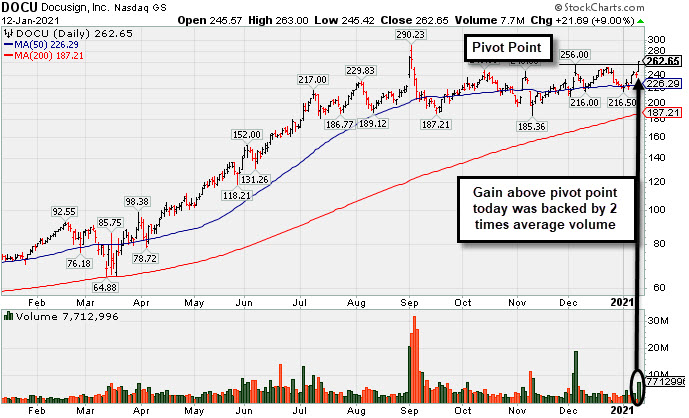
Twice Average Volume Behind Breakout Gain
Kenneth J. Gruneisen - Passed the CAN SLIM® Master's Exam
Docusign Inc (DOCU +$21.69 or +9.00% to $262.65) finished strong after highlighted in yellow with pivot point cited based on its 12/04/20 high plus 10 cents in the earlier mid-day report (read here). The big gain and close above the pivot point backed by twice average volume clinched a new technical buy signal. Little resistance remains dur to overhead supply up to the $293 level. During the 6-week flat base it found support near its 50-day moving average (DMA) line ($226.29).
Fundamentals remained strong after it was dropped from the Featured Stocks list on 9/11/20. It reported very strong July and Oct '20 quarterly results versus the year ago periods. It has an Earnings Per Share Rating of 75.
The past 5 quarterly comparisons versus the year ago period were well above the +25% minimum guideline with solid underlying sales revenues growth. After years of losses it had solid earnings in FY '19 and '20.
The number of top-rated funds owning its shares rose from 558 on Jun '19 to 1,375 in Dec '20, a reassuring sign concerning the I criteria. Its current Up/Down Volume Ratio of 1.9 also is an unbiased indication its shares have been under accumulation over the past 50 days. The Computer Software-Enterprise industry group is currently ranked 118th of the 197 Industry Groups (L criteria), however there are several strong stocks in the group showing confirming leadership.
|
|
|
Color Codes Explained :
Y - Better candidates highlighted by our
staff of experts.
G - Previously featured
in past reports as yellow but may no longer be buyable under the
guidelines.
***Last / Change / Volume data in this table is the closing quote data***
Symbol/Exchange
Company Name
Industry Group |
PRICE |
CHANGE
(%Change) |
Day High |
Volume
(% DAV)
(% 50 day avg vol) |
52 Wk Hi
% From Hi |
Featured
Date |
Price
Featured |
Pivot Featured |
|
Max Buy |
 CRL
-
NYSE
CRL
-
NYSE
Charles River Labs Intl
DRUGS - Biotechnology
|
$268.24
|
-8.07
-2.92% |
$278.08
|
336,372
110.29% of 50 DAV
50 DAV is 305,000
|
$276.87
-3.12%
|
12/17/2020
|
$247.06
|
PP = $257.98
|
|
MB = $270.88
|
 Most Recent Note - 1/12/2021 7:02:13 PM
Y - Pulled back today breaking a streak of 5 consecutive gains for new all-time highs. Recent gains above its pivot point backed by at least +40% above average volume helped clinch a proper new (or add-on) technical buy signal. Its 50 DMA line ($242.91) acted as support. Reported Sep '20 quarterly earnings +38% on +11% sales revenues versus the year ago period, above the +25% minimum earnings guideline (C criteria).
>>> FEATURED STOCK ARTICLE : Hovering in Tight Range Holding Ground Near High - 1/5/2021 |
View all notes |
Set NEW NOTE alert |
Company Profile |
SEC
News |
Chart |
Request a new note
C
A
S
I |
AMD
-
NASDAQ
Advanced Micro Devices
ELECTRONICS - Semiconductor - Broad Line
|
$95.36
|
-1.90
-1.95% |
$98.97
|
67,608,758
158.74% of 50 DAV
50 DAV is 42,590,000
|
$99.23
-3.91%
|
11/18/2020
|
$82.54
|
PP = $88.72
|
|
MB = $93.16
|
Most Recent Note - 1/11/2021 12:33:03 PM
G - Hitting a new all-time high with today's big gain. Its recent lows and 50 DMA line ($88.63) defines important near term support to watch on pullbacks.
>>> FEATURED STOCK ARTICLE : Pulling Back From its Record High Hit Last Week - 12/21/2020 |
View all notes |
Set NEW NOTE alert |
Company Profile |
SEC
News |
Chart |
Request a new note
C
A
S
I |
TER
-
NASDAQ
Teradyne Inc
ELECTRONICS - Semiconductor Equipment and Mate
|
$137.09
|
+1.39
1.02% |
$139.53
|
1,478,863
101.57% of 50 DAV
50 DAV is 1,456,000
|
$136.45
0.47%
|
10/21/2020
|
$92.22
|
PP = $93.54
|
|
MB = $98.22
|
Most Recent Note - 1/11/2021 12:24:44 PM
G - Hitting yet another new all-time high with today's 5th consecutive gain, very extended from any sound base. Support to watch on pullbacks is its 50 DMA line ($111.55).
>>> FEATURED STOCK ARTICLE : Perched Near Record High Very Extended From Any Sound Base - 12/30/2020 |
View all notes |
Set NEW NOTE alert |
Company Profile |
SEC
News |
Chart |
Request a new note
C
A
S
I |
AMRC
-
NYSE
Ameresco Inc Cl A
ENERGY - Alternative
|
$59.94
|
+1.16
1.97% |
$60.00
|
509,105
121.50% of 50 DAV
50 DAV is 419,000
|
$63.45
-5.53%
|
12/15/2020
|
$46.72
|
PP = $47.10
|
|
MB = $49.46
|
Most Recent Note - 1/11/2021 11:56:48 AM
G - Pulling back from its all-time high with today's loss after 4 consecutive volume-driven gains, getting very extended from any sound base. Its 50 DMA line ($46.45) and prior highs in the $46-47 area define important near-term support to watch on pullbacks.
>>> FEATURED STOCK ARTICLE : Very Extended From Base After Another Powerful Gain - 1/6/2021 |
View all notes |
Set NEW NOTE alert |
Company Profile |
SEC
News |
Chart |
Request a new note
C
A
S
I |
TREX
-
NYSE
Trex Company Inc
MATERIALS and CONSTRUCTION - General Building Materials
|
$91.88
|
+1.91
2.12% |
$91.95
|
481,209
62.33% of 50 DAV
50 DAV is 772,000
|
$92.33
-0.49%
|
6/26/2020
|
$54.53
|
PP = $66.47
|
|
MB = $69.79
|
Most Recent Note - 1/12/2021 7:05:52 PM
G - Posted another gain today with light volume for a best ever close. Prior highs in the $80-81 area define initial support to watch above its 50 DMA line ($78.34). Recently noted that it reported Sep '20 quarterly earnings +14% on +19% sales revenues versus the year ago period, below the +25% minimum guideline (C criteria) raising fundamental concerns.
>>> FEATURED STOCK ARTICLE : Hit New High With Light Volume Behind 4th Consecutive Gain - 12/22/2020 |
View all notes |
Set NEW NOTE alert |
Company Profile |
SEC
News |
Chart |
Request a new note
C
A
S
I |
Symbol/Exchange
Company Name
Industry Group |
PRICE |
CHANGE
(%Change) |
Day High |
Volume
(% DAV)
(% 50 day avg vol) |
52 Wk Hi
% From Hi |
Featured
Date |
Price
Featured |
Pivot Featured |
|
Max Buy |
CLFD
-
NASDAQ
Clearfield Inc
TELECOMMUNICATIONS - Cables / Satalite Equipment
|
$27.18
|
+1.13
4.34% |
$27.25
|
60,356
59.76% of 50 DAV
50 DAV is 101,000
|
$28.32
-4.03%
|
11/17/2020
|
$22.06
|
PP = $26.07
|
|
MB = $27.37
|
Most Recent Note - 1/12/2021 6:59:48 PM
Y - Posted a 6th consecutive gain today with light volume for a best-ever close. Volume totals have been cooling while hovering within striking distance of its 52-week high. Recently found prompt support at its 50 DMA line ($24.28) and upward trendline when consolidating.
>>> FEATURED STOCK ARTICLE : Distributional Pressure While Testing Important Chart Support - 1/4/2021 |
View all notes |
Set NEW NOTE alert |
Company Profile |
SEC
News |
Chart |
Request a new note
C
A
S
I |
NOW
-
NYSE
Servicenow Inc
Computer Sftwr-Enterprse
|
$513.21
|
-9.85
-1.88% |
$522.51
|
1,172,955
84.05% of 50 DAV
50 DAV is 1,395,500
|
$566.74
-9.45%
|
8/20/2020
|
$453.34
|
PP = $454.79
|
|
MB = $477.53
|
Most Recent Note - 1/8/2021 5:29:46 PM
G - Today's big gain and rebound above its 50 DMA line ($524) helped its outlook improve. Recently reported Sep '20 quarterly earnings +22% on +30% sales revenues versus the year ago period, below the +25% minimum guideline (C criteria) of the fact-based investment system. See the latest FSU analysis for more details and a new annotated graph.
>>> FEATURED STOCK ARTICLE : Gain Today and Rebound Above 50-Day Moving Average Line - 1/8/2021 |
View all notes |
Set NEW NOTE alert |
Company Profile |
SEC
News |
Chart |
Request a new note
C
A
S
I |
SMPL
-
NASDAQ
Simply Good Foods Co
Food-Confectionery
|
$28.71
|
-0.72
-2.45% |
$29.78
|
967,194
70.26% of 50 DAV
50 DAV is 1,376,600
|
$32.03
-10.37%
|
12/28/2020
|
$30.40
|
PP = $31.44
|
|
MB = $33.01
|
Most Recent Note - 1/12/2021 7:08:12 PM
Y - Pulled back today for a 3rd consecutive loss on light volume. Quietly consolidating after a "negative reversal" on 1/04/21 at its all-time high. Subsequent gains above its pivot point backed by at least +40% above average volume may trigger a technical buy signal.
>>> FEATURED STOCK ARTICLE : Challenging All-Time High as it Joins Small Cap Index - 12/28/2020 |
View all notes |
Set NEW NOTE alert |
Company Profile |
SEC
News |
Chart |
Request a new note
C
A
S
I |
ALRM
-
NASDAQ
Alarm.com Holdings Inc
Security/Sfty
|
$106.00
|
+1.15
1.10% |
$106.97
|
606,217
137.78% of 50 DAV
50 DAV is 440,000
|
$107.18
-1.10%
|
11/6/2020
|
$71.88
|
PP = $74.76
|
|
MB = $78.50
|
Most Recent Note - 1/12/2021 6:58:33 PM
G - Posted a small gain today with above average volume for a best ever close. Very extended from any sound base. Its 50 DMA line ($82.29) and prior high ($74.66 on 7/23/20) define important near-term support to watch on pullbacks.
>>> FEATURED STOCK ARTICLE : Perched at High After Impressive Streak of Gains - 12/24/2020 |
View all notes |
Set NEW NOTE alert |
Company Profile |
SEC
News |
Chart |
Request a new note
C
A
S
I |
TEAM
-
NASDAQ
Atlassian Corp Plc
Comp Sftwr-Spec Enterprs
|
$234.19
|
+3.52
1.53% |
$235.80
|
933,505
53.86% of 50 DAV
50 DAV is 1,733,300
|
$250.03
-6.34%
|
10/12/2020
|
$193.77
|
PP = $199.60
|
|
MB = $209.58
|
Most Recent Note - 1/11/2021 5:52:39 PM
G - Consolidating above its 50 DMA line ($218.81) and prior high in the $216 area which define important near-term support to watch. Its current Relative Strength Rating is 75, below the +80 minimum guideline for buy candidates. Earnings rose +7% on +26% sales revenues for the Sep '20 quarter versus the year ago period, below the +25% minimum earnings guideline (C criteria), raising concerns. See the latest FSU analysis for more details and a new annotated graph.
>>> FEATURED STOCK ARTICLE : Relative Strength Rating Remains Below 80+ Minimum Guideline - 1/11/2021 |
View all notes |
Set NEW NOTE alert |
Company Profile |
SEC
News |
Chart |
Request a new note
C
A
S
I |
Symbol/Exchange
Company Name
Industry Group |
PRICE |
CHANGE
(%Change) |
Day High |
Volume
(% DAV)
(% 50 day avg vol) |
52 Wk Hi
% From Hi |
Featured
Date |
Price
Featured |
Pivot Featured |
|
Max Buy |
SHOP
-
NYSE
Shopify Inc Cl A
Computer Sftwr-Enterprse
|
$1,188.24
|
+10.60
0.90% |
$1,205.79
|
902,208
59.05% of 50 DAV
50 DAV is 1,528,000
|
$1,285.19
-7.54%
|
12/16/2020
|
$1,146.00
|
PP = $1,147.01
|
|
MB = $1,204.36
|
Most Recent Note - 1/12/2021 7:04:32 PM
Y - Volume totals have been cooling while consolidating. Found prompt support near prior highs in the $1,146-1,130 area and above its 50 DMA line ($1,060) which defines the next important support to watch.
>>> FEATURED STOCK ARTICLE : Rebounded After Undercutting Prior Highs - 1/7/2021 |
View all notes |
Set NEW NOTE alert |
Company Profile |
SEC
News |
Chart |
Request a new note
C
A
S
I |
YETI
-
NYSE
Yeti Holdings Inc
Leisure-Products
|
$78.04
|
+2.09
2.75% |
$78.19
|
713,387
59.35% of 50 DAV
50 DAV is 1,202,000
|
$76.74
1.69%
|
11/5/2020
|
$57.25
|
PP = $55.14
|
|
MB = $57.90
|
Most Recent Note - 1/12/2021 7:07:05 PM
G - Hit yet another new all-time high with today's 8th consecutive gain, getting more extended from any sound base. Its 50 DMA line ($64.67) defines initial support to watch on pullbacks.
>>> FEATURED STOCK ARTICLE : Pulling Back After Recently Wedging to New Highs - 12/29/2020 |
View all notes |
Set NEW NOTE alert |
Company Profile |
SEC
News |
Chart |
Request a new note
C
A
S
I |
DOCU
-
NASDAQ
Docusign Inc
Computer Sftwr-Enterprse
|
$262.65
|
+21.69
9.00% |
$263.00
|
7,714,533
201.48% of 50 DAV
50 DAV is 3,829,000
|
$290.23
-9.50%
|
1/12/2021
|
$253.50
|
PP = $256.10
|
|
MB = $268.91
|
Most Recent Note - 1/12/2021 6:52:54 PM
Y - Finished strong today after highlighted in yellow with pivot point cited based on its 12/04/20 high plus 10 cents in the earlier mid-day report. The big gain and strong close above the pivot point backed by twice average volume clinched a technical buy signal. Recently found support near its 50 DMA line. Fundamentals remain strong. See the latest FSU analysis for more details and a new annotated graph.
>>> FEATURED STOCK ARTICLE : Twice Average Volume Behind Breakout Gain - 1/12/2021 |
View all notes |
Set NEW NOTE alert |
Company Profile |
SEC
News |
Chart |
Request a new note
C
A
S
I |
AAXN
-
NASDAQ
Axon Enterprise Inc
Security/Sfty
|
$135.00
|
+10.16
8.14% |
$135.05
|
1,237,378
228.93% of 50 DAV
50 DAV is 540,500
|
$134.73
0.20%
|
12/22/2020
|
$127.84
|
PP = $130.51
|
|
MB = $137.04
|
Most Recent Note - 1/12/2021 6:56:24 PM
Y - Hit a new all-time high with +128% above average volume behind today's big gain helping clinch a convincing technical buy signal. Rallied from support at its 50 DMA line ($121.97). Fundamentals remain strong.
>>> FEATURED STOCK ARTICLE : New All-Time High With Today's 5th Consecutive Gain - 12/23/2020 |
View all notes |
Set NEW NOTE alert |
Company Profile |
SEC
News |
Chart |
Request a new note
C
A
S
I |
QTWO
-
NYSE
Q2 Holdings Inc
Computer Sftwr-Financial
|
$128.00
|
+0.84
0.66% |
$128.92
|
1,621,697
371.95% of 50 DAV
50 DAV is 436,000
|
$130.59
-1.98%
|
11/12/2020
|
$105.14
|
PP = $106.54
|
|
MB = $111.87
|
Most Recent Note - 1/8/2021 5:31:28 PM
G - Posted a 2nd consecutive gain today on light volume while hovering near its all-time high. Its 50 DMA line ($113.77) defines important near term support to watch above the prior high in the $106 area.
>>> FEATURED STOCK ARTICLE : Stubbornly Holding Ground Extended From Prior Base - 12/31/2020 |
View all notes |
Set NEW NOTE alert |
Company Profile |
SEC
News |
Chart |
Request a new note
C
A
S
I |
Symbol/Exchange
Company Name
Industry Group |
PRICE |
CHANGE
(%Change) |
Day High |
Volume
(% DAV)
(% 50 day avg vol) |
52 Wk Hi
% From Hi |
Featured
Date |
Price
Featured |
Pivot Featured |
|
Max Buy |
|
|
|
THESE ARE NOT BUY RECOMMENDATIONS!
Comments contained in the body of this report are technical
opinions only. The material herein has been obtained
from sources believed to be reliable and accurate, however,
its accuracy and completeness cannot be guaranteed.
This site is not an investment advisor, hence it does
not endorse or recommend any securities or other investments.
Any recommendation contained in this report may not
be suitable for all investors and it is not to be deemed
an offer or solicitation on our part with respect to
the purchase or sale of any securities. All trademarks,
service marks and trade names appearing in this report
are the property of their respective owners, and are
likewise used for identification purposes only.
This report is a service available
only to active Paid Premium Members.
You may opt-out of receiving report notifications
at any time. Questions or comments may be submitted
by writing to Premium Membership Services 665 S.E. 10 Street, Suite 201 Deerfield Beach, FL 33441-5634 or by calling 1-800-965-8307
or 954-785-1121.
|
|
|