You are not logged in.
This means you
CAN ONLY VIEW reports that were published prior to Thursday, March 20, 2025.
You
MUST UPGRADE YOUR MEMBERSHIP if you want to see any current reports.
AFTER MARKET UPDATE - TUESDAY, JANUARY 26TH, 2021
Previous After Market Report Next After Market Report >>>
|
|
|
|
DOW |
-22.96 |
30,937.04 |
-0.07% |
|
Volume |
1,045,549,388 |
-12% |
|
Volume |
6,752,342,100 |
-5% |
|
NASDAQ |
-7.90 |
13,628.09 |
-0.06% |
|
Advancers |
1,283 |
41% |
|
Advancers |
1,417 |
37% |
|
S&P 500 |
-5.74 |
3,849.62 |
-0.15% |
|
Decliners |
1,852 |
59% |
|
Decliners |
2,397 |
63% |
|
Russell 2000 |
-13.42 |
2,149.86 |
-0.62% |
|
52 Wk Highs |
147 |
|
|
52 Wk Highs |
261 |
|
|
S&P 600 |
+0.39 |
1,233.22 |
+0.03% |
|
52 Wk Lows |
3 |
|
|
52 Wk Lows |
8 |
|
|
 |
Major Indices Slipped Slightly From Record Levels
Kenneth J. Gruneisen - Passed the CAN SLIM® Master's Exam
The Dow slipped 22 points, while the S&P 500 and Nasdaq Composite edged 0.2% and 0.1% lower, respectively, from their prior record closing levels. The volume totals were lighter than the prior session on the NYSE and on the Nasdaq exchange. Decliners led advancers by a 3-2 margin on the NYSE and by almost a 2-1 margin on the Nasdaq exchange. There were 41 high-ranked companies from the Leaders List that hit new 52-week highs and were listed on the BreakOuts Page, versus the total of 96 on the prior session. New 52-week highs totals contracted but still easily outnumbered the new 52-week lows totals which were in the single digits on both exchanges for a 5th consecutive session. The major indices are in a confirmed uptrend (M criteria). Investors are reminded to always make buying and selling decisions based based on the strict criteria and rules of the fact-based investment system. PICTURED: The S&P 500 Index is perched near its record high.
U.S. equities ended modestly lower after fluctuating between small gains and losses on Tuesday, as investors braced for an influx of corporate earnings results. Market participants also monitored fiscal stimulus updates, with President Biden signaling a willingness to compromise on details of his proposed $1.9 trillion relief package. On the Covid-19 front, drug maker Pfizer noted it would be able to provide the U.S. with 200 million coronavirus vaccine doses by May, which would be two months sooner than projected.
Six of 11 S&P 500 sectors finished in negative territory. Energy shares lagged as WTI crude slipped 0.5% to $52.50/barrel. In earnings, General Electric (GE +2.73%) after reporting better-than-expected cash flow. 3M (MMM +3.29%) rose after topping Wall Street's earnings and revenue projections. Johnson & Johnson (JNJ 2.7%+2.71%) rose after providing upbeat guidance following an earnings beat. In other corporate news, Beyond Meat (BYND +17.70%) rose after announcing it will partner with PepsiCo (PEP ++1.18%) to produce plant based snacks.
On the data front, the Conference Board’s gauge of consumer confidence increased to 89.3 in January from the downwardly revised 87.1 prior reading, rising for the first time in four months but remaining well under February's pre-pandemic level of 132.60. Meanwhile, the S&P CoreLogic Case-Shiller 20-city housing price index climbed 9.1% year-over-year during November, which was the biggest annual jump since 2014. Treasuries declined, with the yield on the 10-year note adding one basis point to 1.04%. |
 Kenneth J. Gruneisen started out as a licensed stockbroker in August 1987, a couple of months prior to the historic stock market crash that took the Dow Jones Industrial Average down -22.6% in a single day. He has published daily fact-based fundamental and technical analysis on high-ranked stocks online for two decades. Through FACTBASEDINVESTING.COM, Kenneth provides educational articles, news, market commentary, and other information regarding proven investment systems that work in good times and bad.
Comments contained in the body of this report are technical opinions only and are not necessarily those of Gruneisen Growth Corp. The material herein has been obtained from sources believed to be reliable and accurate, however, its accuracy and completeness cannot be guaranteed. Our firm, employees, and customers may effect transactions, including transactions contrary to any recommendation herein, or have positions in the securities mentioned herein or options with respect thereto. Any recommendation contained in this report may not be suitable for all investors and it is not to be deemed an offer or solicitation on our part with respect to the purchase or sale of any securities. |
|
 |
Retail and Networking Index Gains Buck Broader Weakness
Kenneth J. Gruneisen - Passed the CAN SLIM® Master's Exam
The Bank Index ($BKX -1.13%) and Broker/Dealer Index ($XBD -0.36%) created a drag on the major indices while the Retail Index ($RLX +0.25%) eked out a small gain. The Biotech Index ($BTK -2.26%) and Semiconductor Index ($SOX -1.54%) led the tech sector's retreat while the Networking Index ($NWX +0.17%) eked out a small gain. Commodity-linked groups had a negative bias as the Oil Services Index ($OSX -1.83%) and Integrated Oil Index ($XOI -1.77%) both outpaced the Gold & Silver Index ($XAU -0.83%) to the downside.
PICTURED: The Broker/Dealer Index ($XBD -0.36%) is perched near its record high.
| Oil Services |
$OSX |
47.22 |
-0.88 |
-1.83% |
+6.52% |
| Integrated Oil |
$XOI |
848.13 |
-15.31 |
-1.77% |
+7.02% |
| Semiconductor |
$SOX |
3,031.92 |
-47.29 |
-1.54% |
+8.46% |
| Networking |
$NWX |
762.97 |
+1.33 |
+0.17% |
+6.39% |
| Broker/Dealer |
$XBD |
389.71 |
-1.43 |
-0.36% |
+3.21% |
| Retail |
$RLX |
3,658.26 |
+9.07 |
+0.25% |
+2.67% |
| Gold & Silver |
$XAU |
137.42 |
-1.15 |
-0.83% |
-4.69% |
| Bank |
$BKX |
101.63 |
-1.16 |
-1.13% |
+3.80% |
| Biotech |
$BTK |
6,148.32 |
-142.24 |
-2.26% |
+7.13% |
|
|
|
 |
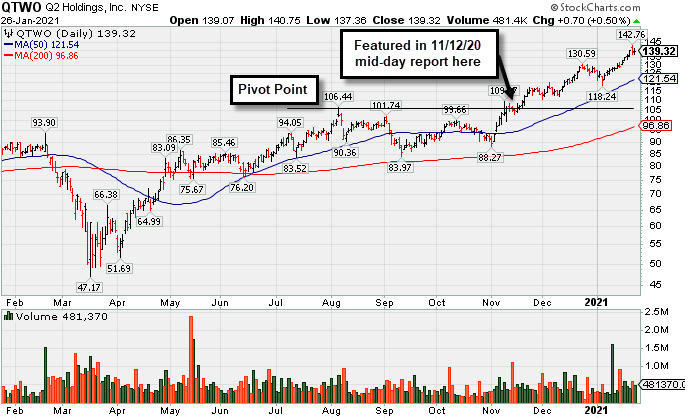
Perched Near All-Time High Stubbornly Holding Ground
Kenneth J. Gruneisen - Passed the CAN SLIM® Master's Exam
Q2 Holdings Inc (QTWO +$0.70 or +0.50% to $139.32) posted a gain today on average and it is perched at its all-time high. It stubbornly held its ground while making steady progress in recent months. Its 50-day moving average (DMA) line ($121.54) defines important near term support to watch on pullbacks.
QTWO was last shown in the FSU section on 12/31/20 with an annotated graph under the headline, "Stubbornly Holding Ground Extended From Prior Base". It was highlighted in yellow with new pivot point cited based on its 8/06/20 high plus 10 cents in the 11/12/20 mid-day report (read here).
It has a 96 Earnings Per Share Rating. It showed great earning increases with strong underlying sales revenues growth for the Jun and Sep '20 quarters versus the year ago periods. Annual earnings growth has been strong. Completed new Public Offerings on 6/06/19 and 5/13/20. The company hails from the Computer Sftwr-Financial group. There are only 53.9 million shares outstanding (S criteria).
The number of top-rated funds owning its shares rose from 404 in Dec '19 to 476 in Sep '20, a reassuring sign concerning the I criteria. Its current Up/Down Volume Ratio of 1.4 is an unbiased indication its shares have been neutral concerning accumulation/distribution over the past 50 days.
|
|
|
Color Codes Explained :
Y - Better candidates highlighted by our
staff of experts.
G - Previously featured
in past reports as yellow but may no longer be buyable under the
guidelines.
***Last / Change / Volume data in this table is the closing quote data***
Symbol/Exchange
Company Name
Industry Group |
PRICE |
CHANGE
(%Change) |
Day High |
Volume
(% DAV)
(% 50 day avg vol) |
52 Wk Hi
% From Hi |
Featured
Date |
Price
Featured |
Pivot Featured |
|
Max Buy |
 CRL
-
NYSE
CRL
-
NYSE
Charles River Labs Intl
DRUGS - Biotechnology
|
$265.48
|
-8.06
-2.95% |
$273.91
|
219,200
78.45% of 50 DAV
50 DAV is 279,400
|
$284.60
-6.72%
|
12/17/2020
|
$247.06
|
PP = $257.98
|
|
MB = $270.88
|
 Most Recent Note - 1/26/2021 6:10:20 PM
Y - Pulled back below its "max buy" level with light volume behind today's 4th consecutive loss and its color code is changed to yellow. Its prior high ($257) defines initial support above its 50 DMA line ($249). Reported Sep '20 quarterly earnings +38% on +11% sales revenues versus the year ago period, above the +25% minimum earnings guideline (C criteria).
>>> FEATURED STOCK ARTICLE : Hovering in Tight Range Holding Ground Near High - 1/5/2021 |
View all notes |
Set NEW NOTE alert |
Company Profile |
SEC
News |
Chart |
Request a new note
C
A
S
I |
AMD
-
NYSE
Advanced Micro Devices
ELECTRONICS - Semiconductor - Broad Line
|
$94.71
|
+0.58
0.62% |
$95.72
|
57,752,633
135.06% of 50 DAV
50 DAV is 42,761,700
|
$99.23
-4.56%
|
11/18/2020
|
$82.54
|
PP = $88.72
|
|
MB = $93.16
|
Most Recent Note - 1/22/2021 4:55:58 PM
Y - Today's early gain nearly challenged its 52-week high, but it ended near the session low. Rebound above the 50 DMA line ($90.41) helped its outlook improve, however, its Relative Strength rating of 73 is still below the 80+ minimum guideline for buy candidates. Keep in mind it is due to report Dec '20 quarterly results on 1/26/21.
>>> FEATURED STOCK ARTICLE : Distributional Pressure Brings Pullback Below "Max Buy" Level - 1/13/2021 |
View all notes |
Set NEW NOTE alert |
Company Profile |
SEC
News |
Chart |
Request a new note
C
A
S
I |
TER
-
NASDAQ
Teradyne Inc
ELECTRONICS - Semiconductor Equipment and Mate
|
$138.10
|
-2.01
-1.43% |
$141.05
|
1,248,320
88.41% of 50 DAV
50 DAV is 1,412,000
|
$143.40
-3.70%
|
10/21/2020
|
$92.22
|
PP = $93.54
|
|
MB = $98.22
|
Most Recent Note - 1/25/2021 6:04:02 PM
G - Hovering near its all-time high, very extended from any sound base. Support to watch on pullbacks is its 50 DMA line ($119.48). See the latest FSU analysis for more details and a new annotated graph.
>>> FEATURED STOCK ARTICLE : Traded +55.5% Higher in 3 Months Since Featured - 1/25/2021 |
View all notes |
Set NEW NOTE alert |
Company Profile |
SEC
News |
Chart |
Request a new note
C
A
S
I |
AMRC
-
NYSE
Ameresco Inc Cl A
ENERGY - Alternative
|
$60.75
|
+3.17
5.51% |
$62.00
|
577,586
140.87% of 50 DAV
50 DAV is 410,000
|
$63.45
-4.26%
|
12/15/2020
|
$46.72
|
PP = $47.10
|
|
MB = $49.46
|
Most Recent Note - 1/26/2021 6:06:43 PM
G - Posted a volume-driven gain today but it is perched near its all-time high and very extended from any sound base. Its 50 DMA line ($49.86) and prior highs in the $46-47 area define important near-term support to watch on pullbacks.
>>> FEATURED STOCK ARTICLE : Very Extended From Base After Another Powerful Gain - 1/6/2021 |
View all notes |
Set NEW NOTE alert |
Company Profile |
SEC
News |
Chart |
Request a new note
C
A
S
I |
TREX
-
NYSE
Trex Company Inc
MATERIALS and CONSTRUCTION - General Building Materials
|
$98.03
|
-0.46
-0.47% |
$99.36
|
900,065
131.01% of 50 DAV
50 DAV is 687,000
|
$104.35
-6.06%
|
6/26/2020
|
$54.53
|
PP = $66.47
|
|
MB = $69.79
|
Most Recent Note - 1/25/2021 1:10:40 PM
G - Off earlier highs after rallying for new all-time highs with 4 consecutive gains. Prior highs in the $80-81 area define important support to watch coinciding with its 50 DMA line ($81.89). Sep '20 quarterly earnings were +14% on +19% sales revenues versus the year ago period, below the +25% minimum guideline (C criteria) raising fundamental concerns.
>>> FEATURED STOCK ARTICLE : Hit New All-Time High With Gain Backed by Average Volume - 1/19/2021 |
View all notes |
Set NEW NOTE alert |
Company Profile |
SEC
News |
Chart |
Request a new note
C
A
S
I |
Symbol/Exchange
Company Name
Industry Group |
PRICE |
CHANGE
(%Change) |
Day High |
Volume
(% DAV)
(% 50 day avg vol) |
52 Wk Hi
% From Hi |
Featured
Date |
Price
Featured |
Pivot Featured |
|
Max Buy |
CLFD
-
NASDAQ
Clearfield Inc
TELECOMMUNICATIONS - Cables / Satalite Equipment
|
$34.78
|
-0.50
-1.42% |
$37.54
|
248,364
227.86% of 50 DAV
50 DAV is 109,000
|
$36.77
-5.41%
|
1/20/2021
|
$31.38
|
PP = $28.42
|
|
MB = $29.84
|
Most Recent Note - 1/26/2021 12:51:16 PM
G - Reversed into the red today after 5 consecutive volume-driven gains into new high territory, an impressive winning streak including the 1/20/21 big "breakaway gap" previously noted. Prior highs in the $28 area define initial support to watch on pullbacks. Found prompt support at its 50 DMA line ($25.74) and upward trendline when consolidating.
>>> FEATURED STOCK ARTICLE : Distributional Pressure While Testing Important Chart Support - 1/4/2021 |
View all notes |
Set NEW NOTE alert |
Company Profile |
SEC
News |
Chart |
Request a new note
C
A
S
I |
NOW
-
NYSE
Servicenow Inc
Computer Sftwr-Enterprse
|
$532.46
|
-5.42
-1.01% |
$540.78
|
1,414,198
111.90% of 50 DAV
50 DAV is 1,263,800
|
$566.74
-6.05%
|
8/20/2020
|
$453.34
|
PP = $454.79
|
|
MB = $477.53
|
Most Recent Note - 1/26/2021 6:09:00 PM
G - Consolidating near its 50 DMA line ($530). Due to report Dec '20 quarterly results on 1/27/21. Fundamental concerns were raised when it reported Sep '20 quarterly earnings +22% on +30% sales revenues versus the year ago period, below the +25% minimum guideline (C criteria) of the fact-based investment system.
>>> FEATURED STOCK ARTICLE : Gain Today and Rebound Above 50-Day Moving Average Line - 1/8/2021 |
View all notes |
Set NEW NOTE alert |
Company Profile |
SEC
News |
Chart |
Request a new note
C
A
S
I |
SMPL
-
NASDAQ
Simply Good Foods Co
Food-Confectionery
|
$28.97
|
+0.57
2.01% |
$29.19
|
348,442
27.00% of 50 DAV
50 DAV is 1,290,300
|
$32.03
-9.55%
|
12/28/2020
|
$30.40
|
PP = $31.44
|
|
MB = $33.01
|
Most Recent Note - 1/25/2021 6:07:30 PM
G - Posted a big gain today with lighter than average volume. Its Relative Strength Rating is still 68, well below the 80+ minimum guideline. See the latest FSU analysis for more details and an annotated graph.
>>> FEATURED STOCK ARTICLE : Relative Strength Rating Suffered During Stalling Action - 1/21/2021 |
View all notes |
Set NEW NOTE alert |
Company Profile |
SEC
News |
Chart |
Request a new note
C
A
S
I |
ALRM
-
NASDAQ
Alarm.com Holdings Inc
Security/Sfty
|
$96.58
|
-1.28
-1.31% |
$99.29
|
615,595
134.70% of 50 DAV
50 DAV is 457,000
|
$108.67
-11.13%
|
11/6/2020
|
$71.88
|
PP = $74.76
|
|
MB = $78.50
|
Most Recent Note - 1/22/2021 4:54:12 PM
G - Posted a small gain today with lighter volume. Encountered distributional pressure after a big rally. Its 50 DMA line ($87) defines important near-term support to watch.
>>> FEATURED STOCK ARTICLE : Encountered Distributional Pressure After Big Rally - 1/20/2021 |
View all notes |
Set NEW NOTE alert |
Company Profile |
SEC
News |
Chart |
Request a new note
C
A
S
I |
TEAM
-
NASDAQ
Atlassian Corp Plc
Comp Sftwr-Spec Enterprs
|
$223.88
|
-7.20
-3.12% |
$232.69
|
1,569,669
102.25% of 50 DAV
50 DAV is 1,535,100
|
$250.03
-10.46%
|
10/12/2020
|
$193.77
|
PP = $199.60
|
|
MB = $209.58
|
Most Recent Note - 1/26/2021 6:05:25 PM
G - Volume was higher (near average) behind today's big loss as it slumped to close below its 50 DMA line ($226) raising concerns. Prior high in the $216 area defines the next important near-term support to watch. However, its current Relative Strength Rating is 59, below the +80 minimum guideline for buy candidates. Earnings rose +7% on +26% sales revenues for the Sep '20 quarter versus the year ago period, below the +25% minimum earnings guideline (C criteria), raising fundamental concerns.
>>> FEATURED STOCK ARTICLE : Relative Strength Rating Remains Below 80+ Minimum Guideline - 1/11/2021 |
View all notes |
Set NEW NOTE alert |
Company Profile |
SEC
News |
Chart |
Request a new note
C
A
S
I |
Symbol/Exchange
Company Name
Industry Group |
PRICE |
CHANGE
(%Change) |
Day High |
Volume
(% DAV)
(% 50 day avg vol) |
52 Wk Hi
% From Hi |
Featured
Date |
Price
Featured |
Pivot Featured |
|
Max Buy |
SHOP
-
NYSE
Shopify Inc Cl A
Computer Sftwr-Enterprse
|
$1,159.77
|
-46.15
-3.83% |
$1,216.14
|
980,589
75.60% of 50 DAV
50 DAV is 1,297,000
|
$1,285.19
-9.76%
|
12/16/2020
|
$1,146.00
|
PP = $1,147.01
|
|
MB = $1,204.36
|
Most Recent Note - 1/26/2021 6:03:49 PM
Y - Volume was light while pulling back today after it was perched within close striking distance of its all-time high. Found prompt support near prior highs in the $1,146-1,130 area and above its 50 DMA line ($1,102) which defines the next important support to watch.
>>> FEATURED STOCK ARTICLE : Rebounded After Undercutting Prior Highs - 1/7/2021 |
View all notes |
Set NEW NOTE alert |
Company Profile |
SEC
News |
Chart |
Request a new note
C
A
S
I |
YETI
-
NYSE
Yeti Holdings Inc
Leisure-Products
|
$67.83
|
-2.23
-3.18% |
$70.79
|
946,303
68.28% of 50 DAV
50 DAV is 1,386,000
|
$80.89
-16.15%
|
11/5/2020
|
$57.25
|
PP = $55.14
|
|
MB = $57.90
|
Most Recent Note - 1/22/2021 4:51:10 PM
G - Consolidating above the prior low ($67) and its 50 DMA line ($67.53) which coincide defining important near-term support to watch. Gapped down for 2 consecutive sessions following a "negative reversal" noted at its all-time high. See the latest FSU analysis for more details and a new annotated graph.
>>> FEATURED STOCK ARTICLE : 50-Day Moving Average and Prior Lows Define Near-Term Support - 1/22/2021 |
View all notes |
Set NEW NOTE alert |
Company Profile |
SEC
News |
Chart |
Request a new note
C
A
S
I |
DOCU
-
NASDAQ
Docusign Inc
Computer Sftwr-Enterprse
|
$235.11
|
-9.29
-3.80% |
$245.98
|
2,739,818
77.31% of 50 DAV
50 DAV is 3,544,000
|
$290.23
-18.99%
|
1/12/2021
|
$253.50
|
PP = $256.10
|
|
MB = $268.91
|
Most Recent Note - 1/25/2021 6:10:50 PM
Y - Suffered a big loss today with higher (near average) volume raising concerns while sputtering below the pivot point cited. Near-term support to watch is its 50 DMA line ($232) and prior low ($216.50 on 1/04/21) . Fundamentals remain strong.
>>> FEATURED STOCK ARTICLE : Twice Average Volume Behind Breakout Gain - 1/12/2021 |
View all notes |
Set NEW NOTE alert |
Company Profile |
SEC
News |
Chart |
Request a new note
C
A
S
I |
AAXN
-
NASDAQ
Axon Enterprise Inc
Security/Sfty
|
$174.54
|
+4.28
2.51% |
$177.71
|
609,610
101.94% of 50 DAV
50 DAV is 598,000
|
$177.71
-1.78%
|
12/22/2020
|
$127.84
|
PP = $130.51
|
|
MB = $137.04
|
Most Recent Note - 1/25/2021 6:05:38 PM
G - Getting more extended from any sound base, it hit yet another new all-time high with today's gain on average volume. Prior high ($134) defines initial support to watch. Found prompt support near its 50 DMA line ($130) during the recent consolidation. Fundamentals remain strong.
>>> FEATURED STOCK ARTICLE : Hit New Highs With Streak of Big Volume-Driven Gains - 1/15/2021 |
View all notes |
Set NEW NOTE alert |
Company Profile |
SEC
News |
Chart |
Request a new note
C
A
S
I |
QTWO
-
NYSE
Q2 Holdings Inc
Computer Sftwr-Financial
|
$139.32
|
+0.70
0.50% |
$140.75
|
481,370
101.55% of 50 DAV
50 DAV is 474,000
|
$142.76
-2.41%
|
11/12/2020
|
$105.14
|
PP = $106.54
|
|
MB = $111.87
|
Most Recent Note - 1/26/2021 6:02:04 PM
G - Perched at its all-time high, extended from any sound base. Its 50 DMA line ($121.54) defines important near term support to watch on pullbacks. See the latest FSU analysis for more details and a new annotated graph.
>>> FEATURED STOCK ARTICLE : Perched Near All-Time High Stubbornly Holding Ground - 1/26/2021 |
View all notes |
Set NEW NOTE alert |
Company Profile |
SEC
News |
Chart |
Request a new note
C
A
S
I |
Symbol/Exchange
Company Name
Industry Group |
PRICE |
CHANGE
(%Change) |
Day High |
Volume
(% DAV)
(% 50 day avg vol) |
52 Wk Hi
% From Hi |
Featured
Date |
Price
Featured |
Pivot Featured |
|
Max Buy |
|
|
|
THESE ARE NOT BUY RECOMMENDATIONS!
Comments contained in the body of this report are technical
opinions only. The material herein has been obtained
from sources believed to be reliable and accurate, however,
its accuracy and completeness cannot be guaranteed.
This site is not an investment advisor, hence it does
not endorse or recommend any securities or other investments.
Any recommendation contained in this report may not
be suitable for all investors and it is not to be deemed
an offer or solicitation on our part with respect to
the purchase or sale of any securities. All trademarks,
service marks and trade names appearing in this report
are the property of their respective owners, and are
likewise used for identification purposes only.
This report is a service available
only to active Paid Premium Members.
You may opt-out of receiving report notifications
at any time. Questions or comments may be submitted
by writing to Premium Membership Services 665 S.E. 10 Street, Suite 201 Deerfield Beach, FL 33441-5634 or by calling 1-800-965-8307
or 954-785-1121.
|
|
|