You are not logged in.
This means you
CAN ONLY VIEW reports that were published prior to Tuesday, March 25, 2025.
You
MUST UPGRADE YOUR MEMBERSHIP if you want to see any current reports.
AFTER MARKET UPDATE - WEDNESDAY, JANUARY 20TH, 2021
Previous After Market Report Next After Market Report >>>
|
|
|
|
DOW |
+257.86 |
31,188.38 |
+0.83% |
|
Volume |
992,177,326 |
-7% |
|
Volume |
6,716,541,000 |
+9% |
|
NASDAQ |
+260.07 |
13,457.25 |
+1.97% |
|
Advancers |
1,991 |
64% |
|
Advancers |
2,088 |
56% |
|
S&P 500 |
+55.47 |
3,854.38 |
+1.46% |
|
Decliners |
1,123 |
36% |
|
Decliners |
1,664 |
44% |
|
Russell 2000 |
+9.48 |
2,160.62 |
+0.44% |
|
52 Wk Highs |
232 |
|
|
52 Wk Highs |
535 |
|
|
S&P 600 |
+5.52 |
1,229.82 |
+0.45% |
|
52 Wk Lows |
1 |
|
|
52 Wk Lows |
7 |
|
|
 |
Leadership Improves as Major Indices Continue With Strong Rally
Kenneth J. Gruneisen - Passed the CAN SLIM® Master's Exam
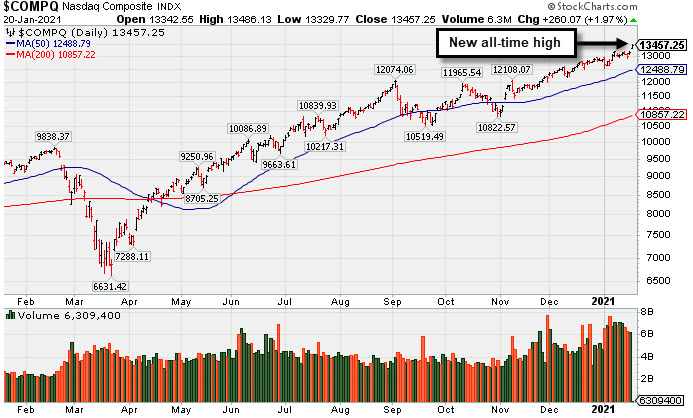
The Dow rallied 257 points to 31,188, while the S&P 500 gained 1.4%. The Tech-heavy Nasdaq Composite jumped 2% as growth-oriented stocks outperformed. Meanwhile, the Russell 2000 index of small cap stocks rose 0.4%.The volume totals were mixed, lighter than the prior session on the NYSE and higher on the Nasdaq exchange. Breadth was clearly positive as advancers led decliners by almost a 2-1 margin on the NYSE and 5-4 on the Nasdaq exchange. Leadership improved as there were 109 high-ranked companies from the Leaders List that hit new 52-week highs and were listed on the BreakOuts Page, versus the total of 86 on the prior session. New 52-week highs totals expanded and easily outnumbered the new 52-week lows totals which were in the single digits on both exchanges. The major indices are in a confirmed uptrend (M criteria). Investors are reminded to always make buying and selling decisions based based on the strict criteria and rules of the fact-based investment system. PICTURED: The Nasdaq Composite Index hit a new record high.
All three U.S. major averages closed at fresh record highs on Wednesday, as investors assessed the latest batch of corporate earnings reports. Also in focus was the presidential inauguration of Joe Biden, as market participants weighed the implications of the incoming administration’s policies.
Ten of 11 S&P 500 sectors ended in positive territory, with Financials the lone laggard. The Communication Services group paced the gains, with shares of Netflix surging 17.5% after the streaming giant easily beat analysts' revenue estimates amid better-than-expected subscriber growth in the most recent quarter. Other companies with streaming services also pushed higher, with Disney (DIS +0.80%) and Amazon (AMZN +4.57%) both rising. In other earnings, Morgan Stanley (MS -0.20%) was little changed after reporting a robust fourth quarter profit tally, which capped a record year for the U.S. bank. UnitedHealth Group (UNH -0.38%) fell despite beating analysts’ projections on both the top and bottom line.
On the data front, MBA mortgage applications dipped 1.9% in the week ending January 15. The NAHB gauge of homebuilder sentiment extended its decline from November’s record high, dipping to 83 in January from the prior month’s 86 reading. Treasuries modestly advanced, with the yield on the benchmark 10-year note down one basis point to 1.08%. In commodities, WTI crude added 0.5% to $53.24/barrel. Gold advanced 1.6% to $1868.70/ounce amid a weaker dollar. |
 Kenneth J. Gruneisen started out as a licensed stockbroker in August 1987, a couple of months prior to the historic stock market crash that took the Dow Jones Industrial Average down -22.6% in a single day. He has published daily fact-based fundamental and technical analysis on high-ranked stocks online for two decades. Through FACTBASEDINVESTING.COM, Kenneth provides educational articles, news, market commentary, and other information regarding proven investment systems that work in good times and bad.
Comments contained in the body of this report are technical opinions only and are not necessarily those of Gruneisen Growth Corp. The material herein has been obtained from sources believed to be reliable and accurate, however, its accuracy and completeness cannot be guaranteed. Our firm, employees, and customers may effect transactions, including transactions contrary to any recommendation herein, or have positions in the securities mentioned herein or options with respect thereto. Any recommendation contained in this report may not be suitable for all investors and it is not to be deemed an offer or solicitation on our part with respect to the purchase or sale of any securities. |
|
 |
Gold & Silver and Retail Indexes Posted Standout Gains
Kenneth J. Gruneisen - Passed the CAN SLIM® Master's Exam
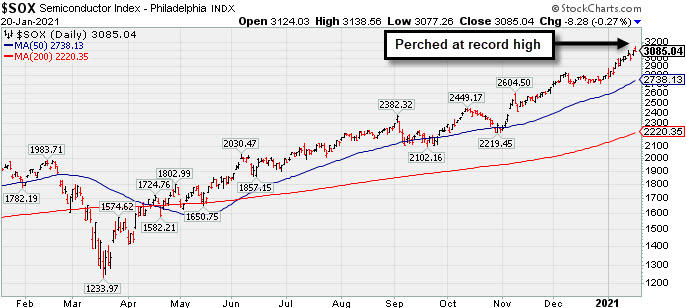
The Bank Index ($BKX -1.79%) and Broker/Dealer Index ($XBD -0.72%) both created a drag on the major indices while the Retail Index ($RLX +2.68%) posted a standout gain. The tech sector was indecisive as the Semiconductor Index ($SOX -0.27%) edged lower while the the Biotech Index ($BTK +0.25%) and Networking Index ($NWX +0.25%) both edged higher. The Gold & Silver Index ($XAU +3.05%) also posted a solid gain while the Oil Services Index ($OSX -1.56%) lost ground and the Integrated Oil Index ($XOI +0.31%) inched higher.
PICTURED: The Semiconductor Index ($SOX -0.27%) is perched at its record high.
| Oil Services |
$OSX |
51.44 |
-0.82 |
-1.56% |
+16.04% |
| Integrated Oil |
$XOI |
904.62 |
+2.76 |
+0.31% |
+14.15% |
| Semiconductor |
$SOX |
3,085.04 |
-8.28 |
-0.27% |
+10.36% |
| Networking |
$NWX |
752.97 |
+1.85 |
+0.25% |
+5.00% |
| Broker/Dealer |
$XBD |
398.47 |
-2.87 |
-0.72% |
+5.53% |
| Retail |
$RLX |
3,628.99 |
+94.58 |
+2.68% |
+1.84% |
| Gold & Silver |
$XAU |
143.24 |
+4.24 |
+3.05% |
-0.66% |
| Bank |
$BKX |
105.47 |
-1.92 |
-1.79% |
+7.72% |
| Biotech |
$BTK |
6,142.87 |
+15.37 |
+0.25% |
+7.04% |
|
|
|
 |
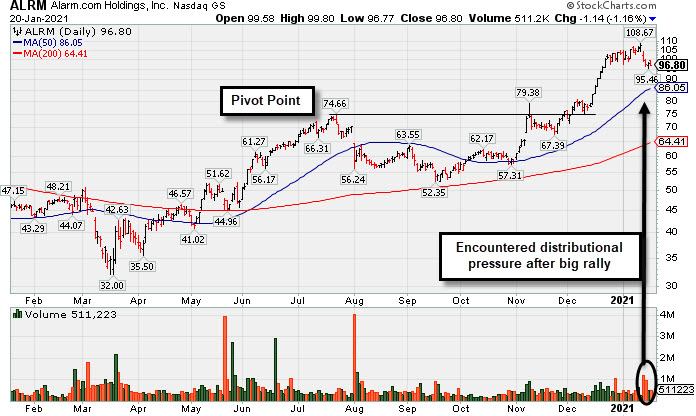
Encountered Distributional Pressure After Big Rally
Kenneth J. Gruneisen - Passed the CAN SLIM® Master's Exam
Alarm.com Holdings Inc (ALRM -$1.14 or -1.16% to $96.80) suffered a loss today after trying to rebound toward its all-time high. It is very extended from any sound base and it has encountered distributional pressure after a big rally. Its 50-day moving average (DMA) line ($86.05) defines initial support to watch on pullbacks.
Recently ALRM reported earnings +32% on +24% sales revenues for the Sep '20 quarter versus the year ago period, an improvement after +3% earnings in the Jun quarter. Prior quarterly comparisons were near or above the +25% minimum earnings guideline (C criteria). Annual earnings (A criteria) growth has been strong, a good match with the fact-based investment system.
ALRM has traded up as much as +51.2% since it was highlighted in yellow in the 11/06/20 mid-day report (read here). It was last shown in this FSU section on 12/24/20 with an annotated graph under the headline, "Perched at High After Impressive Streak of Gains". . he number of top-rated funds owning its shares rose from 262 in Mar '18 to 401 in Dec '20, a reassuring sign concerning the I criteria. Its current Up/Down Volume Ratio of 1.4 is an unbiased indication its shares have been under accumulation over the past 50 days. It has earned a Timeliness Rating of B and a Sponsorship Rating of D.
Charts courtesy of www.stockcharts.com
 |
|
|
Color Codes Explained :
Y - Better candidates highlighted by our
staff of experts.
G - Previously featured
in past reports as yellow but may no longer be buyable under the
guidelines.
***Last / Change / Volume data in this table is the closing quote data***
Symbol/Exchange
Company Name
Industry Group |
PRICE |
CHANGE
(%Change) |
Day High |
Volume
(% DAV)
(% 50 day avg vol) |
52 Wk Hi
% From Hi |
Featured
Date |
Price
Featured |
Pivot Featured |
|
Max Buy |
 CRL
-
NYSE
CRL
-
NYSE
Charles River Labs Intl
DRUGS - Biotechnology
|
$282.94
|
+4.05
1.45% |
$283.60
|
412,495
144.23% of 50 DAV
50 DAV is 286,000
|
$280.10
1.01%
|
12/17/2020
|
$247.06
|
PP = $257.98
|
|
MB = $270.88
|
Most Recent Note - 1/15/2021 5:12:38 PM
Y - Posted a solid gain today rebounding near its all-time high. Recent gains above its pivot point backed by at least +40% above average volume helped clinch a proper new (or add-on) technical buy signal. Its 50 DMA line ($245) acted as support. Reported Sep '20 quarterly earnings +38% on +11% sales revenues versus the year ago period, above the +25% minimum earnings guideline (C criteria).
>>> FEATURED STOCK ARTICLE : Hovering in Tight Range Holding Ground Near High - 1/5/2021 |
View all notes |
Set NEW NOTE alert |
Company Profile |
SEC
News |
Chart |
Request a new note
C
A
S
I |
AMD
-
NYSE
Advanced Micro Devices
ELECTRONICS - Semiconductor - Broad Line
|
$88.75
|
-0.70
-0.78% |
$90.78
|
34,295,795
79.83% of 50 DAV
50 DAV is 42,960,200
|
$99.23
-10.56%
|
11/18/2020
|
$82.54
|
PP = $88.72
|
|
MB = $93.16
|
Most Recent Note - 1/15/2021 5:15:19 PM
G - Color code is changed to green after today's 4th consecutive volume-driven loss undercut its recent lows in the $89 area and violated its 50 DMA line ($89.83) raising concerns. Only a prompt rebound above the 50 DMA line would help its outlook improve.
>>> FEATURED STOCK ARTICLE : Distributional Pressure Brings Pullback Below "Max Buy" Level - 1/13/2021 |
View all notes |
Set NEW NOTE alert |
Company Profile |
SEC
News |
Chart |
Request a new note
C
A
S
I |
TER
-
NASDAQ
Teradyne Inc
ELECTRONICS - Semiconductor Equipment and Mate
|
$138.61
|
-2.02
-1.44% |
$143.40
|
1,795,125
124.23% of 50 DAV
50 DAV is 1,445,000
|
$141.57
-2.09%
|
10/21/2020
|
$92.22
|
PP = $93.54
|
|
MB = $98.22
|
Most Recent Note - 1/19/2021 5:11:36 PM
G - Hit yet another new all-time high with today's gain backed by above average volume, getting very extended from any sound base. Support to watch on pullbacks is its 50 DMA line ($116.32).
>>> FEATURED STOCK ARTICLE : Perched Near Record High Very Extended From Any Sound Base - 12/30/2020 |
View all notes |
Set NEW NOTE alert |
Company Profile |
SEC
News |
Chart |
Request a new note
C
A
S
I |
AMRC
-
NYSE
Ameresco Inc Cl A
ENERGY - Alternative
|
$58.44
|
+0.91
1.58% |
$59.20
|
329,907
78.55% of 50 DAV
50 DAV is 420,000
|
$63.45
-7.90%
|
12/15/2020
|
$46.72
|
PP = $47.10
|
|
MB = $49.46
|
Most Recent Note - 1/19/2021 12:08:16 PM
G - Very extended from any sound base. Its 50 DMA line ($48.26) and prior highs in the $46-47 area define important near-term support to watch on pullbacks.
>>> FEATURED STOCK ARTICLE : Very Extended From Base After Another Powerful Gain - 1/6/2021 |
View all notes |
Set NEW NOTE alert |
Company Profile |
SEC
News |
Chart |
Request a new note
C
A
S
I |
TREX
-
NYSE
Trex Company Inc
MATERIALS and CONSTRUCTION - General Building Materials
|
$95.18
|
+1.55
1.66% |
$95.23
|
678,523
93.59% of 50 DAV
50 DAV is 725,000
|
$94.19
1.05%
|
6/26/2020
|
$54.53
|
PP = $66.47
|
|
MB = $69.79
|
Most Recent Note - 1/19/2021 5:06:01 PM
G - Posted a big gain today with average volume for a new all-time high. Prior highs in the $80-81 area define initial support to watch above its 50 DMA line ($80). Recently noted that it reported Sep '20 quarterly earnings +14% on +19% sales revenues versus the year ago period, below the +25% minimum guideline (C criteria) raising fundamental concerns. See the latest FSU analysis for more details and a new annotated graph.
>>> FEATURED STOCK ARTICLE : Hit New All-Time High With Gain Backed by Average Volume - 1/19/2021 |
View all notes |
Set NEW NOTE alert |
Company Profile |
SEC
News |
Chart |
Request a new note
C
A
S
I |
Symbol/Exchange
Company Name
Industry Group |
PRICE |
CHANGE
(%Change) |
Day High |
Volume
(% DAV)
(% 50 day avg vol) |
52 Wk Hi
% From Hi |
Featured
Date |
Price
Featured |
Pivot Featured |
|
Max Buy |
CLFD
-
NASDAQ
Clearfield Inc
TELECOMMUNICATIONS - Cables / Satalite Equipment
|
$31.63
|
+3.48
12.36% |
$34.65
|
537,724
532.40% of 50 DAV
50 DAV is 101,000
|
$28.32
11.69%
|
1/20/2021
|
$31.38
|
PP = $28.42
|
|
MB = $29.84
|
 Most Recent Note - 1/20/2021 12:09:38 PM
Y - Color code is changed to yellow after a 5-week flat base with pivot point cited based on its 12/14/20 high plus 10 cents. Hit a new 52-week high with today's big "breakaway gap" backed by heavy volume. Recently found prompt support at its 50 DMA line ($24.95) and upward trendline when consolidating.
>>> FEATURED STOCK ARTICLE : Distributional Pressure While Testing Important Chart Support - 1/4/2021 |
View all notes |
Set NEW NOTE alert |
Company Profile |
SEC
News |
Chart |
Request a new note
C
A
S
I |
NOW
-
NYSE
Servicenow Inc
Computer Sftwr-Enterprse
|
$542.19
|
+22.77
4.38% |
$543.47
|
1,522,079
117.43% of 50 DAV
50 DAV is 1,296,200
|
$566.74
-4.33%
|
8/20/2020
|
$453.34
|
PP = $454.79
|
|
MB = $477.53
|
Most Recent Note - 1/19/2021 5:17:43 PM
G - Today's big gain with lighter volume helped it rebound toward its 50 DMA line ($527). Subsequent gains above that important short term average are needed for its outlook to improve. Due to report Dec '20 quarterly results on 1/27/21. Fundamental concerns were raised when it reported Sep '20 quarterly earnings +22% on +30% sales revenues versus the year ago period, below the +25% minimum guideline (C criteria) of the fact-based investment system.
>>> FEATURED STOCK ARTICLE : Gain Today and Rebound Above 50-Day Moving Average Line - 1/8/2021 |
View all notes |
Set NEW NOTE alert |
Company Profile |
SEC
News |
Chart |
Request a new note
C
A
S
I |
SMPL
-
NASDAQ
Simply Good Foods Co
Food-Confectionery
|
$27.38
|
+0.37
1.37% |
$27.46
|
475,900
35.28% of 50 DAV
50 DAV is 1,348,900
|
$32.03
-14.52%
|
12/28/2020
|
$30.40
|
PP = $31.44
|
|
MB = $33.01
|
Most Recent Note - 1/19/2021 5:08:48 PM
Y - Pulled back today for a 7th consecutive loss on light volume. A "negative reversal" was noted on 1/04/21 at its all-time high. Subsequent gains above its pivot point backed by at least +40% above average volume are still needed to trigger a technical buy signal.
>>> FEATURED STOCK ARTICLE : Challenging All-Time High as it Joins Small Cap Index - 12/28/2020 |
View all notes |
Set NEW NOTE alert |
Company Profile |
SEC
News |
Chart |
Request a new note
C
A
S
I |
ALRM
-
NASDAQ
Alarm.com Holdings Inc
Security/Sfty
|
$96.80
|
-1.14
-1.16% |
$99.80
|
511,213
108.54% of 50 DAV
50 DAV is 471,000
|
$108.67
-10.92%
|
11/6/2020
|
$71.88
|
PP = $74.76
|
|
MB = $78.50
|
Most Recent Note - 1/20/2021 5:27:42 PM
G - It has encountered distributional pressure after a big rally. Its 50 DMA line ($86.05) defines important near-term support to watch. See the latest FSU analysis for more details and a new annotated graph.
>>> FEATURED STOCK ARTICLE : Perched at High After Impressive Streak of Gains - 12/24/2020 |
View all notes |
Set NEW NOTE alert |
Company Profile |
SEC
News |
Chart |
Request a new note
C
A
S
I |
TEAM
-
NASDAQ
Atlassian Corp Plc
Comp Sftwr-Spec Enterprs
|
$231.61
|
+4.87
2.15% |
$232.37
|
1,415,927
89.62% of 50 DAV
50 DAV is 1,580,000
|
$250.03
-7.37%
|
10/12/2020
|
$193.77
|
PP = $199.60
|
|
MB = $209.58
|
Most Recent Note - 1/19/2021 5:10:36 PM
G - Found support today while consolidating above its 50 DMA line ($222) and above the prior high in the $216 area which defines important near-term support to watch. However, its current Relative Strength Rating is 64, below the +80 minimum guideline for buy candidates. Earnings rose +7% on +26% sales revenues for the Sep '20 quarter versus the year ago period, below the +25% minimum earnings guideline (C criteria), raising fundamental concerns.
>>> FEATURED STOCK ARTICLE : Relative Strength Rating Remains Below 80+ Minimum Guideline - 1/11/2021 |
View all notes |
Set NEW NOTE alert |
Company Profile |
SEC
News |
Chart |
Request a new note
C
A
S
I |
Symbol/Exchange
Company Name
Industry Group |
PRICE |
CHANGE
(%Change) |
Day High |
Volume
(% DAV)
(% 50 day avg vol) |
52 Wk Hi
% From Hi |
Featured
Date |
Price
Featured |
Pivot Featured |
|
Max Buy |
SHOP
-
NYSE
Shopify Inc Cl A
Computer Sftwr-Enterprse
|
$1,200.98
|
+27.01
2.30% |
$1,216.32
|
808,269
57.32% of 50 DAV
50 DAV is 1,410,000
|
$1,285.19
-6.55%
|
12/16/2020
|
$1,146.00
|
PP = $1,147.01
|
|
MB = $1,204.36
|
Most Recent Note - 1/19/2021 5:07:19 PM
Y - Volume totals have still been cooling while consolidating perched near its all-time high. Found prompt support near prior highs in the $1,146-1,130 area and above its 50 DMA line ($1,079) which defines the next important support to watch.
>>> FEATURED STOCK ARTICLE : Rebounded After Undercutting Prior Highs - 1/7/2021 |
View all notes |
Set NEW NOTE alert |
Company Profile |
SEC
News |
Chart |
Request a new note
C
A
S
I |
YETI
-
NYSE
Yeti Holdings Inc
Leisure-Products
|
$71.35
|
+2.18
3.15% |
$72.11
|
18,601,017
1,492.86% of 50 DAV
50 DAV is 1,246,000
|
$80.89
-11.79%
|
11/5/2020
|
$57.25
|
PP = $55.14
|
|
MB = $57.90
|
Most Recent Note - 1/19/2021 12:54:42 PM
G - The prior low ($67) and 50 DMA line ($66.66) define important near-term support to watch. Gapped down for a 2nd consecutive session today following a "negative reversal" last week at its all-time high. Repeatedly noted as "extended from any sound base".
>>> FEATURED STOCK ARTICLE : Pulling Back After Recently Wedging to New Highs - 12/29/2020 |
View all notes |
Set NEW NOTE alert |
Company Profile |
SEC
News |
Chart |
Request a new note
C
A
S
I |
DOCU
-
NASDAQ
Docusign Inc
Computer Sftwr-Enterprse
|
$255.31
|
-1.26
-0.49% |
$262.47
|
2,766,996
71.15% of 50 DAV
50 DAV is 3,889,000
|
$290.23
-12.03%
|
1/12/2021
|
$253.50
|
PP = $256.10
|
|
MB = $268.91
|
Most Recent Note - 1/19/2021 5:13:43 PM
Y - Posted a gain today with higher (but still below average) volume. Finished strong on 1/12/21 after highlighted in yellow with pivot point cited based on its 12/04/20 high plus 10 cents. The big gain and strong close above the pivot point backed by twice average volume clinched a technical buy signal. Recently found support near its 50 DMA line ($230). Fundamentals remain strong.
>>> FEATURED STOCK ARTICLE : Twice Average Volume Behind Breakout Gain - 1/12/2021 |
View all notes |
Set NEW NOTE alert |
Company Profile |
SEC
News |
Chart |
Request a new note
C
A
S
I |
AAXN
-
NASDAQ
Axon Enterprise Inc
Security/Sfty
|
$164.56
|
+5.20
3.26% |
$168.48
|
1,303,991
211.69% of 50 DAV
50 DAV is 616,000
|
$166.49
-1.16%
|
12/22/2020
|
$127.84
|
PP = $130.51
|
|
MB = $137.04
|
Most Recent Note - 1/19/2021 12:06:07 PM
G - Very extended from any sound base, perched at its all-time high and on track for a 5th consecutive volume-driven gain. Prior high ($134) defines initial support to watch. Found prompt support near its 50 DMA line ($126) during the recent consolidation. Fundamentals remain strong. See the latest FSU analysis for more details and a new annotated graph.
>>> FEATURED STOCK ARTICLE : Hit New Highs With Streak of Big Volume-Driven Gains - 1/15/2021 |
View all notes |
Set NEW NOTE alert |
Company Profile |
SEC
News |
Chart |
Request a new note
C
A
S
I |
QTWO
-
NYSE
Q2 Holdings Inc
Computer Sftwr-Financial
|
$135.19
|
+3.01
2.28% |
$135.32
|
596,867
126.45% of 50 DAV
50 DAV is 472,000
|
$133.25
1.46%
|
11/12/2020
|
$105.14
|
PP = $106.54
|
|
MB = $111.87
|
Most Recent Note - 1/19/2021 5:19:05 PM
G - Posted a gain today on average volume for a new all-time high. Its 50 DMA line ($118) defines important near term support to watch on pullbacks.
>>> FEATURED STOCK ARTICLE : Stubbornly Holding Ground Extended From Prior Base - 12/31/2020 |
View all notes |
Set NEW NOTE alert |
Company Profile |
SEC
News |
Chart |
Request a new note
C
A
S
I |
Symbol/Exchange
Company Name
Industry Group |
PRICE |
CHANGE
(%Change) |
Day High |
Volume
(% DAV)
(% 50 day avg vol) |
52 Wk Hi
% From Hi |
Featured
Date |
Price
Featured |
Pivot Featured |
|
Max Buy |
|
|
|
THESE ARE NOT BUY RECOMMENDATIONS!
Comments contained in the body of this report are technical
opinions only. The material herein has been obtained
from sources believed to be reliable and accurate, however,
its accuracy and completeness cannot be guaranteed.
This site is not an investment advisor, hence it does
not endorse or recommend any securities or other investments.
Any recommendation contained in this report may not
be suitable for all investors and it is not to be deemed
an offer or solicitation on our part with respect to
the purchase or sale of any securities. All trademarks,
service marks and trade names appearing in this report
are the property of their respective owners, and are
likewise used for identification purposes only.
This report is a service available
only to active Paid Premium Members.
You may opt-out of receiving report notifications
at any time. Questions or comments may be submitted
by writing to Premium Membership Services 665 S.E. 10 Street, Suite 201 Deerfield Beach, FL 33441-5634 or by calling 1-800-965-8307
or 954-785-1121.
|
|
|