You are not logged in.
This means you
CAN ONLY VIEW reports that were published prior to Thursday, March 20, 2025.
You
MUST UPGRADE YOUR MEMBERSHIP if you want to see any current reports.
AFTER MARKET UPDATE - MONDAY, JANUARY 11TH, 2021
Previous After Market Report Next After Market Report >>>
|
|
|
|
DOW |
-89.28 |
31,008.69 |
-0.29% |
|
Volume |
961,717,844 |
-8% |
|
Volume |
6,827,179,100 |
-5% |
|
NASDAQ |
-165.54 |
13,036.43 |
-1.25% |
|
Advancers |
1,242 |
40% |
|
Advancers |
1,716 |
45% |
|
S&P 500 |
-25.07 |
3,799.61 |
-0.66% |
|
Decliners |
1,882 |
60% |
|
Decliners |
2,078 |
55% |
|
Russell 2000 |
-0.65 |
2,091.01 |
-0.03% |
|
52 Wk Highs |
183 |
|
|
52 Wk Highs |
266 |
|
|
S&P 600 |
+4.96 |
1,195.22 |
+0.42% |
|
52 Wk Lows |
5 |
|
|
52 Wk Lows |
7 |
|
|
 |
Major Indices Pulled Back as Leadership Contracted
Kenneth J. Gruneisen - Passed the CAN SLIM® Master's Exam
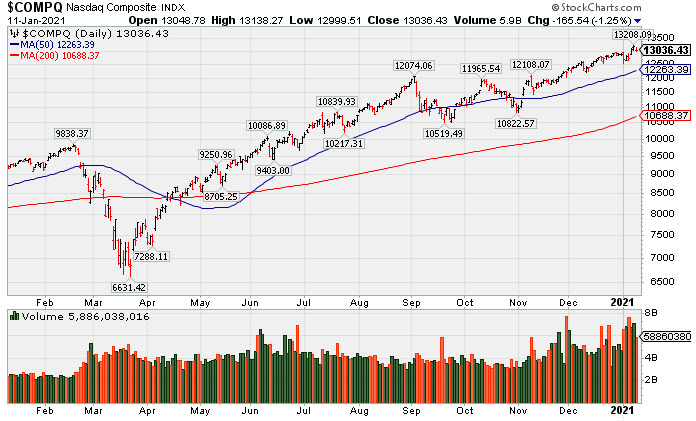
The Dow and S&P 500 fell for the first time in five sessions, declining 89 points and 0.7%, respectively. The Nasdaq Composite underperformed its peers, sliding 1.3%. The volume totals were lighter than the prior session on both the NYSE and the Nasdaq exchange. Breadth was negative as decliners led advancer by a 3-2 margin on the NYSE and by a 5-4 margin on the Nasdaq exchange. There were 72 high-ranked companies from the Leaders List that hit new 52-week highs and were listed on the BreakOuts Page, about half of 140 total on the prior session. New 52-week highs totals contracted yet still easily outnumbered the single-digit new 52-week lows totals on both exchanges. The major indices are in a confirmed uptrend (M criteria). Investors are reminded to always make buying and selling decisions based based on the strict criteria and rules of the fact-based investment system. PICTURED: The Nasdaq Composite Index pulled back from its record high.
U.S. equities finished lower on Monday, as investors took a cautious tone to start the week. Stocks pushed to record highs during the first week of 2021 amid prospects for increased fiscal spending and lingering vaccine optimism. Sentiment seemed to shift today, however, as some analysts raised concerns of stretched valuations heading into fourth quarter earnings season.
Seven of 11 S&P 500 sectors ended in negative territory, with Energy, Health Care and Financials the only advancers. Consumer Discretionary shares lagged the most, with Tesla’s (TSLA -7.82%) slump and Amazon’s (AMZN -2.15%) fall weighing on the group. Communication Services also underperformed, with shares of Twitter (TWTR -6.41%) down after the social media company permanently suspend President Trump's account. In other corporate news, Eli Lilly (LLY +11.74%) surged on promising Phase 2 trial results of its experimental Alzheimer drug.
Treasuries extended last week's slide, with the yield on the 10-year note adding three basis points to 1.14%, the highest level since last March. There were no economic data releases today. Later this week, the December retail sales report on Friday will garner attention, after consumer spending fell in the prior two months. Market participants will also await updates on fiscal policy, with President-elect Joe Biden expected to unveil his economic package on Thursday. In commodities, WTI crude slipped 0.2% to $52.08/barrel. Gold added 0.6% to $1846.30/ounce despite a stronger U.S. dollar. |
 Kenneth J. Gruneisen started out as a licensed stockbroker in August 1987, a couple of months prior to the historic stock market crash that took the Dow Jones Industrial Average down -22.6% in a single day. He has published daily fact-based fundamental and technical analysis on high-ranked stocks online for two decades. Through FACTBASEDINVESTING.COM, Kenneth provides educational articles, news, market commentary, and other information regarding proven investment systems that work in good times and bad.
Comments contained in the body of this report are technical opinions only and are not necessarily those of Gruneisen Growth Corp. The material herein has been obtained from sources believed to be reliable and accurate, however, its accuracy and completeness cannot be guaranteed. Our firm, employees, and customers may effect transactions, including transactions contrary to any recommendation herein, or have positions in the securities mentioned herein or options with respect thereto. Any recommendation contained in this report may not be suitable for all investors and it is not to be deemed an offer or solicitation on our part with respect to the purchase or sale of any securities. |
|
 |
Financial, Tech, and Energy-Linked Indexes Rose
Kenneth J. Gruneisen - Passed the CAN SLIM® Master's Exam
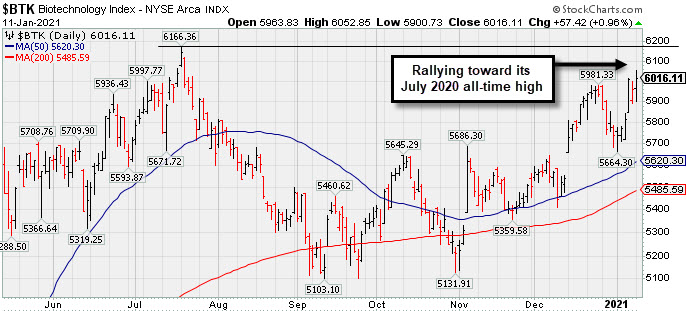
The Bank Index ($BKX +1.09%) posted a solid gain while the Broker/Dealer Index ($XBD -0.01%) finished flat. The Retail Index ($RLX -1.16%) created a drag on the major indices. The Semiconductor Index ($SOX +1.14%) led the tech sector higher, along with the Biotech Index ($BTK +0.96%), while the Networking Index ($NWX +0.38%) followed with a smaller gain. Commodity-linked groups were mixed as the Oil Services Index ($OSX +0.46%) and Integrated Oil Index ($XOI +0.92%) both notched gains, meanwhile the Gold & Silver Index ($XAU -2.23%) slumped.
PICTURED: The Biotech Index ($BTK +0.96%) posted a solid gain while rallying within striking distance of its July 2020 all-time high.
| Oil Services |
$OSX |
50.60 |
+0.23 |
+0.46% |
+14.15% |
| Integrated Oil |
$XOI |
876.97 |
+8.01 |
+0.92% |
+10.66% |
| Semiconductor |
$SOX |
2,969.92 |
+33.45 |
+1.14% |
+6.24% |
| Networking |
$NWX |
729.76 |
+2.75 |
+0.38% |
+1.76% |
| Broker/Dealer |
$XBD |
398.13 |
-0.04 |
-0.01% |
+5.44% |
| Retail |
$RLX |
3,534.06 |
-41.34 |
-1.16% |
-0.82% |
| Gold & Silver |
$XAU |
143.96 |
-3.28 |
-2.23% |
-0.16% |
| Bank |
$BKX |
107.47 |
+1.16 |
+1.09% |
+9.76% |
| Biotech |
$BTK |
6,016.11 |
+57.42 |
+0.96% |
+4.83% |
|
|
|
 |
Relative Strength Rating Remains Below 80+ Minimum Guideline
Kenneth J. Gruneisen - Passed the CAN SLIM® Master's Exam
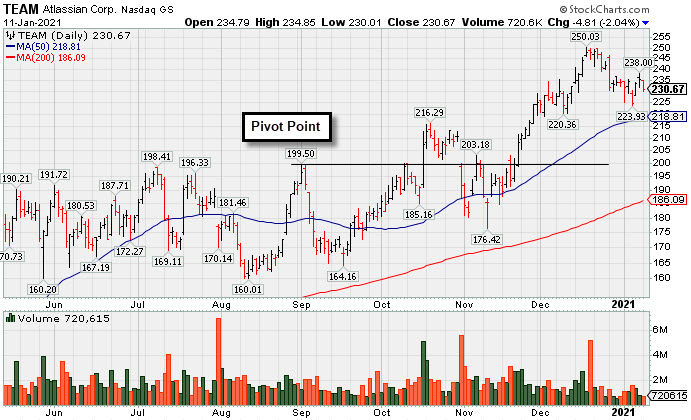
Atlassian Corp (TEAM -$4.81 or -2.04% to $230.67) is consolidating above Its 50-day moving average (DMA) line ($218.81) and prior high in the $216 area which define important near-term support to watch. Its current Relative Strength Rating is 75, and it was recently noted that it had slumped below the +80 minimum guideline for buy candidates.
Earnings rose +7% on +26% sales revenues for the Sep '20 quarter versus the year ago period, below the +25% minimum earnings guideline (C criteria), raising fundamental concerns.
TEAM has a 93 Earnings Per Share rating. This Australia - based software developer's annual earnings (A criteria) history has been strong since its $21 IPO on 12/10/15. The number of top-rated funds owning its shares rose from 266 in Sep '17 to 840 in Sep '20, a reassuring sign concerning the I criteria. It has a Timeliness Rating of C and Sponsorship Rating of A. Its current Up/Down Volume Ratio of 1.0 is an unbiased indication its shares have been neutral concerning accumulation/distribution over the past 50 days. |
|
|
Color Codes Explained :
Y - Better candidates highlighted by our
staff of experts.
G - Previously featured
in past reports as yellow but may no longer be buyable under the
guidelines.
***Last / Change / Volume data in this table is the closing quote data***
Symbol/Exchange
Company Name
Industry Group |
PRICE |
CHANGE
(%Change) |
Day High |
Volume
(% DAV)
(% 50 day avg vol) |
52 Wk Hi
% From Hi |
Featured
Date |
Price
Featured |
Pivot Featured |
|
Max Buy |
 CRL
-
NYSE
CRL
-
NYSE
Charles River Labs Intl
DRUGS - Biotechnology
|
$276.31
|
+5.30
1.96% |
$276.87
|
298,343
97.82% of 50 DAV
50 DAV is 305,000
|
$271.73
1.69%
|
12/17/2020
|
$247.06
|
PP = $257.98
|
|
MB = $270.88
|
Most Recent Note - 1/7/2021 5:42:03 PM
Y - Posted a 3rd consecutive gain today with near average volume hitting a new all-time high. The pivot point cited is based on its 11/09/20 high plus 10 cents. Subsequent gains above its pivot point backed by at least +40% above average volume may help clinch a proper new (or add-on) technical buy signal. Its 50 DMA line ($239) has been acting as support. Reported Sep '20 quarterly earnings +38% on +11% sales revenues versus the year ago period, above the +25% minimum earnings guideline (C criteria). See the latest FSU analysis for more details and a new annotated graph.
>>> FEATURED STOCK ARTICLE : Hovering in Tight Range Holding Ground Near High - 1/5/2021 |
View all notes |
Set NEW NOTE alert |
Company Profile |
SEC
News |
Chart |
Request a new note
C
A
S
I |
AMD
-
NASDAQ
Advanced Micro Devices
ELECTRONICS - Semiconductor - Broad Line
|
$97.25
|
+2.67
2.82% |
$99.23
|
48,172,596
111.65% of 50 DAV
50 DAV is 43,148,000
|
$97.98
-0.75%
|
11/18/2020
|
$82.54
|
PP = $88.72
|
|
MB = $93.16
|
 Most Recent Note - 1/11/2021 12:33:03 PM
G - Hitting a new all-time high with today's big gain. Its recent lows and 50 DMA line ($88.63) defines important near term support to watch on pullbacks.
>>> FEATURED STOCK ARTICLE : Pulling Back From its Record High Hit Last Week - 12/21/2020 |
View all notes |
Set NEW NOTE alert |
Company Profile |
SEC
News |
Chart |
Request a new note
C
A
S
I |
TER
-
NASDAQ
Teradyne Inc
ELECTRONICS - Semiconductor Equipment and Mate
|
$135.70
|
+3.55
2.69% |
$136.45
|
2,106,670
146.50% of 50 DAV
50 DAV is 1,438,000
|
$133.48
1.66%
|
10/21/2020
|
$92.22
|
PP = $93.54
|
|
MB = $98.22
|
Most Recent Note - 1/11/2021 12:24:44 PM
G - Hitting yet another new all-time high with today's 5th consecutive gain, very extended from any sound base. Support to watch on pullbacks is its 50 DMA line ($111.55).
>>> FEATURED STOCK ARTICLE : Perched Near Record High Very Extended From Any Sound Base - 12/30/2020 |
View all notes |
Set NEW NOTE alert |
Company Profile |
SEC
News |
Chart |
Request a new note
C
A
S
I |
AMRC
-
NYSE
Ameresco Inc Cl A
ENERGY - Alternative
|
$58.78
|
-2.50
-4.08% |
$59.76
|
648,778
157.09% of 50 DAV
50 DAV is 413,000
|
$63.45
-7.36%
|
12/15/2020
|
$46.72
|
PP = $47.10
|
|
MB = $49.46
|
Most Recent Note - 1/11/2021 11:56:48 AM
G - Pulling back from its all-time high with today's loss after 4 consecutive volume-driven gains, getting very extended from any sound base. Its 50 DMA line ($46.45) and prior highs in the $46-47 area define important near-term support to watch on pullbacks.
>>> FEATURED STOCK ARTICLE : Very Extended From Base After Another Powerful Gain - 1/6/2021 |
View all notes |
Set NEW NOTE alert |
Company Profile |
SEC
News |
Chart |
Request a new note
C
A
S
I |
TREX
-
NYSE
Trex Company Inc
MATERIALS and CONSTRUCTION - General Building Materials
|
$89.97
|
+1.00
1.12% |
$90.15
|
614,667
79.11% of 50 DAV
50 DAV is 777,000
|
$92.33
-2.56%
|
6/26/2020
|
$54.53
|
PP = $66.47
|
|
MB = $69.79
|
Most Recent Note - 1/7/2021 5:39:13 PM
G - Posted a 3rd consecutive gain today with average volume hitting a new 52-week high. Prior highs in the $80-81 area define initial support to watch above its 50 DMA line ($77.25). Recently noted that it reported Sep '20 quarterly earnings +14% on +19% sales revenues versus the year ago period, below the +25% minimum guideline (C criteria) raising fundamental concerns.
>>> FEATURED STOCK ARTICLE : Hit New High With Light Volume Behind 4th Consecutive Gain - 12/22/2020 |
View all notes |
Set NEW NOTE alert |
Company Profile |
SEC
News |
Chart |
Request a new note
C
A
S
I |
Symbol/Exchange
Company Name
Industry Group |
PRICE |
CHANGE
(%Change) |
Day High |
Volume
(% DAV)
(% 50 day avg vol) |
52 Wk Hi
% From Hi |
Featured
Date |
Price
Featured |
Pivot Featured |
|
Max Buy |
CLFD
-
NASDAQ
Clearfield Inc
TELECOMMUNICATIONS - Cables / Satalite Equipment
|
$26.05
|
+0.17
0.66% |
$26.11
|
44,407
43.97% of 50 DAV
50 DAV is 101,000
|
$28.32
-8.02%
|
11/17/2020
|
$22.06
|
PP = $26.07
|
|
MB = $27.37
|
Most Recent Note - 1/11/2021 5:56:48 PM
Y - Eked out a 5th consecutive small gain today with light volume. Volume totals have been cooling while hovering within striking distance of its 52-week high. Recently found prompt support at its 50 DMA line ($24.16) and upward trendline when consolidating.
>>> FEATURED STOCK ARTICLE : Distributional Pressure While Testing Important Chart Support - 1/4/2021 |
View all notes |
Set NEW NOTE alert |
Company Profile |
SEC
News |
Chart |
Request a new note
C
A
S
I |
NOW
-
NYSE
Servicenow Inc
Computer Sftwr-Enterprse
|
$523.06
|
-6.58
-1.24% |
$526.96
|
1,257,020
89.45% of 50 DAV
50 DAV is 1,405,300
|
$566.74
-7.71%
|
8/20/2020
|
$453.34
|
PP = $454.79
|
|
MB = $477.53
|
Most Recent Note - 1/8/2021 5:29:46 PM
G - Today's big gain and rebound above its 50 DMA line ($524) helped its outlook improve. Recently reported Sep '20 quarterly earnings +22% on +30% sales revenues versus the year ago period, below the +25% minimum guideline (C criteria) of the fact-based investment system. See the latest FSU analysis for more details and a new annotated graph.
>>> FEATURED STOCK ARTICLE : Gain Today and Rebound Above 50-Day Moving Average Line - 1/8/2021 |
View all notes |
Set NEW NOTE alert |
Company Profile |
SEC
News |
Chart |
Request a new note
C
A
S
I |
SMPL
-
NASDAQ
Simply Good Foods Co
Food-Confectionery
|
$29.43
|
-0.34
-1.14% |
$29.84
|
600,197
43.31% of 50 DAV
50 DAV is 1,385,900
|
$32.03
-8.12%
|
12/28/2020
|
$30.40
|
PP = $31.44
|
|
MB = $33.01
|
Most Recent Note - 1/8/2021 5:33:22 PM
Y - Quietly consolidating after a "negative reversal" on 1/04/21 at its all-time high. Subsequent gains above its pivot point backed by at least +40% above average volume may trigger a technical buy signal.
>>> FEATURED STOCK ARTICLE : Challenging All-Time High as it Joins Small Cap Index - 12/28/2020 |
View all notes |
Set NEW NOTE alert |
Company Profile |
SEC
News |
Chart |
Request a new note
C
A
S
I |
ALRM
-
NASDAQ
Alarm.com Holdings Inc
Security/Sfty
|
$104.85
|
-0.23
-0.22% |
$106.19
|
492,983
112.04% of 50 DAV
50 DAV is 440,000
|
$107.18
-2.17%
|
11/6/2020
|
$71.88
|
PP = $74.76
|
|
MB = $78.50
|
Most Recent Note - 1/7/2021 5:33:43 PM
G - Posted a big gain today with light volume for a new all-time high. Very extended from any sound base. Its 50 DMA line ($79.51) and prior high ($74.66 on 7/23/20) define important near-term support to watch on pullbacks.
>>> FEATURED STOCK ARTICLE : Perched at High After Impressive Streak of Gains - 12/24/2020 |
View all notes |
Set NEW NOTE alert |
Company Profile |
SEC
News |
Chart |
Request a new note
C
A
S
I |
TEAM
-
NASDAQ
Atlassian Corp Plc
Comp Sftwr-Spec Enterprs
|
$230.67
|
-4.81
-2.04% |
$234.85
|
720,577
41.04% of 50 DAV
50 DAV is 1,755,600
|
$250.03
-7.74%
|
10/12/2020
|
$193.77
|
PP = $199.60
|
|
MB = $209.58
|
Most Recent Note - 1/11/2021 5:52:39 PM
G - Consolidating above its 50 DMA line ($218.81) and prior high in the $216 area which define important near-term support to watch. Its current Relative Strength Rating is 75, below the +80 minimum guideline for buy candidates. Earnings rose +7% on +26% sales revenues for the Sep '20 quarter versus the year ago period, below the +25% minimum earnings guideline (C criteria), raising concerns. See the latest FSU analysis for more details and a new annotated graph.
>>> FEATURED STOCK ARTICLE : Relative Strength Rating Remains Below 80+ Minimum Guideline - 1/11/2021 |
View all notes |
Set NEW NOTE alert |
Company Profile |
SEC
News |
Chart |
Request a new note
C
A
S
I |
Symbol/Exchange
Company Name
Industry Group |
PRICE |
CHANGE
(%Change) |
Day High |
Volume
(% DAV)
(% 50 day avg vol) |
52 Wk Hi
% From Hi |
Featured
Date |
Price
Featured |
Pivot Featured |
|
Max Buy |
SHOP
-
NYSE
Shopify Inc Cl A
Computer Sftwr-Enterprse
|
$1,177.64
|
-11.28
-0.95% |
$1,217.69
|
1,102,291
71.62% of 50 DAV
50 DAV is 1,539,000
|
$1,285.19
-8.37%
|
12/16/2020
|
$1,146.00
|
PP = $1,147.01
|
|
MB = $1,204.36
|
Most Recent Note - 1/7/2021 5:32:05 PM
Y - Rebounded today with higher (near average) volume, finding prompt support after briefly slumping below prior highs in the $1,146-1,130 area and falling back into the prior base raising concerns. Its 50 DMA line ($1,051) defines the next important support to watch. See the latest FSU analysis for more details and a new annotated graph.
>>> FEATURED STOCK ARTICLE : Rebounded After Undercutting Prior Highs - 1/7/2021 |
View all notes |
Set NEW NOTE alert |
Company Profile |
SEC
News |
Chart |
Request a new note
C
A
S
I |
YETI
-
NYSE
Yeti Holdings Inc
Leisure-Products
|
$75.95
|
+2.47
3.36% |
$76.74
|
650,009
53.76% of 50 DAV
50 DAV is 1,209,000
|
$74.82
1.51%
|
11/5/2020
|
$57.25
|
PP = $55.14
|
|
MB = $57.90
|
Most Recent Note - 1/11/2021 12:35:54 PM
G - Inching to a new all-time high with today's 7th consecutive gain, getting more extended from any sound base. Its 50 DMA line ($64.14) defines initial support to watch on pullbacks.
>>> FEATURED STOCK ARTICLE : Pulling Back After Recently Wedging to New Highs - 12/29/2020 |
View all notes |
Set NEW NOTE alert |
Company Profile |
SEC
News |
Chart |
Request a new note
C
A
S
I |
AAXN
-
NASDAQ
Axon Enterprise Inc
Security/Sfty
|
$124.84
|
-0.52
-0.41% |
$127.87
|
548,626
101.86% of 50 DAV
50 DAV is 538,600
|
$134.73
-7.34%
|
12/22/2020
|
$127.84
|
PP = $130.51
|
|
MB = $137.04
|
Most Recent Note - 1/8/2021 5:34:32 PM
Y - Quietly consolidating above its 50 DMA line ($120.88). A subsequent gain and new high close above the pivot point backed by at least +40% above average volume is needed to reconfirm a new (or add-on) technical buy signal. Fundamentals remain strong.
>>> FEATURED STOCK ARTICLE : New All-Time High With Today's 5th Consecutive Gain - 12/23/2020 |
View all notes |
Set NEW NOTE alert |
Company Profile |
SEC
News |
Chart |
Request a new note
C
A
S
I |
QTWO
-
NYSE
Q2 Holdings Inc
Computer Sftwr-Financial
|
$127.16
|
+0.89
0.70% |
$128.35
|
234,162
53.58% of 50 DAV
50 DAV is 437,000
|
$130.59
-2.63%
|
11/12/2020
|
$105.14
|
PP = $106.54
|
|
MB = $111.87
|
Most Recent Note - 1/8/2021 5:31:28 PM
G - Posted a 2nd consecutive gain today on light volume while hovering near its all-time high. Its 50 DMA line ($113.77) defines important near term support to watch above the prior high in the $106 area.
>>> FEATURED STOCK ARTICLE : Stubbornly Holding Ground Extended From Prior Base - 12/31/2020 |
View all notes |
Set NEW NOTE alert |
Company Profile |
SEC
News |
Chart |
Request a new note
C
A
S
I |
|
|
|
THESE ARE NOT BUY RECOMMENDATIONS!
Comments contained in the body of this report are technical
opinions only. The material herein has been obtained
from sources believed to be reliable and accurate, however,
its accuracy and completeness cannot be guaranteed.
This site is not an investment advisor, hence it does
not endorse or recommend any securities or other investments.
Any recommendation contained in this report may not
be suitable for all investors and it is not to be deemed
an offer or solicitation on our part with respect to
the purchase or sale of any securities. All trademarks,
service marks and trade names appearing in this report
are the property of their respective owners, and are
likewise used for identification purposes only.
This report is a service available
only to active Paid Premium Members.
You may opt-out of receiving report notifications
at any time. Questions or comments may be submitted
by writing to Premium Membership Services 665 S.E. 10 Street, Suite 201 Deerfield Beach, FL 33441-5634 or by calling 1-800-965-8307
or 954-785-1121.
|
|
|