You are not logged in.
This means you
CAN ONLY VIEW reports that were published prior to Tuesday, March 25, 2025.
You
MUST UPGRADE YOUR MEMBERSHIP if you want to see any current reports.
AFTER MARKET UPDATE - FRIDAY, JANUARY 15TH, 2021
Previous After Market Report Next After Market Report >>>
|
|
|
|
DOW |
-177.26 |
30,814.26 |
-0.57% |
|
Volume |
1,234,203,844 |
+18% |
|
Volume |
6,290,834,000 |
-5% |
|
NASDAQ |
-113.66 |
12,998.98 |
-0.87% |
|
Advancers |
1,011 |
32% |
|
Advancers |
1,171 |
31% |
|
S&P 500 |
-27.29 |
3,768.25 |
-0.72% |
|
Decliners |
2,114 |
68% |
|
Decliners |
2,615 |
69% |
|
Russell 2000 |
-32.33 |
2,123.02 |
-1.50% |
|
52 Wk Highs |
107 |
|
|
52 Wk Highs |
227 |
|
|
S&P 600 |
-20.79 |
1,211.91 |
-1.69% |
|
52 Wk Lows |
4 |
|
|
52 Wk Lows |
7 |
|
|
 |
Indices Fell With Breadth Negative While Leadership Thinned
Kenneth J. Gruneisen - Passed the CAN SLIM® Master's Exam
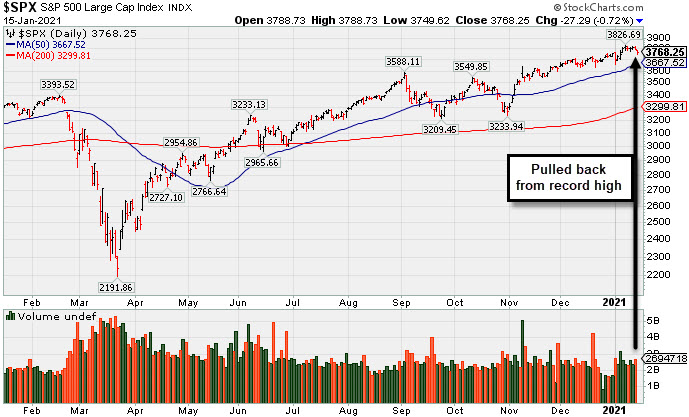
The Dow slid 177 points, extending its weekly retreat to 0.9%. The S&P 500 fell 0.7% for the day and 1.5% for the week. The Nasdaq Composite declined 0.9% to cap a 1.5% weekly decline. The volume totals were mixed despite options expirations, with higher volume than the prior session on the NYSE and lighter volume on the Nasdaq exchange. Breadth was clearly negative as decliners led advancers by more than a 2-1 margin on the NYSE and on the Nasdaq exchange. Leadership thinned noticeably as there were only 33 high-ranked companies from the Leaders List that hit new 52-week highs and were listed on the BreakOuts Page, versus the total of 142 on the prior session. New 52-week highs totals contracted yet easily outnumbered the new 52-week lows totals which for a 3rd consecutive session were in the single digits on both exchanges. The major indices are in a confirmed uptrend (M criteria). Investors are reminded to always make buying and selling decisions based based on the strict criteria and rules of the fact-based investment system. PICTURED: The S&P 500 Index pulled back from its record high.
The U.S. stocks ended lower on Friday as investors digested fourth-quarter earnings results and economic data releases. Fiscal stimulus updates from the incoming Biden administration were also in focus, after the president-elect outlined a $1.9 trillion stimulus package on Thursday evening. Sentiment was dampened, however, amid speculation that the increase in government spending could bring about higher taxes.
On the data front, retail sales fell 0.7% in December, which was below consensus estimates of a flat reading but slightly better than November’s downwardly revised 1.4% decrease. A preliminary report from the University of Michigan showed consumer sentiment eased to 79.2 in January from 80.7 the prior month. Another release revealed industrial production jumped 1.6% in the final month of 2020, above the November increase of 0.5%. Treasuries advanced, with the 10-year note yield falling four basis points to 1.09%.
Seven of 11 S&P 500 sectors finished in negative territory. Energy stocks lagged, with Exxon Mobil (XOM -4.81%) down on news the U.S. Securities and Exchange Commission is investigating the oil giant’s alleged overvaluation of a key asset. Financials also underperformed following quarterly profit tallies from some of world’s largest banks. JPMorgan (JPM -1.79%) fell despite topping Wall Street earnings and sales projections. Citigroup (C -6.93%) slumped after missing consensus sales estimates amid a reported 10% drop in revenue. |
 Kenneth J. Gruneisen started out as a licensed stockbroker in August 1987, a couple of months prior to the historic stock market crash that took the Dow Jones Industrial Average down -22.6% in a single day. He has published daily fact-based fundamental and technical analysis on high-ranked stocks online for two decades. Through FACTBASEDINVESTING.COM, Kenneth provides educational articles, news, market commentary, and other information regarding proven investment systems that work in good times and bad.
Comments contained in the body of this report are technical opinions only and are not necessarily those of Gruneisen Growth Corp. The material herein has been obtained from sources believed to be reliable and accurate, however, its accuracy and completeness cannot be guaranteed. Our firm, employees, and customers may effect transactions, including transactions contrary to any recommendation herein, or have positions in the securities mentioned herein or options with respect thereto. Any recommendation contained in this report may not be suitable for all investors and it is not to be deemed an offer or solicitation on our part with respect to the purchase or sale of any securities. |
|
 |
Commodity-Linked, Financial, and Retail Indexes Lost Ground
Kenneth J. Gruneisen - Passed the CAN SLIM® Master's Exam
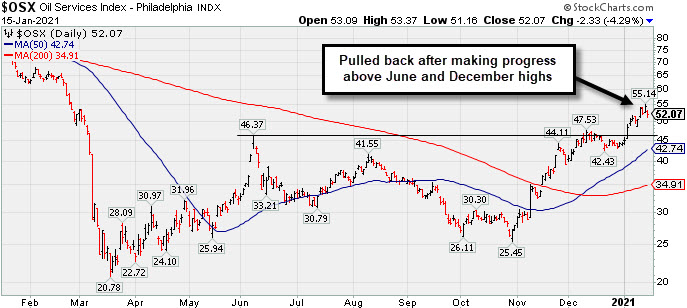
The Bank Index ($BKX -3.15%) created a drag on the major indices and the Broker/Dealer Index ($XBD -1.08%) also fell. The Retail Index ($RLX -0.36%) edged lower. The Semiconductor Index ($SOX -2.03%) led the tech sector lower while the Networking Index ($NWX -0.14%) and Biotech Index ($BTK +0.07%) both were little changed. Commodity-linked groups were particularly weak on Friday as the Oil Services Index ($OSX -4.30%), Integrated Oil Index ($XOI -4.15%), and Gold & Silver Index ($XAU -3.88%) each suffered big losses.
.
PICTURED: The Oil Services Index ($OSX -4.30%) suffered a big loss on Friday, pulling back after making solid progress above the June and December highs.
| Oil Services |
$OSX |
52.06 |
-2.34 |
-4.30% |
+17.44% |
| Integrated Oil |
$XOI |
880.53 |
-38.10 |
-4.15% |
+11.11% |
| Semiconductor |
$SOX |
2,993.59 |
-62.05 |
-2.03% |
+7.09% |
| Networking |
$NWX |
742.21 |
-1.06 |
-0.14% |
+3.50% |
| Broker/Dealer |
$XBD |
398.28 |
-4.35 |
-1.08% |
+5.48% |
| Retail |
$RLX |
3,531.90 |
-12.68 |
-0.36% |
-0.88% |
| Gold & Silver |
$XAU |
137.52 |
-5.54 |
-3.88% |
-4.62% |
| Bank |
$BKX |
106.95 |
-3.48 |
-3.15% |
+9.23% |
| Biotech |
$BTK |
6,021.00 |
+4.14 |
+0.07% |
+4.91% |
|
|
|
 |
Hit New Highs With Streak of Big Volume-Driven Gains
Kenneth J. Gruneisen - Passed the CAN SLIM® Master's Exam
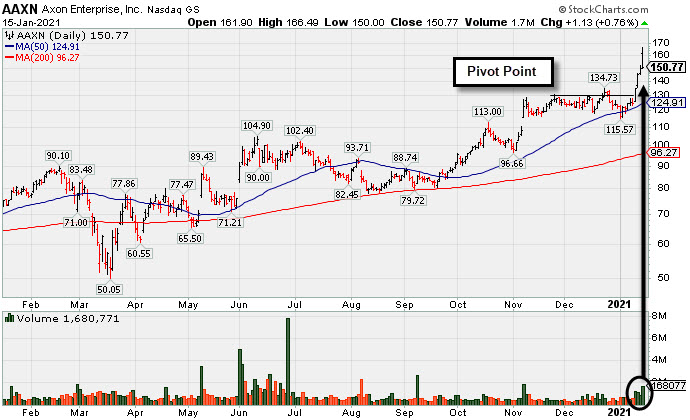
Axon Enterprise Inc's (AAXN) is very extended from any sound base, having rallied abruptly for new all-time highs well above its "max buy" level with 4 consecutive volume-driven gains. The prior high ($134) defines initial support to watch. It found prompt support near its 50-day moving average (DMA) line ($125) during the recent consolidation.
AAXN was last shown in this FSU section on 12/23/20 with an annotated graph under the headline, "New All-Time High With Today's 5th Consecutive Gain". Its color code was recently changed to yellow after a 4-week square box base pattern was noted. Members were reminded - "A solid gain and close above the pivot point backed by at least +40% above average volume may trigger a new (or add-on) technical buy signal."
AAXN completed a new Pubic Offering on 6/17/20. Such offerings often hinder price progress temporarily, yet they help companies attract greater institutional ownership interest (I criteria). The company has a small supply of only 63.5 million shares outstanding (S criteria) which can contribute to greater price volatility in the event of institutional buying or selling. The number of top-rated funds owning its shares rose from 400 in Sep '19 to 573 in Dec '20, a reassuring sign concerning the I criteria. AAXN has a Timeliness Rating of B and an Accumulation/Distribution Rating of A. The Security/Safety industry group currently has a Group Relative Strength Rating of B (63).
Fundamentals remain strong. Bullish action has followed after AAXN reported Sep '20 quarterly earnings +43% on +27% sales revenues versus the year ago period. Four of the past 5 quarterly comparisons versus the year ago periods showed earnings increases above the +25% minimum guideline (C criteria) with strong underlying sales revenues increases. Its annual earnings (A criteria) history has also been strong, helping it get a 85 Earnings Per Share Rating. |
|
|
Color Codes Explained :
Y - Better candidates highlighted by our
staff of experts.
G - Previously featured
in past reports as yellow but may no longer be buyable under the
guidelines.
***Last / Change / Volume data in this table is the closing quote data***
Symbol/Exchange
Company Name
Industry Group |
PRICE |
CHANGE
(%Change) |
Day High |
Volume
(% DAV)
(% 50 day avg vol) |
52 Wk Hi
% From Hi |
Featured
Date |
Price
Featured |
Pivot Featured |
|
Max Buy |
 CRL
-
NYSE
CRL
-
NYSE
Charles River Labs Intl
DRUGS - Biotechnology
|
$273.72
|
+6.81
2.55% |
$273.99
|
329,662
112.36% of 50 DAV
50 DAV is 293,400
|
$278.08
-1.57%
|
12/17/2020
|
$247.06
|
PP = $257.98
|
|
MB = $270.88
|
 Most Recent Note - 1/15/2021 5:12:38 PM
Y - Posted a solid gain today rebounding near its all-time high. Recent gains above its pivot point backed by at least +40% above average volume helped clinch a proper new (or add-on) technical buy signal. Its 50 DMA line ($245) acted as support. Reported Sep '20 quarterly earnings +38% on +11% sales revenues versus the year ago period, above the +25% minimum earnings guideline (C criteria).
>>> FEATURED STOCK ARTICLE : Hovering in Tight Range Holding Ground Near High - 1/5/2021 |
View all notes |
Set NEW NOTE alert |
Company Profile |
SEC
News |
Chart |
Request a new note
C
A
S
I |
AMD
-
NYSE
Advanced Micro Devices
ELECTRONICS - Semiconductor - Broad Line
|
$88.21
|
-2.58
-2.84% |
$91.59
|
48,843,386
112.99% of 50 DAV
50 DAV is 43,227,400
|
$99.23
-11.11%
|
11/18/2020
|
$82.54
|
PP = $88.72
|
|
MB = $93.16
|
Most Recent Note - 1/15/2021 5:15:19 PM
G - Color code is changed to green after today's 4th consecutive volume-driven loss undercut its recent lows in the $89 area and violated its 50 DMA line ($89.83) raising concerns. Only a prompt rebound above the 50 DMA line would help its outlook improve.
>>> FEATURED STOCK ARTICLE : Distributional Pressure Brings Pullback Below "Max Buy" Level - 1/13/2021 |
View all notes |
Set NEW NOTE alert |
Company Profile |
SEC
News |
Chart |
Request a new note
C
A
S
I |
TER
-
NASDAQ
Teradyne Inc
ELECTRONICS - Semiconductor Equipment and Mate
|
$137.30
|
-1.09
-0.79% |
$138.58
|
1,704,955
117.91% of 50 DAV
50 DAV is 1,446,000
|
$139.55
-1.61%
|
10/21/2020
|
$92.22
|
PP = $93.54
|
|
MB = $98.22
|
Most Recent Note - 1/11/2021 12:24:44 PM
G - Hitting yet another new all-time high with today's 5th consecutive gain, very extended from any sound base. Support to watch on pullbacks is its 50 DMA line ($111.55).
>>> FEATURED STOCK ARTICLE : Perched Near Record High Very Extended From Any Sound Base - 12/30/2020 |
View all notes |
Set NEW NOTE alert |
Company Profile |
SEC
News |
Chart |
Request a new note
C
A
S
I |
AMRC
-
NYSE
Ameresco Inc Cl A
ENERGY - Alternative
|
$54.03
|
-3.95
-6.81% |
$57.39
|
638,611
150.62% of 50 DAV
50 DAV is 424,000
|
$63.45
-14.85%
|
12/15/2020
|
$46.72
|
PP = $47.10
|
|
MB = $49.46
|
Most Recent Note - 1/15/2021 5:08:55 PM
G - Today it suffered a big 3rd consecutive volume-driven loss. It is very extended from any sound base. Its 50 DMA line ($47.90) and prior highs in the $46-47 area define important near-term support to watch on pullbacks.
>>> FEATURED STOCK ARTICLE : Very Extended From Base After Another Powerful Gain - 1/6/2021 |
View all notes |
Set NEW NOTE alert |
Company Profile |
SEC
News |
Chart |
Request a new note
C
A
S
I |
TREX
-
NYSE
Trex Company Inc
MATERIALS and CONSTRUCTION - General Building Materials
|
$91.15
|
-0.83
-0.90% |
$92.36
|
601,367
80.61% of 50 DAV
50 DAV is 746,000
|
$93.29
-2.29%
|
6/26/2020
|
$54.53
|
PP = $66.47
|
|
MB = $69.79
|
Most Recent Note - 1/12/2021 7:05:52 PM
G - Posted another gain today with light volume for a best ever close. Prior highs in the $80-81 area define initial support to watch above its 50 DMA line ($78.34). Recently noted that it reported Sep '20 quarterly earnings +14% on +19% sales revenues versus the year ago period, below the +25% minimum guideline (C criteria) raising fundamental concerns.
>>> FEATURED STOCK ARTICLE : Hit New High With Light Volume Behind 4th Consecutive Gain - 12/22/2020 |
View all notes |
Set NEW NOTE alert |
Company Profile |
SEC
News |
Chart |
Request a new note
C
A
S
I |
Symbol/Exchange
Company Name
Industry Group |
PRICE |
CHANGE
(%Change) |
Day High |
Volume
(% DAV)
(% 50 day avg vol) |
52 Wk Hi
% From Hi |
Featured
Date |
Price
Featured |
Pivot Featured |
|
Max Buy |
CLFD
-
NASDAQ
Clearfield Inc
TELECOMMUNICATIONS - Cables / Satalite Equipment
|
$27.34
|
-0.52
-1.87% |
$27.84
|
56,349
55.24% of 50 DAV
50 DAV is 102,000
|
$28.32
-3.46%
|
11/17/2020
|
$22.06
|
PP = $26.07
|
|
MB = $27.37
|
Most Recent Note - 1/15/2021 5:17:06 PM
Y - Pulled back today for a loss with lighter volume closing just below its "max buy" level and its color code is changed to yellow. Recently found prompt support at its 50 DMA line ($24.66) and upward trendline when consolidating.
>>> FEATURED STOCK ARTICLE : Distributional Pressure While Testing Important Chart Support - 1/4/2021 |
View all notes |
Set NEW NOTE alert |
Company Profile |
SEC
News |
Chart |
Request a new note
C
A
S
I |
NOW
-
NYSE
Servicenow Inc
Computer Sftwr-Enterprse
|
$513.76
|
-0.58
-0.11% |
$526.56
|
1,061,285
79.49% of 50 DAV
50 DAV is 1,335,100
|
$566.74
-9.35%
|
8/20/2020
|
$453.34
|
PP = $454.79
|
|
MB = $477.53
|
Most Recent Note - 1/13/2021 6:03:32 PM
G - Today's big gain with lighter volume helped it rebound toward its 50 DMA line ($526) after recently slumping below that important short term average raising concerns. Recently reported Sep '20 quarterly earnings +22% on +30% sales revenues versus the year ago period, below the +25% minimum guideline (C criteria) of the fact-based investment system.
>>> FEATURED STOCK ARTICLE : Gain Today and Rebound Above 50-Day Moving Average Line - 1/8/2021 |
View all notes |
Set NEW NOTE alert |
Company Profile |
SEC
News |
Chart |
Request a new note
C
A
S
I |
SMPL
-
NASDAQ
Simply Good Foods Co
Food-Confectionery
|
$28.00
|
-0.17
-0.60% |
$28.37
|
507,696
37.06% of 50 DAV
50 DAV is 1,369,900
|
$32.03
-12.58%
|
12/28/2020
|
$30.40
|
PP = $31.44
|
|
MB = $33.01
|
Most Recent Note - 1/12/2021 7:08:12 PM
Y - Pulled back today for a 3rd consecutive loss on light volume. Quietly consolidating after a "negative reversal" on 1/04/21 at its all-time high. Subsequent gains above its pivot point backed by at least +40% above average volume may trigger a technical buy signal.
>>> FEATURED STOCK ARTICLE : Challenging All-Time High as it Joins Small Cap Index - 12/28/2020 |
View all notes |
Set NEW NOTE alert |
Company Profile |
SEC
News |
Chart |
Request a new note
C
A
S
I |
ALRM
-
NASDAQ
Alarm.com Holdings Inc
Security/Sfty
|
$97.61
|
-2.18
-2.18% |
$100.35
|
878,712
192.28% of 50 DAV
50 DAV is 457,000
|
$108.67
-10.18%
|
11/6/2020
|
$71.88
|
PP = $74.76
|
|
MB = $78.50
|
Most Recent Note - 1/15/2021 12:29:53 PM
G - It is still very extended from any sound base while slumping further today with above average volume. Gapped down on the prior session and suffered a large loss with above average volume after announcing an offering of $350 million convertible senior notes. Its 50 DMA line ($84.76) and prior high ($74.66 on 7/23/20) define important near-term support to watch.
>>> FEATURED STOCK ARTICLE : Perched at High After Impressive Streak of Gains - 12/24/2020 |
View all notes |
Set NEW NOTE alert |
Company Profile |
SEC
News |
Chart |
Request a new note
C
A
S
I |
TEAM
-
NASDAQ
Atlassian Corp Plc
Comp Sftwr-Spec Enterprs
|
$222.93
|
-0.04
-0.02% |
$229.38
|
1,566,162
97.92% of 50 DAV
50 DAV is 1,599,500
|
$250.03
-10.84%
|
10/12/2020
|
$193.77
|
PP = $199.60
|
|
MB = $209.58
|
Most Recent Note - 1/11/2021 5:52:39 PM
G - Consolidating above its 50 DMA line ($218.81) and prior high in the $216 area which define important near-term support to watch. Its current Relative Strength Rating is 75, below the +80 minimum guideline for buy candidates. Earnings rose +7% on +26% sales revenues for the Sep '20 quarter versus the year ago period, below the +25% minimum earnings guideline (C criteria), raising concerns. See the latest FSU analysis for more details and a new annotated graph.
>>> FEATURED STOCK ARTICLE : Relative Strength Rating Remains Below 80+ Minimum Guideline - 1/11/2021 |
View all notes |
Set NEW NOTE alert |
Company Profile |
SEC
News |
Chart |
Request a new note
C
A
S
I |
Symbol/Exchange
Company Name
Industry Group |
PRICE |
CHANGE
(%Change) |
Day High |
Volume
(% DAV)
(% 50 day avg vol) |
52 Wk Hi
% From Hi |
Featured
Date |
Price
Featured |
Pivot Featured |
|
Max Buy |
SHOP
-
NYSE
Shopify Inc Cl A
Computer Sftwr-Enterprse
|
$1,170.47
|
-8.39
-0.71% |
$1,193.00
|
859,227
60.09% of 50 DAV
50 DAV is 1,430,000
|
$1,285.19
-8.93%
|
12/16/2020
|
$1,146.00
|
PP = $1,147.01
|
|
MB = $1,204.36
|
Most Recent Note - 1/12/2021 7:04:32 PM
Y - Volume totals have been cooling while consolidating. Found prompt support near prior highs in the $1,146-1,130 area and above its 50 DMA line ($1,060) which defines the next important support to watch.
>>> FEATURED STOCK ARTICLE : Rebounded After Undercutting Prior Highs - 1/7/2021 |
View all notes |
Set NEW NOTE alert |
Company Profile |
SEC
News |
Chart |
Request a new note
C
A
S
I |
YETI
-
NYSE
Yeti Holdings Inc
Leisure-Products
|
$74.01
|
-3.49
-4.50% |
$75.80
|
999,361
84.48% of 50 DAV
50 DAV is 1,183,000
|
$80.89
-8.51%
|
11/5/2020
|
$57.25
|
PP = $55.14
|
|
MB = $57.90
|
Most Recent Note - 1/15/2021 5:11:32 PM
G - Gapped down for a loss today following a "negative reversal" on the prior session at its all-time high. Very extended from any sound base. Its prior low ($67) and 50 DMA line ($66.31) define important near-term support to watch.
>>> FEATURED STOCK ARTICLE : Pulling Back After Recently Wedging to New Highs - 12/29/2020 |
View all notes |
Set NEW NOTE alert |
Company Profile |
SEC
News |
Chart |
Request a new note
C
A
S
I |
DOCU
-
NASDAQ
Docusign Inc
Computer Sftwr-Enterprse
|
$249.28
|
-0.97
-0.39% |
$256.44
|
2,484,312
63.10% of 50 DAV
50 DAV is 3,937,000
|
$290.23
-14.11%
|
1/12/2021
|
$253.50
|
PP = $256.10
|
|
MB = $268.91
|
Most Recent Note - 1/13/2021 6:01:35 PM
Y - Pulled back today with lighter (near average) volume. Finished strong on the prior session after highlighted in yellow with pivot point cited based on its 12/04/20 high plus 10 cents. The big gain and strong close above the pivot point backed by twice average volume clinched a technical buy signal. Recently found support near its 50 DMA line. Fundamentals remain strong. See the latest FSU analysis for more details and an annotated graph.
>>> FEATURED STOCK ARTICLE : Twice Average Volume Behind Breakout Gain - 1/12/2021 |
View all notes |
Set NEW NOTE alert |
Company Profile |
SEC
News |
Chart |
Request a new note
C
A
S
I |
AAXN
-
NASDAQ
Axon Enterprise Inc
Security/Sfty
|
$150.77
|
+1.13
0.76% |
$166.49
|
1,680,466
291.24% of 50 DAV
50 DAV is 577,000
|
$152.00
-0.81%
|
12/22/2020
|
$127.84
|
PP = $130.51
|
|
MB = $137.04
|
Most Recent Note - 1/15/2021 5:07:06 PM
G - Very extended from any sound base, perched at a new all-time high following 4 consecutive volume-driven gains. Prior high ($134) defines initial support to watch. Found prompt support near its 50 DMA line ($125) during the recent consolidation. Fundamentals remain strong. See the latest FSU analysis for more details and a new annotated graph.
>>> FEATURED STOCK ARTICLE : Hit New Highs With Streak of Big Volume-Driven Gains - 1/15/2021 |
View all notes |
Set NEW NOTE alert |
Company Profile |
SEC
News |
Chart |
Request a new note
C
A
S
I |
QTWO
-
NYSE
Q2 Holdings Inc
Computer Sftwr-Financial
|
$129.11
|
-1.04
-0.80% |
$132.08
|
932,114
202.19% of 50 DAV
50 DAV is 461,000
|
$130.96
-1.41%
|
11/12/2020
|
$105.14
|
PP = $106.54
|
|
MB = $111.87
|
Most Recent Note - 1/13/2021 6:04:25 PM
G - Posted a 4th consecutive gain today on light volume while challenging its all-time high. Its 50 DMA line ($115.91) defines important near term support to watch above the prior high in the $106 area.
>>> FEATURED STOCK ARTICLE : Stubbornly Holding Ground Extended From Prior Base - 12/31/2020 |
View all notes |
Set NEW NOTE alert |
Company Profile |
SEC
News |
Chart |
Request a new note
C
A
S
I |
Symbol/Exchange
Company Name
Industry Group |
PRICE |
CHANGE
(%Change) |
Day High |
Volume
(% DAV)
(% 50 day avg vol) |
52 Wk Hi
% From Hi |
Featured
Date |
Price
Featured |
Pivot Featured |
|
Max Buy |
|
|
|
THESE ARE NOT BUY RECOMMENDATIONS!
Comments contained in the body of this report are technical
opinions only. The material herein has been obtained
from sources believed to be reliable and accurate, however,
its accuracy and completeness cannot be guaranteed.
This site is not an investment advisor, hence it does
not endorse or recommend any securities or other investments.
Any recommendation contained in this report may not
be suitable for all investors and it is not to be deemed
an offer or solicitation on our part with respect to
the purchase or sale of any securities. All trademarks,
service marks and trade names appearing in this report
are the property of their respective owners, and are
likewise used for identification purposes only.
This report is a service available
only to active Paid Premium Members.
You may opt-out of receiving report notifications
at any time. Questions or comments may be submitted
by writing to Premium Membership Services 665 S.E. 10 Street, Suite 201 Deerfield Beach, FL 33441-5634 or by calling 1-800-965-8307
or 954-785-1121.
|
|
|