You are not logged in.
This means you
CAN ONLY VIEW reports that were published prior to Thursday, March 20, 2025.
You
MUST UPGRADE YOUR MEMBERSHIP if you want to see any current reports.
AFTER MARKET UPDATE - THURSDAY, JANUARY 28TH, 2021
Previous After Market Report Next After Market Report >>>
|
|
|
|
DOW |
+300.19 |
30,603.36 |
+0.99% |
|
Volume |
1,345,205,728 |
-23% |
|
Volume |
9,726,157,900 |
-11% |
|
NASDAQ |
+65.56 |
13,336.15 |
+0.49% |
|
Advancers |
2,168 |
69% |
|
Advancers |
2,133 |
56% |
|
S&P 500 |
+36.61 |
3,787.38 |
+0.98% |
|
Decliners |
954 |
31% |
|
Decliners |
1,677 |
44% |
|
Russell 2000 |
-2.09 |
2,106.61 |
-0.10% |
|
52 Wk Highs |
62 |
|
|
52 Wk Highs |
113 |
|
|
S&P 600 |
-22.51 |
1,206.78 |
-1.83% |
|
52 Wk Lows |
9 |
|
|
52 Wk Lows |
24 |
|
|
 |
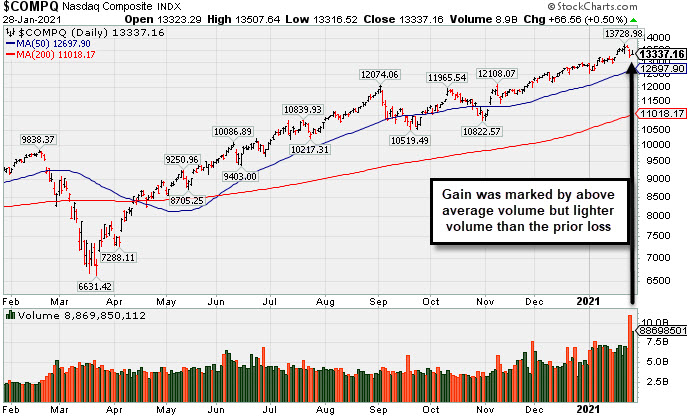
Major Indices Rose With Lighter Volume Totals and Thinner Leadership
Kenneth J. Gruneisen - Passed the CAN SLIM® Master's Exam
The Dow jumped 300 points (+1%), snapping a five-session losing streak. The S&P 500 rose 1%, while the Nasdaq Composite added 0.5%. The volume totals were lighter than the prior session on the NYSE and on the Nasdaq exchange, action indicative of lackluster buying demand from institutional investors. Advancers led decliners by a 2-1 margin on the NYSE and by a 5-4 margin on the Nasdaq exchange. There were 25 high-ranked companies from the Leaders List that hit new 52-week highs and were listed on the BreakOuts Page, versus the total of 41 on the prior session. New 52-week highs totals contracted again but still outnumbered the new 52-week lows totals. The major indices have seen the uptrend come under pressure (M criteria). Investors are reminded to always make buying and selling decisions based based on the strict criteria and rules of the fact-based investment system. PICTURED: The Dow Jones Industrial Average pulled back testing its 50-day moving average (DMA) line with higher volume behind its 5th consecutive loss from its record high.
U.S. stocks ended firmly higher on Thursday, rebounding from their worst one-day decline since October. The gains came as investors focused on corporate earnings results from some of the world’s largest publicly traded companies. Meanwhile, stocks that were driven up by mass speculative trading from retail investors ended lower on the day, as popular trading platforms moved to restrict the high-flying names.
All 11 S&P 500 sectors ended in positive territory, with seven groups rallying more than 1%. Financials paced the gains with Dow component American Express (AXP +4.32%) jumping. The Consumer Discretionary group underperformed on a relative basis with Tesla (TSLA -3.32%) fell as the electric carmaker beat consensus earnings and revenue forecasts but failed to provide key forward guidance. In other earnings, Apple (AAPL -3.50%) fell despite the iPhone maker reporting its most profitable quarter ever. American Airlines (AAL +9.30%) rose after posting a smaller-than-anticipated loss in the fourth quarter.
On the data front, initial jobless claims fell to 847,000 in the most recent week, below projections of 875,000 and last week's 900,000. Meanwhile, the first update on fourth-quarter GDP showed that the U.S. economy increased 4% in the October-December period, but the reading capped the biggest annual drop in U.S. GDP since 1946 (-3.5%). Another release showed new home sales rebounded 1.6% in December after slumping a downwardly revised 12.6% in November. Treasuries declined, with the yield on the 10-year note is rising four basis points to 1.05%. |
 Kenneth J. Gruneisen started out as a licensed stockbroker in August 1987, a couple of months prior to the historic stock market crash that took the Dow Jones Industrial Average down -22.6% in a single day. He has published daily fact-based fundamental and technical analysis on high-ranked stocks online for two decades. Through FACTBASEDINVESTING.COM, Kenneth provides educational articles, news, market commentary, and other information regarding proven investment systems that work in good times and bad.
Comments contained in the body of this report are technical opinions only and are not necessarily those of Gruneisen Growth Corp. The material herein has been obtained from sources believed to be reliable and accurate, however, its accuracy and completeness cannot be guaranteed. Our firm, employees, and customers may effect transactions, including transactions contrary to any recommendation herein, or have positions in the securities mentioned herein or options with respect thereto. Any recommendation contained in this report may not be suitable for all investors and it is not to be deemed an offer or solicitation on our part with respect to the purchase or sale of any securities. |
|
 |
Commodity-Linked, Financial, Retail, and Semiconductor Indexes Rose
Kenneth J. Gruneisen - Passed the CAN SLIM® Master's Exam
The Broker/Dealer Index ($XBD +2.18%) and Bank Index ($BKX +2.28%) both posted gains and the Retail Index ($RLX +1.02%) also helped give the major indices a boost. The Semiconductor Index ($SOX +2.02%) led the tech sector while the Biotech Index ($BTK +0.28%) edged higher and the Networking Index ($NWX -0.50%) edged lower. The Oil Services Index ($OSX +1.62%) and Integrated Oil Index ($XOI +0.92%) both rose.
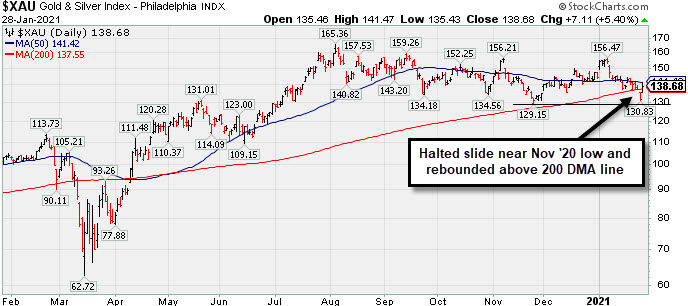
PICTURED: The Gold & Silver Index ($XAU +5.40%) posted a standout gain, halting its slide near the Nov '20 low and rebounding above its 200 DMA line.
| Oil Services |
$OSX |
47.39 |
+0.75 |
+1.62% |
+6.90% |
| Integrated Oil |
$XOI |
845.26 |
+7.70 |
+0.92% |
+6.66% |
| Semiconductor |
$SOX |
2,933.35 |
+58.22 |
+2.02% |
+4.93% |
| Networking |
$NWX |
771.99 |
-3.88 |
-0.50% |
+7.65% |
| Broker/Dealer |
$XBD |
385.57 |
+8.22 |
+2.18% |
+2.11% |
| Retail |
$RLX |
3,580.46 |
+36.04 |
+1.02% |
+0.48% |
| Gold & Silver |
$XAU |
138.68 |
+7.11 |
+5.40% |
-3.82% |
| Bank |
$BKX |
100.30 |
+2.24 |
+2.28% |
+2.44% |
| Biotech |
$BTK |
6,014.26 |
+16.59 |
+0.28% |
+4.80% |
|
|
|
 |
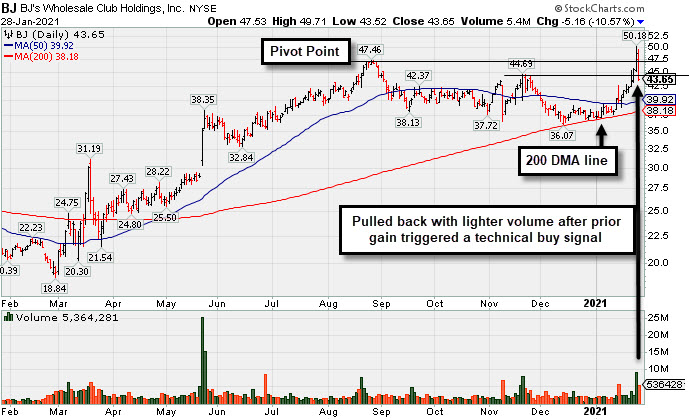
Pulled Back After Breakout Capped 7-Day Winning Streak
Kenneth J. Gruneisen - Passed the CAN SLIM® Master's Exam
B J S Whlsl Club Hldgs (BJ -$5.16 or -10.57% to $43.65) finished weak and near the session low today after highlighted in yellow in the earlier mid-day report (read here) with pivot point cited based on its 8/26/21 high. The abrupt retreat came immediately after a volume-driven breakout on the prior session capped a 7 session winning streak.
BJ failed to make progress after first highlighted in yellow with pivot point cited based on its 8/26/20 high plus 10 cents in the 11/19/20 mid-day report (read here). It found support at its 200 DMA line and showed resilience after dropped from the Featured Stocks list on 12/11/20 when an annotated graph was included under the headline, "Relative Strength Rating Slumped While Lingering Below 50 DMA".
BJ reported Oct '20 quarterly results +124% on +16% sales revenues versus the year ago period, its 3rd consecutive strong quarterly comparison above the +25% minimum guideline (C criteria), helping it better match with the fundamental guidelines of the fact-based investment system. Annual earnings growth (A criteria) has been strong. The high-ranked Retail-Discount and Variety firm completed its new IPO at $17 on 6/28/19. It has a new CEO as of 2/03/20
BJ has a fairly small supply of 137.9 million shares outstanding (S criteria). The number of top-rated funds owning its shares rose from 533 in Dec '19 to 789 in Dec '20, a reassuring sign concerning the I criteria. Its current Accumulation/Distribution rating is B and the current Up/Down Volume Ratio of 1.3 is an unbiased indication its shares have been under accumulation over the past 50 days.
|
|
|
Color Codes Explained :
Y - Better candidates highlighted by our
staff of experts.
G - Previously featured
in past reports as yellow but may no longer be buyable under the
guidelines.
***Last / Change / Volume data in this table is the closing quote data***
Symbol/Exchange
Company Name
Industry Group |
PRICE |
CHANGE
(%Change) |
Day High |
Volume
(% DAV)
(% 50 day avg vol) |
52 Wk Hi
% From Hi |
Featured
Date |
Price
Featured |
Pivot Featured |
|
Max Buy |
 CRL
-
NYSE
CRL
-
NYSE
Charles River Labs Intl
DRUGS - Biotechnology
|
$260.88
|
+8.01
3.17% |
$265.05
|
252,521
91.20% of 50 DAV
50 DAV is 276,900
|
$284.60
-8.33%
|
12/17/2020
|
$247.06
|
PP = $257.98
|
|
MB = $270.88
|
Most Recent Note - 1/27/2021 4:58:26 PM
Y - Pulled back further with higher volume behind today's 5th consecutive loss, undercutting the prior high ($257) and raising concerns while testing support at its 50 DMA line ($249.60). Reported Sep '20 quarterly earnings +38% on +11% sales revenues versus the year ago period, above the +25% minimum earnings guideline (C criteria).
>>> FEATURED STOCK ARTICLE : Hovering in Tight Range Holding Ground Near High - 1/5/2021 |
View all notes |
Set NEW NOTE alert |
Company Profile |
SEC
News |
Chart |
Request a new note
C
A
S
I |
AMD
-
NYSE
Advanced Micro Devices
ELECTRONICS - Semiconductor - Broad Line
|
$87.52
|
-1.32
-1.49% |
$89.88
|
46,750,773
106.79% of 50 DAV
50 DAV is 43,779,200
|
$99.23
-11.80%
|
11/18/2020
|
$82.54
|
PP = $88.72
|
|
MB = $93.16
|
Most Recent Note - 1/27/2021 4:51:15 PM
G - Fundamentals remain strong after it reported Dec '20 quarterly earnings +63% on +53% sales revenues versus the year ago period. Color code is changed to green after today's damaging volume-driven loss violated the 50 DMA line ($91.14) hurting its outlook. Its current Relative Strength rating of 77 is still below the 80+ minimum guideline for buy candidates.
>>> FEATURED STOCK ARTICLE : Distributional Pressure Brings Pullback Below "Max Buy" Level - 1/13/2021 |
View all notes |
Set NEW NOTE alert |
Company Profile |
SEC
News |
Chart |
Request a new note
C
A
S
I |
TER
-
NASDAQ
Teradyne Inc
ELECTRONICS - Semiconductor Equipment and Mate
|
$119.94
|
-10.17
-7.82% |
$124.00
|
4,075,797
286.02% of 50 DAV
50 DAV is 1,425,000
|
$143.40
-16.36%
|
10/21/2020
|
$92.22
|
PP = $93.54
|
|
MB = $98.22
|
 Most Recent Note - 1/28/2021 12:05:39 PM
G - Gapped down today for a 2nd consecutive big volume-driven loss undercutting support at its 50 DMA line ($121.17) raising concerns and triggering a technical sell signal.
>>> FEATURED STOCK ARTICLE : Traded +55.5% Higher in 3 Months Since Featured - 1/25/2021 |
View all notes |
Set NEW NOTE alert |
Company Profile |
SEC
News |
Chart |
Request a new note
C
A
S
I |
AMRC
-
NYSE
Ameresco Inc Cl A
ENERGY - Alternative
|
$56.13
|
+2.72
5.09% |
$56.80
|
345,405
80.89% of 50 DAV
50 DAV is 427,000
|
$63.45
-11.54%
|
12/15/2020
|
$46.72
|
PP = $47.10
|
|
MB = $49.46
|
Most Recent Note - 1/27/2021 4:47:59 PM
G - Suffered a large volume-driven loss today retreating from its all-time high. It remains very extended from any sound base. Its 50 DMA line ($50.05) and prior highs in the $46-47 area define important near-term support to watch.
>>> FEATURED STOCK ARTICLE : Very Extended From Base After Another Powerful Gain - 1/6/2021 |
View all notes |
Set NEW NOTE alert |
Company Profile |
SEC
News |
Chart |
Request a new note
C
A
S
I |
TREX
-
NYSE
Trex Company Inc
MATERIALS and CONSTRUCTION - General Building Materials
|
$91.97
|
-2.22
-2.36% |
$95.30
|
958,412
139.30% of 50 DAV
50 DAV is 688,000
|
$104.35
-11.86%
|
6/26/2020
|
$54.53
|
PP = $66.47
|
|
MB = $69.79
|
Most Recent Note - 1/25/2021 1:10:40 PM
G - Off earlier highs after rallying for new all-time highs with 4 consecutive gains. Prior highs in the $80-81 area define important support to watch coinciding with its 50 DMA line ($81.89). Sep '20 quarterly earnings were +14% on +19% sales revenues versus the year ago period, below the +25% minimum guideline (C criteria) raising fundamental concerns.
>>> FEATURED STOCK ARTICLE : Hit New All-Time High With Gain Backed by Average Volume - 1/19/2021 |
View all notes |
Set NEW NOTE alert |
Company Profile |
SEC
News |
Chart |
Request a new note
C
A
S
I |
Symbol/Exchange
Company Name
Industry Group |
PRICE |
CHANGE
(%Change) |
Day High |
Volume
(% DAV)
(% 50 day avg vol) |
52 Wk Hi
% From Hi |
Featured
Date |
Price
Featured |
Pivot Featured |
|
Max Buy |
CLFD
-
NASDAQ
Clearfield Inc
TELECOMMUNICATIONS - Cables / Satalite Equipment
|
$33.43
|
+0.13
0.39% |
$33.90
|
210,697
183.21% of 50 DAV
50 DAV is 115,000
|
$37.54
-10.95%
|
1/20/2021
|
$31.38
|
PP = $28.42
|
|
MB = $29.84
|
Most Recent Note - 1/27/2021 4:43:05 PM
G - Due to report Dec '20 quarterly earnings results after the close on Thursday, 1/28/21. Suffered a 2nd consecutive loss today after 5 consecutive volume-driven gains into new high territory, an impressive winning streak including the 1/20/21 big "breakaway gap" previously noted. Prior highs in the $28 area define initial support to watch on pullbacks. Found prompt support at its 50 DMA line and upward trendline when consolidating. See the latest FSU analysis for more details and a new annotated graph.
>>> FEATURED STOCK ARTICLE : Perched Near Record High With Earnings Report Due Soon - 1/27/2021 |
View all notes |
Set NEW NOTE alert |
Company Profile |
SEC
News |
Chart |
Request a new note
C
A
S
I |
NOW
-
NYSE
Servicenow Inc
Computer Sftwr-Enterprse
|
$554.24
|
+37.74
7.31% |
$563.88
|
3,272,151
257.08% of 50 DAV
50 DAV is 1,272,800
|
$566.74
-2.21%
|
8/20/2020
|
$453.34
|
PP = $454.79
|
|
MB = $477.53
|
Most Recent Note - 1/28/2021 12:42:24 PM
G - Gapped up today promptly rebounding above its 50 DMA line ($531) and challenging its prior high. Fundamental concerns remain after it reported Dec '20 quarterly earnings +22% on +31% sales revenues versus the year ago period, its 2nd consecutive comparison below the +25% minimum guideline (C criteria) of the fact-based investment system.
>>> FEATURED STOCK ARTICLE : Gain Today and Rebound Above 50-Day Moving Average Line - 1/8/2021 |
View all notes |
Set NEW NOTE alert |
Company Profile |
SEC
News |
Chart |
Request a new note
C
A
S
I |
SMPL
-
NASDAQ
Simply Good Foods Co
Food-Confectionery
|
$28.78
|
+0.25
0.88% |
$29.25
|
726,298
57.57% of 50 DAV
50 DAV is 1,261,600
|
$32.03
-10.15%
|
12/28/2020
|
$30.40
|
PP = $31.44
|
|
MB = $33.01
|
Most Recent Note - 1/25/2021 6:07:30 PM
G - Posted a big gain today with lighter than average volume. Its Relative Strength Rating is still 68, well below the 80+ minimum guideline. See the latest FSU analysis for more details and an annotated graph.
>>> FEATURED STOCK ARTICLE : Relative Strength Rating Suffered During Stalling Action - 1/21/2021 |
View all notes |
Set NEW NOTE alert |
Company Profile |
SEC
News |
Chart |
Request a new note
C
A
S
I |
ALRM
-
NASDAQ
Alarm.com Holdings Inc
Security/Sfty
|
$95.67
|
-2.15
-2.20% |
$99.30
|
331,232
71.08% of 50 DAV
50 DAV is 466,000
|
$108.67
-11.96%
|
11/6/2020
|
$71.88
|
PP = $74.76
|
|
MB = $78.50
|
Most Recent Note - 1/28/2021 5:30:31 PM
G - It was down today with lighter volume. It is extended from any sound base and the 50 DMA line ($89) defines important near-term support to watch.
>>> FEATURED STOCK ARTICLE : Encountered Distributional Pressure After Big Rally - 1/20/2021 |
View all notes |
Set NEW NOTE alert |
Company Profile |
SEC
News |
Chart |
Request a new note
C
A
S
I |
TEAM
-
NASDAQ
Atlassian Corp Plc
Comp Sftwr-Spec Enterprs
|
$227.02
|
+9.72
4.47% |
$235.00
|
2,949,491
189.98% of 50 DAV
50 DAV is 1,552,500
|
$250.03
-9.20%
|
10/12/2020
|
$193.77
|
PP = $199.60
|
|
MB = $209.58
|
Most Recent Note - 1/26/2021 6:05:25 PM
G - Volume was higher (near average) behind today's big loss as it slumped to close below its 50 DMA line ($226) raising concerns. Prior high in the $216 area defines the next important near-term support to watch. However, its current Relative Strength Rating is 59, below the +80 minimum guideline for buy candidates. Earnings rose +7% on +26% sales revenues for the Sep '20 quarter versus the year ago period, below the +25% minimum earnings guideline (C criteria), raising fundamental concerns.
>>> FEATURED STOCK ARTICLE : Relative Strength Rating Remains Below 80+ Minimum Guideline - 1/11/2021 |
View all notes |
Set NEW NOTE alert |
Company Profile |
SEC
News |
Chart |
Request a new note
C
A
S
I |
Symbol/Exchange
Company Name
Industry Group |
PRICE |
CHANGE
(%Change) |
Day High |
Volume
(% DAV)
(% 50 day avg vol) |
52 Wk Hi
% From Hi |
Featured
Date |
Price
Featured |
Pivot Featured |
|
Max Buy |
SHOP
-
NYSE
Shopify Inc
Computer Sftwr-Enterprse
|
$1,120.57
|
+28.49
2.61% |
$1,138.66
|
750,419
58.17% of 50 DAV
50 DAV is 1,290,100
|
$1,285.18
-12.81%
|
12/16/2020
|
$1,146.00
|
PP = $1,147.01
|
|
MB = $1,204.36
|
Most Recent Note - 1/27/2021 4:54:10 PM
G - Violated its 50 DMA line ($1,105) with today's big volume-driven loss raising concerns and its color code is changed to green. Prior low ($1,076 on 1/06/21) defines the next important support to watch.
>>> FEATURED STOCK ARTICLE : Rebounded After Undercutting Prior Highs - 1/7/2021 |
View all notes |
Set NEW NOTE alert |
Company Profile |
SEC
News |
Chart |
Request a new note
C
A
S
I |
YETI
-
NYSE
Yeti Holdings Inc
Leisure-Products
|
$68.97
|
+0.92
1.35% |
$69.96
|
837,451
60.08% of 50 DAV
50 DAV is 1,394,000
|
$80.89
-14.74%
|
11/5/2020
|
$57.25
|
PP = $55.14
|
|
MB = $57.90
|
Most Recent Note - 1/28/2021 5:33:03 PM
G - Quietly consolidating near its 50 DMA line ($68.54) which has been acting as support. More damaging losses would raise concerns and trigger a technical sell signal.
>>> FEATURED STOCK ARTICLE : 50-Day Moving Average and Prior Lows Define Near-Term Support - 1/22/2021 |
View all notes |
Set NEW NOTE alert |
Company Profile |
SEC
News |
Chart |
Request a new note
C
A
S
I |
BJ
-
NYSE
B J S Whlsl Club Hldgs
Retail-DiscountandVariety
|
$43.65
|
-5.16
-10.57% |
$49.71
|
5,364,278
203.27% of 50 DAV
50 DAV is 2,639,000
|
$50.18
-13.01%
|
1/28/2021
|
$44.74
|
PP = $47.56
|
|
MB = $49.94
|
Most Recent Note - 1/28/2021 5:27:42 PM
Y - Finished weak after highlighted in yellow with pivot point cited based on its 8/26/21 high. Abruptly retreated after a volume-driven breakout on the prior session capped a 7 session winning streak. It found support at its 200 DMA line and showed resilience after dropped from the Featured Stocks list on 12/11/20. See the latest FSU analysis for more details and a new annotated graph.
>>> FEATURED STOCK ARTICLE : Pulled Back After Breakout Capped 7-Day Winning Streak - 1/28/2021 |
View all notes |
Set NEW NOTE alert |
Company Profile |
SEC
News |
Chart |
Request a new note
C
A
S
I |
DOCU
-
NASDAQ
Docusign Inc
Computer Sftwr-Enterprse
|
$234.14
|
+8.95
3.97% |
$237.87
|
3,035,114
85.71% of 50 DAV
50 DAV is 3,541,000
|
$290.23
-19.33%
|
1/12/2021
|
$253.50
|
PP = $256.10
|
|
MB = $268.91
|
Most Recent Note - 1/27/2021 5:01:40 PM
G - Color code is changed to green after today's 3rd big loss with near average volume raised concerns and triggered a technical sell signal by violating its 50 DMA line ($233). Only a prompt rebound above the 50 DMA line would help its outlook improve. The prior low ($216.50 on 1/04/21) defines the next important support to watch. Fundamentals remain strong.
>>> FEATURED STOCK ARTICLE : Twice Average Volume Behind Breakout Gain - 1/12/2021 |
View all notes |
Set NEW NOTE alert |
Company Profile |
SEC
News |
Chart |
Request a new note
C
A
S
I |
AAXN
-
NASDAQ
Axon Enterprise Inc
Security/Sfty
|
$163.97
|
-6.07
-3.57% |
$176.60
|
730,806
119.59% of 50 DAV
50 DAV is 611,100
|
$180.69
-9.25%
|
12/22/2020
|
$127.84
|
PP = $130.51
|
|
MB = $137.04
|
Most Recent Note - 1/25/2021 6:05:38 PM
G - Getting more extended from any sound base, it hit yet another new all-time high with today's gain on average volume. Prior high ($134) defines initial support to watch. Found prompt support near its 50 DMA line ($130) during the recent consolidation. Fundamentals remain strong.
>>> FEATURED STOCK ARTICLE : Hit New Highs With Streak of Big Volume-Driven Gains - 1/15/2021 |
View all notes |
Set NEW NOTE alert |
Company Profile |
SEC
News |
Chart |
Request a new note
C
A
S
I |
Symbol/Exchange
Company Name
Industry Group |
PRICE |
CHANGE
(%Change) |
Day High |
Volume
(% DAV)
(% 50 day avg vol) |
52 Wk Hi
% From Hi |
Featured
Date |
Price
Featured |
Pivot Featured |
|
Max Buy |
QTWO
-
NYSE
Q2 Holdings Inc
Computer Sftwr-Financial
|
$131.42
|
-4.78
-3.51% |
$138.19
|
646,388
137.82% of 50 DAV
50 DAV is 469,000
|
$142.76
-7.94%
|
11/12/2020
|
$105.14
|
PP = $106.54
|
|
MB = $111.87
|
Most Recent Note - 1/26/2021 6:02:04 PM
G - Perched at its all-time high, extended from any sound base. Its 50 DMA line ($121.54) defines important near term support to watch on pullbacks. See the latest FSU analysis for more details and a new annotated graph.
>>> FEATURED STOCK ARTICLE : Perched Near All-Time High Stubbornly Holding Ground - 1/26/2021 |
View all notes |
Set NEW NOTE alert |
Company Profile |
SEC
News |
Chart |
Request a new note
C
A
S
I |
|
|
|
THESE ARE NOT BUY RECOMMENDATIONS!
Comments contained in the body of this report are technical
opinions only. The material herein has been obtained
from sources believed to be reliable and accurate, however,
its accuracy and completeness cannot be guaranteed.
This site is not an investment advisor, hence it does
not endorse or recommend any securities or other investments.
Any recommendation contained in this report may not
be suitable for all investors and it is not to be deemed
an offer or solicitation on our part with respect to
the purchase or sale of any securities. All trademarks,
service marks and trade names appearing in this report
are the property of their respective owners, and are
likewise used for identification purposes only.
This report is a service available
only to active Paid Premium Members.
You may opt-out of receiving report notifications
at any time. Questions or comments may be submitted
by writing to Premium Membership Services 665 S.E. 10 Street, Suite 201 Deerfield Beach, FL 33441-5634 or by calling 1-800-965-8307
or 954-785-1121.
|
|
|