You are not logged in.
This means you
CAN ONLY VIEW reports that were published prior to Tuesday, March 25, 2025.
You
MUST UPGRADE YOUR MEMBERSHIP if you want to see any current reports.
AFTER MARKET UPDATE - TUESDAY, JANUARY 5TH, 2021
Previous After Market Report Next After Market Report >>>
|
|
|
|
DOW |
+167.71 |
30,391.60 |
+0.55% |
|
Volume |
994,960,648 |
-14% |
|
Volume |
6,816,908,600 |
+5% |
|
NASDAQ |
+120.51 |
12,818.96 |
+0.95% |
|
Advancers |
2,276 |
73% |
|
Advancers |
2,646 |
71% |
|
S&P 500 |
+26.21 |
3,726.86 |
+0.71% |
|
Decliners |
855 |
27% |
|
Decliners |
1,095 |
29% |
|
Russell 2000 |
+4.25 |
1,979.11 |
+0.22% |
|
52 Wk Highs |
114 |
|
|
52 Wk Highs |
203 |
|
|
S&P 600 |
+24.10 |
1,131.03 |
+2.18% |
|
52 Wk Lows |
4 |
|
|
52 Wk Lows |
6 |
|
|
 |
Leadership Thinned While Major Indices Posted Gains
Kenneth J. Gruneisen - Passed the CAN SLIM® Master's Exam
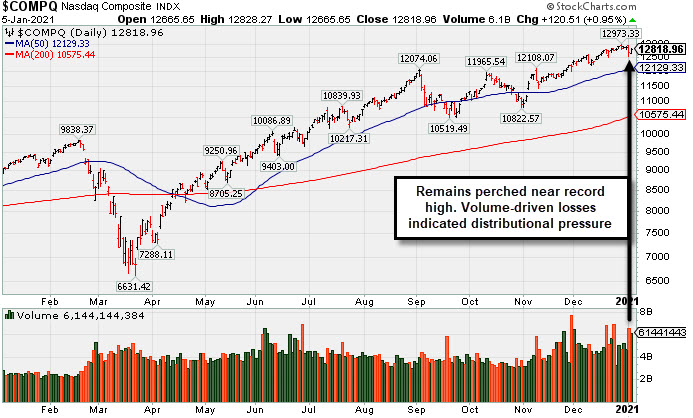
The Dow climbed 167 points while the S&P 500 rose 0.7%. The Nasdaq Composite jumped 1%. The volume totals were mixed, lighter than the prior session volume totals on the NYSE and higher on the Nasdaq exchange. Breadth was positive as advancers led decliners by an 11-4 margin on the NYSE and by more than a 2-1 margin on the Nasdaq exchange. There were 50 high-ranked companies from the Leaders List that hit new 52-week highs and were listed on the BreakOuts Page, versus the total of 59 on the prior session. New 52-week highs totals contracted yet easily outnumbered the single-digit new 52-week lows totals on both exchanges. The major indices are in a confirmed uptrend (M criteria). Investors are reminded to always make buying and selling decisions based based on the strict criteria and rules of the fact-based investment system. PICTURED: The Nasdaq Composite Index remains perched near its record high. Recent losses on higher volume indicated distributional pressure.
Stocks advanced on Tuesday, as investors awaited results from the special runoff election in Georgia which will decide control of the United States Senate for the next two years. The gains followed a retreat on Monday, which saw the S&P 500 notch its largest daily decline since October and the worst start to a year since 2016 as investors monitored election uncertainty and increasing COVID-19 concerns.
Ten of 11 S&P 500 sectors ended in positive territory, with Real Estate the lone laggard. The Energy group paced the gains with a 4.5% uptick as WTI crude briefly traded above $50/barrel for the first time since February. Exxon Mobile Corp (XOM +4.82%) posted a solid gain and exceeded its December high intra-day. The rally came after Saudi Arabia pledged to cut its output by an extra 1 million barrels a day through March, while other members of OPEC+ held production levels at or slightly above current levels. In corporate news, Micron Technology (MU +4.33%) rose after the chipmaker was the subject of an analyst upgrade.
On the data front, an update from the Institute for Supply Management (ISM) revealed that U.S. manufacturing activity unexpectedly ticked up to 60.7 in December, the fastest pace since 2018. The report was well above the projected 56.8 reading and November's 57.5 expansion. Treasuries declined, with the yield on the 10-year note adding four basis points to 0.95%. Meanwhile, COMEX gold edged up 0.3% to $1952.70/ounce after jumping nearly 2.3% on Monday. In FOREX trading, the U.S. dollar slipped 0.4% against a basket of its peers. |
 Kenneth J. Gruneisen started out as a licensed stockbroker in August 1987, a couple of months prior to the historic stock market crash that took the Dow Jones Industrial Average down -22.6% in a single day. He has published daily fact-based fundamental and technical analysis on high-ranked stocks online for two decades. Through FACTBASEDINVESTING.COM, Kenneth provides educational articles, news, market commentary, and other information regarding proven investment systems that work in good times and bad.
Comments contained in the body of this report are technical opinions only and are not necessarily those of Gruneisen Growth Corp. The material herein has been obtained from sources believed to be reliable and accurate, however, its accuracy and completeness cannot be guaranteed. Our firm, employees, and customers may effect transactions, including transactions contrary to any recommendation herein, or have positions in the securities mentioned herein or options with respect thereto. Any recommendation contained in this report may not be suitable for all investors and it is not to be deemed an offer or solicitation on our part with respect to the purchase or sale of any securities. |
|
 |
Energy Group Led as Financial, Retail, and Tech Indices Also Rose
Kenneth J. Gruneisen - Passed the CAN SLIM® Master's Exam
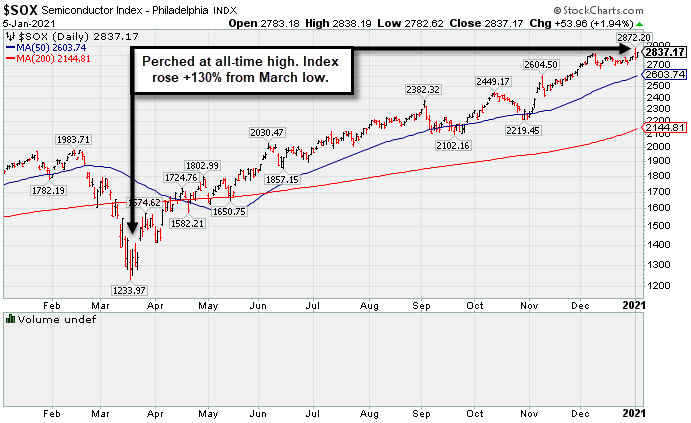
The Bank Index ($BKX +1.18%) and Broker/Dealer Index ($XBD +0.65%) posted influential gains along with the Retail Index ($RLX +0.83%). The Oil Services Index ($OSX +7.45%) and Integrated Oil Index ($XOI +5.07%) were standout gainers while the Gold & Silver Index ($XAU +0.01%) was unchanged. The Semiconductor Index ($SOX +1.94%) and Networking Index ($NWX +1.47%) led the tech sector while the Biotech Index ($BTK +0.55%) also edged higher.
PICTURED: The Semiconductor Index ($SOX +1.94%) is perched at a record high. It rose +130% from the March low.
| Oil Services |
$OSX |
48.26 |
+3.35 |
+7.45% |
+8.87% |
| Integrated Oil |
$XOI |
834.76 |
+40.26 |
+5.07% |
+5.34% |
| Semiconductor |
$SOX |
2,837.17 |
+53.96 |
+1.94% |
+1.49% |
| Networking |
$NWX |
714.23 |
+10.34 |
+1.47% |
-0.40% |
| Broker/Dealer |
$XBD |
374.83 |
+2.42 |
+0.65% |
-0.73% |
| Retail |
$RLX |
3,535.19 |
+29.00 |
+0.83% |
-0.79% |
| Gold & Silver |
$XAU |
154.08 |
+0.01 |
+0.01% |
+6.86% |
| Bank |
$BKX |
98.10 |
+1.14 |
+1.18% |
+0.19% |
| Biotech |
$BTK |
5,773.41 |
+31.86 |
+0.55% |
+0.60% |
|
|
|
 |
Hovering in Tight Range Holding Ground Near High
Kenneth J. Gruneisen - Passed the CAN SLIM® Master's Exam
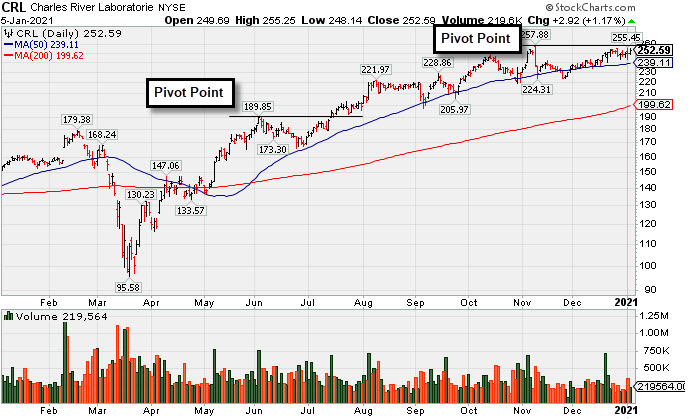
Charles River Labs Intl (CRL +$2.92 or +1.17% to $252.59) posted a small gain today with light volume while ended 3 cent below its best-ever close. It has been hovering in a tight range near its high, stubbornly holding its ground. The pivot point cited is based on its 11/09/20 high plus 10 cents. Subsequent gains above its pivot point backed by at least +40% above average volume may trigger a new (or add-on) technical buy signal. Its 50-day moving average (DMA) line ($239) has been acting as support.
CRL reported Sep '20 quarterly earnings +38% on +11% sales revenues versus the year ago period, above the +25% minimum earnings guideline (C criteria). Fundamental concerns had been raised when it reported Jun '20 quarterly earnings -3% on +4% sales revenues, below the +25% minimum guideline (C criteria), but the results were better than expected and the company also raised its guidance. It now has a 91 Earnings Per Share Rating, down from 96 prior to the report. The 2 prior quarterly earnings increases were above the +25% minimum guideline (C criteria) of the fact-based investment system. Annual earnings (A criteria) history has been strong and steady.
It hails from the Medical - Research Equipment/Services industry group which currently has a mediocre C(42) Group Relative Strength Rating (L criteria). CRL traded up as much as +29.9% since it was highlighted in yellow with pivot point cited based on its 6/03/20 high plus 10 cents in the 7/15/20 mid-day report (read here). It was last shown in this FSU section on 12/14/20 with an annotated graph under the headline, "Consolidating Above 50-Day Moving Average Line".
The number of top-rated funds owning its shares rose from 681 in Dec '19 to 808 in Sep '20, and its Up/Down Volume Ratio is 1.0 is an unbiased indication its shares have been neutral concerning accumulation/distribution over the past 50 days. There is a small number of only 49.7 million shares (S criteria) outstanding, which can contribute to greater price volatility in the event of institutional buying or selling.
|
|
|
Color Codes Explained :
Y - Better candidates highlighted by our
staff of experts.
G - Previously featured
in past reports as yellow but may no longer be buyable under the
guidelines.
***Last / Change / Volume data in this table is the closing quote data***
Symbol/Exchange
Company Name
Industry Group |
PRICE |
CHANGE
(%Change) |
Day High |
Volume
(% DAV)
(% 50 day avg vol) |
52 Wk Hi
% From Hi |
Featured
Date |
Price
Featured |
Pivot Featured |
|
Max Buy |
 CRL
-
NYSE
CRL
-
NYSE
Charles River Labs Intl
DRUGS - Biotechnology
|
$252.59
|
+2.92
1.17% |
$255.25
|
219,564
72.94% of 50 DAV
50 DAV is 301,000
|
$257.88
-2.05%
|
12/17/2020
|
$247.06
|
PP = $257.98
|
|
MB = $270.88
|
 Most Recent Note - 1/5/2021 5:22:20 PM
Y - Posted a small gain today with light volume. The pivot point cited is based on its 11/09/20 high plus 10 cents. Subsequent gains above its pivot point backed by at least +40% above average volume may trigger a new (or add-on) technical buy signal. Its 50 DMA line ($239) has been acting as support. Reported Sep '20 quarterly earnings +38% on +11% sales revenues versus the year ago period, above the +25% minimum earnings guideline (C criteria). See the latest FSU analysis for more details and a new annotated graph.
>>> FEATURED STOCK ARTICLE : Hovering in Tight Range Holding Ground Near High - 1/5/2021 |
View all notes |
Set NEW NOTE alert |
Company Profile |
SEC
News |
Chart |
Request a new note
C
A
S
I |
AMD
-
NASDAQ
Advanced Micro Devices
ELECTRONICS - Semiconductor - Broad Line
|
$92.77
|
+0.47
0.51% |
$93.21
|
33,748,334
73.39% of 50 DAV
50 DAV is 45,984,000
|
$97.98
-5.32%
|
11/18/2020
|
$82.54
|
PP = $88.72
|
|
MB = $93.16
|
Most Recent Note - 1/5/2021 5:37:27 PM
Y - Posted a 2nd consecutive gain today yet it is still hovering below its "max buy" level. Its 50 DMA line ($87.44) defines important near term support to watch on pullbacks.
>>> FEATURED STOCK ARTICLE : Pulling Back From its Record High Hit Last Week - 12/21/2020 |
View all notes |
Set NEW NOTE alert |
Company Profile |
SEC
News |
Chart |
Request a new note
C
A
S
I |
TER
-
NASDAQ
Teradyne Inc
ELECTRONICS - Semiconductor Equipment and Mate
|
$121.49
|
+2.30
1.93% |
$121.52
|
1,080,136
75.27% of 50 DAV
50 DAV is 1,435,000
|
$123.45
-1.59%
|
10/21/2020
|
$92.22
|
PP = $93.54
|
|
MB = $98.22
|
Most Recent Note - 1/5/2021 5:30:45 PM
G - Posted a gain today with lighter volume for a best-ever close. Stubbornly holding its ground with volume totals cooling. Support to watch on pullbacks is its 50 DMA line ($108.26).
>>> FEATURED STOCK ARTICLE : Perched Near Record High Very Extended From Any Sound Base - 12/30/2020 |
View all notes |
Set NEW NOTE alert |
Company Profile |
SEC
News |
Chart |
Request a new note
C
A
S
I |
AMRC
-
NYSE
Ameresco Inc Cl A
ENERGY - Alternative
|
$52.41
|
+1.50
2.95% |
$53.17
|
350,610
92.27% of 50 DAV
50 DAV is 380,000
|
$54.79
-4.34%
|
12/15/2020
|
$46.72
|
PP = $47.10
|
|
MB = $49.46
|
Most Recent Note - 1/5/2021 5:27:14 PM
G - Extended from any sound base, it posted a big gain today with lighter (near average) volume. Prior highs in the $46-47 area define initial support to watch on pullbacks.
>>> FEATURED STOCK ARTICLE : Gain From Ascending Base Pattern Backed by Above Average Volume - 12/15/2020 |
View all notes |
Set NEW NOTE alert |
Company Profile |
SEC
News |
Chart |
Request a new note
C
A
S
I |
TREX
-
NYSE
Trex Company Inc
MATERIALS and CONSTRUCTION - General Building Materials
|
$83.39
|
+1.05
1.28% |
$84.00
|
518,967
68.20% of 50 DAV
50 DAV is 761,000
|
$87.88
-5.11%
|
6/26/2020
|
$54.53
|
PP = $66.47
|
|
MB = $69.79
|
Most Recent Note - 1/5/2021 5:33:32 PM
G - Holding its ground stubbornly since a noted "negative reversal" on 12/28/20 at its 52-week high. Prior highs in the $80-81 area define initial support to watch above its 50 DMA line ($76.74). Recently noted that it reported Sep '20 quarterly earnings +14% on +19% sales revenues versus the year ago period, below the +25% minimum guideline (C criteria) raising fundamental concerns.
>>> FEATURED STOCK ARTICLE : Hit New High With Light Volume Behind 4th Consecutive Gain - 12/22/2020 |
View all notes |
Set NEW NOTE alert |
Company Profile |
SEC
News |
Chart |
Request a new note
C
A
S
I |
Symbol/Exchange
Company Name
Industry Group |
PRICE |
CHANGE
(%Change) |
Day High |
Volume
(% DAV)
(% 50 day avg vol) |
52 Wk Hi
% From Hi |
Featured
Date |
Price
Featured |
Pivot Featured |
|
Max Buy |
CLFD
-
NASDAQ
Clearfield Inc
TELECOMMUNICATIONS - Cables / Satalite Equipment
|
$24.32
|
+0.13
0.54% |
$24.55
|
57,204
57.20% of 50 DAV
50 DAV is 100,000
|
$28.32
-14.12%
|
11/17/2020
|
$22.06
|
PP = $26.07
|
|
MB = $27.37
|
Most Recent Note - 1/4/2021 6:24:06 PM
Y - Slumped further below the pivot point with today's big loss on higher (near average) volume. Near term support is defined by its 50 DMA line ($23.74) and an upward trendline. Churned higher volume in recent weeks without making meaningful price progress, action indicative of distributional pressure. See the latest FSU analysis for more details and a new annotated graph.
>>> FEATURED STOCK ARTICLE : Distributional Pressure While Testing Important Chart Support - 1/4/2021 |
View all notes |
Set NEW NOTE alert |
Company Profile |
SEC
News |
Chart |
Request a new note
C
A
S
I |
NOW
-
NYSE
Servicenow Inc
Computer Sftwr-Enterprse
|
$531.97
|
+5.14
0.98% |
$533.33
|
1,499,463
110.58% of 50 DAV
50 DAV is 1,356,000
|
$566.74
-6.14%
|
8/20/2020
|
$453.34
|
PP = $454.79
|
|
MB = $477.53
|
Most Recent Note - 1/4/2021 6:17:21 PM
G - Volume was above average behind today's big loss while retreating from near its all-time high and testing its 50 DMA line ($523). Found prompt support near its 50 DMA line during prior consolidations. Recently reported Sep '20 quarterly earnings +22% on +30% sales revenues versus the year ago period, below the +25% minimum guideline (C criteria) of the fact-based investment system.
>>> FEATURED STOCK ARTICLE : Hit New Record High With Light Volume Behind Gain - 12/17/2020 |
View all notes |
Set NEW NOTE alert |
Company Profile |
SEC
News |
Chart |
Request a new note
C
A
S
I |
SMPL
-
NASDAQ
Simply Good Foods Co
Food-Confectionery
|
$30.45
|
+0.74
2.49% |
$30.48
|
1,146,671
81.27% of 50 DAV
50 DAV is 1,411,000
|
$32.03
-4.93%
|
12/28/2020
|
$30.40
|
PP = $31.44
|
|
MB = $33.01
|
Most Recent Note - 1/4/2021 6:08:53 PM
Y - There was a "negative reversal" today after hitting a new all-time high. Subsequent gains above its pivot point backed by at least +40% above average volume may trigger a technical buy signal. Gapped up and rallied on recent news it was added to the S&P 600 Small Cap Index. Completed a new Pubic Offering on 10/09/19. Reported earnings +33% on +60% sales revenues for the Aug '20 quarter versus the year ago period, its 3rd consecutive quarterly comparison above the +25% minimum earnings guideline (C criteria). Annual earnings history (A criteria) has been strong.
>>> FEATURED STOCK ARTICLE : Challenging All-Time High as it Joins Small Cap Index - 12/28/2020 |
View all notes |
Set NEW NOTE alert |
Company Profile |
SEC
News |
Chart |
Request a new note
C
A
S
I |
ALRM
-
NASDAQ
Alarm.com Holdings Inc
Security/Sfty
|
$102.22
|
+1.77
1.76% |
$104.35
|
376,175
86.88% of 50 DAV
50 DAV is 433,000
|
$105.19
-2.82%
|
11/6/2020
|
$71.88
|
PP = $74.76
|
|
MB = $78.50
|
Most Recent Note - 1/4/2021 6:14:12 PM
G - Suffered a loss today on average volume. Very extended from any sound base. Its 50 DMA line ($76.97) and prior high ($74.66 on 7/23/20) define important near-term support to watch on pullbacks.
>>> FEATURED STOCK ARTICLE : Perched at High After Impressive Streak of Gains - 12/24/2020 |
View all notes |
Set NEW NOTE alert |
Company Profile |
SEC
News |
Chart |
Request a new note
C
A
S
I |
TEAM
-
NASDAQ
Atlassian Corp Plc Cl A
Comp Sftwr-Spec Enterprs
|
$234.42
|
+2.86
1.24% |
$235.35
|
1,106,023
62.95% of 50 DAV
50 DAV is 1,757,000
|
$250.03
-6.24%
|
10/12/2020
|
$193.77
|
PP = $199.60
|
|
MB = $209.58
|
Most Recent Note - 1/5/2021 5:29:16 PM
G - Extended from any sound base, still consolidating well above its prior high and above its 50 DMA line which coincide defining important near-term support in the $216 area. Showed resilience and strength after earnings rose +7% on +26% sales revenues for the Sep '20 quarter versus the year ago period, below the +25% minimum earnings guideline (C criteria), raising concerns.
>>> FEATURED STOCK ARTICLE : Extended From Any Base After Streak of Gains for New Highs - 12/18/2020 |
View all notes |
Set NEW NOTE alert |
Company Profile |
SEC
News |
Chart |
Request a new note
C
A
S
I |
Symbol/Exchange
Company Name
Industry Group |
PRICE |
CHANGE
(%Change) |
Day High |
Volume
(% DAV)
(% 50 day avg vol) |
52 Wk Hi
% From Hi |
Featured
Date |
Price
Featured |
Pivot Featured |
|
Max Buy |
SHOP
-
NYSE
Shopify Inc Cl A
Computer Sftwr-Enterprse
|
$1,118.74
|
+26.34
2.41% |
$1,118.74
|
897,900
58.19% of 50 DAV
50 DAV is 1,543,000
|
$1,285.19
-12.95%
|
12/16/2020
|
$1,146.00
|
PP = $1,147.01
|
|
MB = $1,204.36
|
Most Recent Note - 1/4/2021 6:22:19 PM
Y - Suffered a big loss today with higher (near average) volume, slumping below prior highs in the $1,146-1,130 area and falling back into the prior base raising concerns. Its 50 DMA line ($1,045) defines the next important support to watch. Reported Sep '20 quarterly earnings of $1.13 per share versus a loss of 29 cents per share on +96% sales revenues versus the year ago period. The Ontario, Canada-based Computer Software - Enterprise firm's prior quarters showed big earnings and sales revenues growth. After years of losses it had strong earnings growth in FY '17-19 (A criteria).
>>> FEATURED STOCK ARTICLE : Volume-Driven Gain for New High After Long Consolidation - 12/16/2020 |
View all notes |
Set NEW NOTE alert |
Company Profile |
SEC
News |
Chart |
Request a new note
C
A
S
I |
YETI
-
NYSE
Yeti Holdings Inc
Leisure-Products
|
$69.62
|
+1.14
1.66% |
$70.04
|
559,129
46.17% of 50 DAV
50 DAV is 1,211,000
|
$74.82
-6.95%
|
11/5/2020
|
$57.25
|
PP = $55.14
|
|
MB = $57.90
|
Most Recent Note - 1/5/2021 5:35:39 PM
G - Posted a 3rd consecutive gain today with well below average volume. Consolidating after quietly wedging to new all-time highs with recent gains lacking great volume conviction. Its 50 DMA line ($62.43) defines initial support to watch above prior highs in the $55-54 area.
>>> FEATURED STOCK ARTICLE : Pulling Back After Recently Wedging to New Highs - 12/29/2020 |
View all notes |
Set NEW NOTE alert |
Company Profile |
SEC
News |
Chart |
Request a new note
C
A
S
I |
AAXN
-
NASDAQ
Axon Enterprise Inc
Security/Sfty
|
$122.30
|
+5.45
4.66% |
$122.54
|
649,580
123.03% of 50 DAV
50 DAV is 528,000
|
$134.73
-9.23%
|
12/22/2020
|
$127.84
|
PP = $130.51
|
|
MB = $137.04
|
Most Recent Note - 1/5/2021 5:25:41 PM
Y - Color code is changed to yellow after today's big gain and prompt rebound above its 50 DMA line helped its outlook to improve. A subsequent gain and new high close above the pivot point backed by at least +40% above average volume is needed to reconfirm a new (or add-on) technical buy signal. Fundamentals remain strong.
>>> FEATURED STOCK ARTICLE : New All-Time High With Today's 5th Consecutive Gain - 12/23/2020 |
View all notes |
Set NEW NOTE alert |
Company Profile |
SEC
News |
Chart |
Request a new note
C
A
S
I |
QTWO
-
NYSE
Q2 Holdings Inc
Computer Sftwr-Financial
|
$124.30
|
+0.37
0.30% |
$126.30
|
264,482
60.94% of 50 DAV
50 DAV is 434,000
|
$130.59
-4.82%
|
11/12/2020
|
$105.14
|
PP = $106.54
|
|
MB = $111.87
|
Most Recent Note - 1/4/2021 6:19:18 PM
G - Pulled back with below average volume today, still hovering near its all-time high. Its 50 DMA line ($111.45) defines important near term support to watch above the prior high in the $106 area.
>>> FEATURED STOCK ARTICLE : Stubbornly Holding Ground Extended From Prior Base - 12/31/2020 |
View all notes |
Set NEW NOTE alert |
Company Profile |
SEC
News |
Chart |
Request a new note
C
A
S
I |
|
|
|
THESE ARE NOT BUY RECOMMENDATIONS!
Comments contained in the body of this report are technical
opinions only. The material herein has been obtained
from sources believed to be reliable and accurate, however,
its accuracy and completeness cannot be guaranteed.
This site is not an investment advisor, hence it does
not endorse or recommend any securities or other investments.
Any recommendation contained in this report may not
be suitable for all investors and it is not to be deemed
an offer or solicitation on our part with respect to
the purchase or sale of any securities. All trademarks,
service marks and trade names appearing in this report
are the property of their respective owners, and are
likewise used for identification purposes only.
This report is a service available
only to active Paid Premium Members.
You may opt-out of receiving report notifications
at any time. Questions or comments may be submitted
by writing to Premium Membership Services 665 S.E. 10 Street, Suite 201 Deerfield Beach, FL 33441-5634 or by calling 1-800-965-8307
or 954-785-1121.
|
|
|