You are not logged in.
This means you
CAN ONLY VIEW reports that were published prior to Thursday, March 20, 2025.
You
MUST UPGRADE YOUR MEMBERSHIP if you want to see any current reports.
AFTER MARKET UPDATE - WEDNESDAY, JANUARY 13TH, 2021
Previous After Market Report Next After Market Report >>>
|
|
|
|
DOW |
-8.22 |
31,060.47 |
-0.03% |
|
Volume |
944,670,855 |
-11% |
|
Volume |
7,015,262,400 |
-3% |
|
NASDAQ |
+56.52 |
13,128.95 |
+0.43% |
|
Advancers |
1,658 |
53% |
|
Advancers |
1,725 |
46% |
|
S&P 500 |
+9.83 |
3,811.02 |
+0.26% |
|
Decliners |
1,464 |
47% |
|
Decliners |
2,034 |
54% |
|
Russell 2000 |
-15.99 |
2,111.97 |
-0.75% |
|
52 Wk Highs |
278 |
|
|
52 Wk Highs |
429 |
|
|
S&P 600 |
-10.30 |
1,205.16 |
-0.85% |
|
52 Wk Lows |
2 |
|
|
52 Wk Lows |
6 |
|
|
 |
Major Indices Were Little Changed While Nasdaq Composite Led
Kenneth J. Gruneisen - Passed the CAN SLIM® Master's Exam
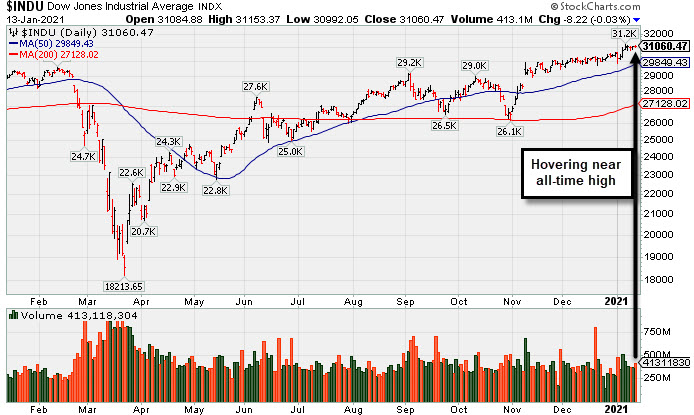
The Dow fell just 8 points, while the S&P 500 added 0.2%. The Nasdaq Composite advanced 0.4%. The volume totals were lighter than the prior session on both the NYSE and the Nasdaq exchange. Breadth was fairly even as advancers led decliners by an 8-7 margin on the NYSE while decliners led advancers by a narrow margin on the Nasdaq exchange. There were 79 high-ranked companies from the Leaders List that hit new 52-week highs and were listed on the BreakOuts Page, down from 124 total on the prior session. New 52-week highs totals contracted yet still easily outnumbered the new 52-week lows totals which were in the single digits on both exchanges. The major indices are in a confirmed uptrend (M criteria). Investors are reminded to always make buying and selling decisions based based on the strict criteria and rules of the fact-based investment system. PICTURED: The Dow Jones Industrial Average is hovering near its record high.
U.S. stocks finished mostly higher on Wednesday, as investors looked past political headlines and awaited updates on fiscal spending. President-elect Joe Biden will provide details on what is expected to be a wide-ranging stimulus plan tomorrow after the close. Market participants also continued to assess COVID-19 concerns, including rising global infections and a slower-than-anticipated vaccine rollout.
Seven of 11 S&P 500 sectors ended in positive territory, with Utilities and Real Estate pacing the gains. Information Technology was a notable outperformer, with shares of Intel (INTC +6.97%) jumping after the chipmaker announced a leadership change. The cyclical-oriented Materials and Industrial groups lagged. Energy also underperformed, following the group's 3.5% jump on Tuesday. In other corporate news, KB Homes (KBH +2.52%) rose after beating on the top and bottom line and reporting better-than-expected order growth. General Motors (GM +1.90%) rose on news the auto maker is launching a new electric-truck business.
Treasuries advanced following strong demand for the $24 billion 30-year bond auction. The yield on the benchmark 10-year note slipped four basis points to 1.09%, while the yield on the 30-year bond slumped six basis points to 1.82%. On the data front, core CPI (ex-food and energy) rose 1.6% year-over-year in December following a similar 1.6% increase in November. A separate update revealed the U.S. December budget deficit widened to $143.6 billion, which is a record for the month. In FOREX trading, the dollar rose 0.3% after falling 0.5% on Tuesday. |
 Kenneth J. Gruneisen started out as a licensed stockbroker in August 1987, a couple of months prior to the historic stock market crash that took the Dow Jones Industrial Average down -22.6% in a single day. He has published daily fact-based fundamental and technical analysis on high-ranked stocks online for two decades. Through FACTBASEDINVESTING.COM, Kenneth provides educational articles, news, market commentary, and other information regarding proven investment systems that work in good times and bad.
Comments contained in the body of this report are technical opinions only and are not necessarily those of Gruneisen Growth Corp. The material herein has been obtained from sources believed to be reliable and accurate, however, its accuracy and completeness cannot be guaranteed. Our firm, employees, and customers may effect transactions, including transactions contrary to any recommendation herein, or have positions in the securities mentioned herein or options with respect thereto. Any recommendation contained in this report may not be suitable for all investors and it is not to be deemed an offer or solicitation on our part with respect to the purchase or sale of any securities. |
|
 |
Retail Index Posted Standout Gain
Kenneth J. Gruneisen - Passed the CAN SLIM® Master's Exam
The Retail Index ($RLX +0.43%) posted a modest gain but weakness in the Broker/Dealer Index ($XBD -0.82%) and Bank Index ($BKX -0.53%) created a drag on the major indices. The tech sector had a negative bias as the Networking Index ($NWX -1.41%) and Biotech Index ($BTK -0.86%) lost ground, meanwhile the Semiconductor Index ($SOX +0.13%) eked out a tiny gain. Commodity-linked groups also had a negative bias as the Oil Services Index ($OSX -2.54%), Integrated Oil Index ($XOI -1.40%), and Gold & Silver Index ($XAU -1.67%) posted unanimous losses.
.
PICTURED: The Broker/Dealer Index ($XBD -0.82%) pulled back on Wednesday yet remains perched near its all-time high.
| Oil Services |
$OSX |
52.38 |
-1.36 |
-2.54% |
+18.15% |
| Integrated Oil |
$XOI |
894.42 |
-12.72 |
-1.40% |
+12.86% |
| Semiconductor |
$SOX |
2,991.95 |
+3.93 |
+0.13% |
+7.03% |
| Networking |
$NWX |
730.82 |
-10.46 |
-1.41% |
+1.91% |
| Broker/Dealer |
$XBD |
398.05 |
-3.30 |
-0.82% |
+5.42% |
| Retail |
$RLX |
3,580.10 |
+15.50 |
+0.43% |
+0.47% |
| Gold & Silver |
$XAU |
142.33 |
-2.41 |
-1.67% |
-1.29% |
| Bank |
$BKX |
108.55 |
-0.57 |
-0.53% |
+10.86% |
| Biotech |
$BTK |
5,952.11 |
-51.37 |
-0.86% |
+3.71% |
|
|
|
 |
Distributional Pressure Brings Pullback Below "Max Buy" Level
Kenneth J. Gruneisen - Passed the CAN SLIM® Master's Exam
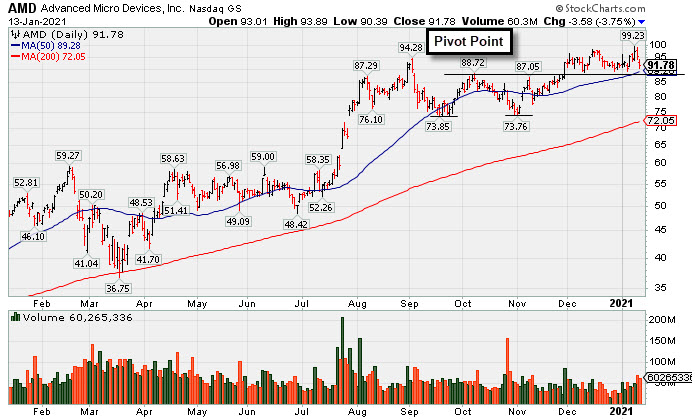
Advanced Micro Devices (AMD -$3.58 or -3.75% to $91.78) encountered distributional pressure with today's 2nd consecutive volume-driven loss after wedging to touch a new all-time high with unimpressive volume behind gains. Its color code was changed to yellow after pulling back below its "max buy" level. Recent lows in the $89 area and its 50-day moving average (DMA) line ($89.28) coincide defining important near term support to watch.
It reported earnings +128% on +56% sales revenues for the Sep '20 quarter versus the year ago period and announced plans to acquire Xilinx Inc (XLNX). The 5 latest quarterly comparisons through Sep '20 showed very strong earnings increases w ell above the +25% minimum guideline (C criteria) with strong underlying sales revenues growth versus the year ago periods. Annual earnings growth (A criteria) has been very strong after losses in FY '15 and '16. it has a highest possible 99 Earnings Per Share Rating.
AMD hails from the Electronics - Semiconductor Fabless industry which has a Group Relative Strength Rating of 59 (L criteria). It has a large supply of 1.20 billion shares outstanding (S criteria), which makes it less likely to be a quick sprinter. However, the number of top-rated funds owning its shares rose from 1,669 in Jun '19 to 2,382 in Sep '20, a reassuring sign concerning the I criteria. Its current Up/Down Volume Ratio of 1.0 is an unbiased indication its shares have been neutral concerning accumulation/distribution over the past 50 days. It has a Timeliness Rating of B, a Sponsorship Rating of A, and an Accumulation/Distribution rating of B-.
|
|
|
Color Codes Explained :
Y - Better candidates highlighted by our
staff of experts.
G - Previously featured
in past reports as yellow but may no longer be buyable under the
guidelines.
***Last / Change / Volume data in this table is the closing quote data***
Symbol/Exchange
Company Name
Industry Group |
PRICE |
CHANGE
(%Change) |
Day High |
Volume
(% DAV)
(% 50 day avg vol) |
52 Wk Hi
% From Hi |
Featured
Date |
Price
Featured |
Pivot Featured |
|
Max Buy |
 CRL
-
NYSE
CRL
-
NYSE
Charles River Labs Intl
DRUGS - Biotechnology
|
$267.49
|
-0.75
-0.28% |
$268.55
|
253,067
84.30% of 50 DAV
50 DAV is 300,200
|
$278.08
-3.81%
|
12/17/2020
|
$247.06
|
PP = $257.98
|
|
MB = $270.88
|
Most Recent Note - 1/12/2021 7:02:13 PM
Y - Pulled back today breaking a streak of 5 consecutive gains for new all-time highs. Recent gains above its pivot point backed by at least +40% above average volume helped clinch a proper new (or add-on) technical buy signal. Its 50 DMA line ($242.91) acted as support. Reported Sep '20 quarterly earnings +38% on +11% sales revenues versus the year ago period, above the +25% minimum earnings guideline (C criteria).
>>> FEATURED STOCK ARTICLE : Hovering in Tight Range Holding Ground Near High - 1/5/2021 |
View all notes |
Set NEW NOTE alert |
Company Profile |
SEC
News |
Chart |
Request a new note
C
A
S
I |
AMD
-
NASDAQ
Advanced Micro Devices
ELECTRONICS - Semiconductor - Broad Line
|
$91.78
|
-3.58
-3.75% |
$93.89
|
60,187,537
140.34% of 50 DAV
50 DAV is 42,888,000
|
$99.23
-7.51%
|
11/18/2020
|
$82.54
|
PP = $88.72
|
|
MB = $93.16
|
 Most Recent Note - 1/13/2021 6:00:06 PM
Y - Color code is changed to yellow after pulling below its "max buy" level with today's 2nd consecutive volume-driven loss. Recently wedged to to a new all-time high with unimpressive volume behind gains. Its recent lows in the $89 area and its 50 DMA line ($89.28) coincide defining important near term support to watch. See the latest FSU analysis for more details and a new annotated graph.
>>> FEATURED STOCK ARTICLE : Distributional Pressure Brings Pullback Below "Max Buy" Level - 1/13/2021 |
View all notes |
Set NEW NOTE alert |
Company Profile |
SEC
News |
Chart |
Request a new note
C
A
S
I |
TER
-
NASDAQ
Teradyne Inc
ELECTRONICS - Semiconductor Equipment and Mate
|
$136.02
|
-1.07
-0.78% |
$137.34
|
1,452,221
99.88% of 50 DAV
50 DAV is 1,454,000
|
$139.53
-2.52%
|
10/21/2020
|
$92.22
|
PP = $93.54
|
|
MB = $98.22
|
Most Recent Note - 1/11/2021 12:24:44 PM
G - Hitting yet another new all-time high with today's 5th consecutive gain, very extended from any sound base. Support to watch on pullbacks is its 50 DMA line ($111.55).
>>> FEATURED STOCK ARTICLE : Perched Near Record High Very Extended From Any Sound Base - 12/30/2020 |
View all notes |
Set NEW NOTE alert |
Company Profile |
SEC
News |
Chart |
Request a new note
C
A
S
I |
AMRC
-
NYSE
Ameresco Inc Cl A
ENERGY - Alternative
|
$59.04
|
-0.90
-1.50% |
$60.51
|
486,253
114.41% of 50 DAV
50 DAV is 425,000
|
$63.45
-6.95%
|
12/15/2020
|
$46.72
|
PP = $47.10
|
|
MB = $49.46
|
Most Recent Note - 1/11/2021 11:56:48 AM
G - Pulling back from its all-time high with today's loss after 4 consecutive volume-driven gains, getting very extended from any sound base. Its 50 DMA line ($46.45) and prior highs in the $46-47 area define important near-term support to watch on pullbacks.
>>> FEATURED STOCK ARTICLE : Very Extended From Base After Another Powerful Gain - 1/6/2021 |
View all notes |
Set NEW NOTE alert |
Company Profile |
SEC
News |
Chart |
Request a new note
C
A
S
I |
TREX
-
NYSE
Trex Company Inc
MATERIALS and CONSTRUCTION - General Building Materials
|
$92.16
|
+0.28
0.30% |
$93.17
|
582,866
76.39% of 50 DAV
50 DAV is 763,000
|
$92.33
-0.18%
|
6/26/2020
|
$54.53
|
PP = $66.47
|
|
MB = $69.79
|
Most Recent Note - 1/12/2021 7:05:52 PM
G - Posted another gain today with light volume for a best ever close. Prior highs in the $80-81 area define initial support to watch above its 50 DMA line ($78.34). Recently noted that it reported Sep '20 quarterly earnings +14% on +19% sales revenues versus the year ago period, below the +25% minimum guideline (C criteria) raising fundamental concerns.
>>> FEATURED STOCK ARTICLE : Hit New High With Light Volume Behind 4th Consecutive Gain - 12/22/2020 |
View all notes |
Set NEW NOTE alert |
Company Profile |
SEC
News |
Chart |
Request a new note
C
A
S
I |
Symbol/Exchange
Company Name
Industry Group |
PRICE |
CHANGE
(%Change) |
Day High |
Volume
(% DAV)
(% 50 day avg vol) |
52 Wk Hi
% From Hi |
Featured
Date |
Price
Featured |
Pivot Featured |
|
Max Buy |
CLFD
-
NASDAQ
Clearfield Inc
TELECOMMUNICATIONS - Cables / Satalite Equipment
|
$27.05
|
-0.13
-0.48% |
$27.34
|
80,366
79.57% of 50 DAV
50 DAV is 101,000
|
$28.32
-4.48%
|
11/17/2020
|
$22.06
|
PP = $26.07
|
|
MB = $27.37
|
Most Recent Note - 1/12/2021 6:59:48 PM
Y - Posted a 6th consecutive gain today with light volume for a best-ever close. Volume totals have been cooling while hovering within striking distance of its 52-week high. Recently found prompt support at its 50 DMA line ($24.28) and upward trendline when consolidating.
>>> FEATURED STOCK ARTICLE : Distributional Pressure While Testing Important Chart Support - 1/4/2021 |
View all notes |
Set NEW NOTE alert |
Company Profile |
SEC
News |
Chart |
Request a new note
C
A
S
I |
NOW
-
NYSE
Servicenow Inc
Computer Sftwr-Enterprse
|
$521.71
|
+8.50
1.66% |
$523.70
|
1,071,939
78.71% of 50 DAV
50 DAV is 1,361,800
|
$566.74
-7.95%
|
8/20/2020
|
$453.34
|
PP = $454.79
|
|
MB = $477.53
|
Most Recent Note - 1/13/2021 6:03:32 PM
G - Today's big gain with lighter volume helped it rebound toward its 50 DMA line ($526) after recently slumping below that important short term average raising concerns. Recently reported Sep '20 quarterly earnings +22% on +30% sales revenues versus the year ago period, below the +25% minimum guideline (C criteria) of the fact-based investment system.
>>> FEATURED STOCK ARTICLE : Gain Today and Rebound Above 50-Day Moving Average Line - 1/8/2021 |
View all notes |
Set NEW NOTE alert |
Company Profile |
SEC
News |
Chart |
Request a new note
C
A
S
I |
SMPL
-
NASDAQ
Simply Good Foods Co
Food-Confectionery
|
$28.70
|
-0.01
-0.03% |
$29.02
|
638,304
46.51% of 50 DAV
50 DAV is 1,372,300
|
$32.03
-10.40%
|
12/28/2020
|
$30.40
|
PP = $31.44
|
|
MB = $33.01
|
Most Recent Note - 1/12/2021 7:08:12 PM
Y - Pulled back today for a 3rd consecutive loss on light volume. Quietly consolidating after a "negative reversal" on 1/04/21 at its all-time high. Subsequent gains above its pivot point backed by at least +40% above average volume may trigger a technical buy signal.
>>> FEATURED STOCK ARTICLE : Challenging All-Time High as it Joins Small Cap Index - 12/28/2020 |
View all notes |
Set NEW NOTE alert |
Company Profile |
SEC
News |
Chart |
Request a new note
C
A
S
I |
ALRM
-
NASDAQ
Alarm.com Holdings Inc
Security/Sfty
|
$107.69
|
+1.69
1.59% |
$108.67
|
243,264
54.91% of 50 DAV
50 DAV is 443,000
|
$107.18
0.48%
|
11/6/2020
|
$71.88
|
PP = $74.76
|
|
MB = $78.50
|
Most Recent Note - 1/12/2021 6:58:33 PM
G - Posted a small gain today with above average volume for a best ever close. Very extended from any sound base. Its 50 DMA line ($82.29) and prior high ($74.66 on 7/23/20) define important near-term support to watch on pullbacks.
>>> FEATURED STOCK ARTICLE : Perched at High After Impressive Streak of Gains - 12/24/2020 |
View all notes |
Set NEW NOTE alert |
Company Profile |
SEC
News |
Chart |
Request a new note
C
A
S
I |
TEAM
-
NASDAQ
Atlassian Corp Plc
Comp Sftwr-Spec Enterprs
|
$229.87
|
-4.32
-1.84% |
$234.86
|
1,312,581
76.51% of 50 DAV
50 DAV is 1,715,500
|
$250.03
-8.06%
|
10/12/2020
|
$193.77
|
PP = $199.60
|
|
MB = $209.58
|
Most Recent Note - 1/11/2021 5:52:39 PM
G - Consolidating above its 50 DMA line ($218.81) and prior high in the $216 area which define important near-term support to watch. Its current Relative Strength Rating is 75, below the +80 minimum guideline for buy candidates. Earnings rose +7% on +26% sales revenues for the Sep '20 quarter versus the year ago period, below the +25% minimum earnings guideline (C criteria), raising concerns. See the latest FSU analysis for more details and a new annotated graph.
>>> FEATURED STOCK ARTICLE : Relative Strength Rating Remains Below 80+ Minimum Guideline - 1/11/2021 |
View all notes |
Set NEW NOTE alert |
Company Profile |
SEC
News |
Chart |
Request a new note
C
A
S
I |
Symbol/Exchange
Company Name
Industry Group |
PRICE |
CHANGE
(%Change) |
Day High |
Volume
(% DAV)
(% 50 day avg vol) |
52 Wk Hi
% From Hi |
Featured
Date |
Price
Featured |
Pivot Featured |
|
Max Buy |
SHOP
-
NYSE
Shopify Inc Cl A
Computer Sftwr-Enterprse
|
$1,199.82
|
+11.58
0.97% |
$1,201.97
|
692,582
46.89% of 50 DAV
50 DAV is 1,477,000
|
$1,285.19
-6.64%
|
12/16/2020
|
$1,146.00
|
PP = $1,147.01
|
|
MB = $1,204.36
|
Most Recent Note - 1/12/2021 7:04:32 PM
Y - Volume totals have been cooling while consolidating. Found prompt support near prior highs in the $1,146-1,130 area and above its 50 DMA line ($1,060) which defines the next important support to watch.
>>> FEATURED STOCK ARTICLE : Rebounded After Undercutting Prior Highs - 1/7/2021 |
View all notes |
Set NEW NOTE alert |
Company Profile |
SEC
News |
Chart |
Request a new note
C
A
S
I |
YETI
-
NYSE
Yeti Holdings Inc
Leisure-Products
|
$77.84
|
-0.20
-0.26% |
$79.86
|
634,624
52.80% of 50 DAV
50 DAV is 1,202,000
|
$78.19
-0.45%
|
11/5/2020
|
$57.25
|
PP = $55.14
|
|
MB = $57.90
|
Most Recent Note - 1/12/2021 7:07:05 PM
G - Hit yet another new all-time high with today's 8th consecutive gain, getting more extended from any sound base. Its 50 DMA line ($64.67) defines initial support to watch on pullbacks.
>>> FEATURED STOCK ARTICLE : Pulling Back After Recently Wedging to New Highs - 12/29/2020 |
View all notes |
Set NEW NOTE alert |
Company Profile |
SEC
News |
Chart |
Request a new note
C
A
S
I |
DOCU
-
NASDAQ
Docusign Inc
Computer Sftwr-Enterprse
|
$255.85
|
-6.80
-2.59% |
$262.31
|
4,409,352
111.88% of 50 DAV
50 DAV is 3,941,000
|
$290.23
-11.85%
|
1/12/2021
|
$253.50
|
PP = $256.10
|
|
MB = $268.91
|
Most Recent Note - 1/13/2021 6:01:35 PM
Y - Pulled back today with lighter (near average) volume. Finished strong on the prior session after highlighted in yellow with pivot point cited based on its 12/04/20 high plus 10 cents. The big gain and strong close above the pivot point backed by twice average volume clinched a technical buy signal. Recently found support near its 50 DMA line. Fundamentals remain strong. See the latest FSU analysis for more details and an annotated graph.
>>> FEATURED STOCK ARTICLE : Twice Average Volume Behind Breakout Gain - 1/12/2021 |
View all notes |
Set NEW NOTE alert |
Company Profile |
SEC
News |
Chart |
Request a new note
C
A
S
I |
AAXN
-
NASDAQ
Axon Enterprise Inc
Security/Sfty
|
$145.26
|
+10.26
7.60% |
$146.06
|
1,169,230
211.05% of 50 DAV
50 DAV is 554,000
|
$135.05
7.56%
|
12/22/2020
|
$127.84
|
PP = $130.51
|
|
MB = $137.04
|
Most Recent Note - 1/13/2021 1:35:42 PM
G - Color code is changed to green after rallying for new all-time highs well above its "max buy" level with above average volume behind today's 2nd consecutive big gain. Rallied from support at its 50 DMA line ($122.89). Fundamentals remain strong.
>>> FEATURED STOCK ARTICLE : New All-Time High With Today's 5th Consecutive Gain - 12/23/2020 |
View all notes |
Set NEW NOTE alert |
Company Profile |
SEC
News |
Chart |
Request a new note
C
A
S
I |
QTWO
-
NYSE
Q2 Holdings Inc
Computer Sftwr-Financial
|
$128.01
|
+0.01
0.01% |
$128.94
|
270,133
58.47% of 50 DAV
50 DAV is 462,000
|
$130.59
-1.98%
|
11/12/2020
|
$105.14
|
PP = $106.54
|
|
MB = $111.87
|
Most Recent Note - 1/13/2021 6:04:25 PM
G - Posted a 4th consecutive gain today on light volume while challenging its all-time high. Its 50 DMA line ($115.91) defines important near term support to watch above the prior high in the $106 area.
>>> FEATURED STOCK ARTICLE : Stubbornly Holding Ground Extended From Prior Base - 12/31/2020 |
View all notes |
Set NEW NOTE alert |
Company Profile |
SEC
News |
Chart |
Request a new note
C
A
S
I |
Symbol/Exchange
Company Name
Industry Group |
PRICE |
CHANGE
(%Change) |
Day High |
Volume
(% DAV)
(% 50 day avg vol) |
52 Wk Hi
% From Hi |
Featured
Date |
Price
Featured |
Pivot Featured |
|
Max Buy |
|
|
|
THESE ARE NOT BUY RECOMMENDATIONS!
Comments contained in the body of this report are technical
opinions only. The material herein has been obtained
from sources believed to be reliable and accurate, however,
its accuracy and completeness cannot be guaranteed.
This site is not an investment advisor, hence it does
not endorse or recommend any securities or other investments.
Any recommendation contained in this report may not
be suitable for all investors and it is not to be deemed
an offer or solicitation on our part with respect to
the purchase or sale of any securities. All trademarks,
service marks and trade names appearing in this report
are the property of their respective owners, and are
likewise used for identification purposes only.
This report is a service available
only to active Paid Premium Members.
You may opt-out of receiving report notifications
at any time. Questions or comments may be submitted
by writing to Premium Membership Services 665 S.E. 10 Street, Suite 201 Deerfield Beach, FL 33441-5634 or by calling 1-800-965-8307
or 954-785-1121.
|
|
|