You are not logged in.
This means you
CAN ONLY VIEW reports that were published prior to Thursday, March 20, 2025.
You
MUST UPGRADE YOUR MEMBERSHIP if you want to see any current reports.
AFTER MARKET UPDATE - WEDNESDAY, JANUARY 6TH, 2021
Previous After Market Report Next After Market Report >>>
|
|
|
|
DOW |
+437.80 |
30,829.40 |
+1.44% |
|
Volume |
1,400,448,871 |
+41% |
|
Volume |
7,561,756,200 |
+11% |
|
NASDAQ |
-78.17 |
12,740.79 |
-0.61% |
|
Advancers |
1,967 |
63% |
|
Advancers |
2,247 |
62% |
|
S&P 500 |
+21.28 |
3,748.14 |
+0.57% |
|
Decliners |
1,142 |
37% |
|
Decliners |
1,399 |
38% |
|
Russell 2000 |
+78.81 |
2,057.92 |
+3.98% |
|
52 Wk Highs |
374 |
|
|
52 Wk Highs |
483 |
|
|
S&P 600 |
+53.99 |
1,185.02 |
+4.77% |
|
52 Wk Lows |
6 |
|
|
52 Wk Lows |
10 |
|
|
 |
Small Caps Outpaced Other Major Indices
Kenneth J. Gruneisen - Passed the CAN SLIM® Master's Exam
The Dow jumped 437 points to a fresh record high. The S&P 500 rose 0.6%. The Nasdaq Composite bucked the uptrend, falling 0.6%. Meanwhile, the Russell 2000 index of small cap stocks outperformed with a nearly 4% rally. The volume totals were mixed, lighter than the prior session volume total on the NYSE and higher on the Nasdaq exchange. Breadth was positive as advancers led decliners by more than a 3-2 margin on the NYSE and by an 11-7 margin on the Nasdaq exchange. There were 143 high-ranked companies from the Leaders List that hit new 52-week highs and were listed on the BreakOuts Page, versus the total of 50 on the prior session. New 52-week highs totals expanded and easily outnumbered new 52-week lows totals on both exchanges. The major indices are in a confirmed uptrend (M criteria). Investors are reminded to always make buying and selling decisions based based on the strict criteria and rules of the fact-based investment system. PICTURED: The S&P 600 Small Cap Index posted a big gain for a new record high.
U.S. equities finished mostly higher on Wednesday, as investors digested the outcome of the special run-off election in Georgia. The preliminary results indicated Democrats would gain both Senate seats, which would effectively give the party control of both chambers in Congress and raise the likelihood of additional fiscal stimulus. Stocks came off their session highs, however, as social unrest broke out on Capitol Hill, which interrupted Congressional proceedings certifying the presidential election.
Seven of 11 S&P 500 sectors ended in positive territory, with companies hardest hit by the pandemic pacing the gains. Financials led advancers with banks like Morgan Stanley (MS +6.03%) and Bank of America (BAC +6.28%). The Information Technology and Communication Services groups lagged, with the oft-cited FAANG group shedding 2.5%.
Speculation for additional coronavirus relief aid sent Treasuries firmly lower. The yield on the benchmark 10-year note jumped eight basis points to 1.03%, the highest level since March. On the data front, a report from the ADP showed that private payrolls unexpectedly fell by 123,000 in December, well below expectations of a 75,000 gain and November's 304,000-job increase. A separate release from research firm Markit showed activity in the U.S. services sector expanded at a slightly slower pace than anticipated. Elsewhere, the minutes from the Federal Reserve December FOMC meeting showed a nearly unanimous decision to leave asset-purchasing levels steady. |
 Kenneth J. Gruneisen started out as a licensed stockbroker in August 1987, a couple of months prior to the historic stock market crash that took the Dow Jones Industrial Average down -22.6% in a single day. He has published daily fact-based fundamental and technical analysis on high-ranked stocks online for two decades. Through FACTBASEDINVESTING.COM, Kenneth provides educational articles, news, market commentary, and other information regarding proven investment systems that work in good times and bad.
Comments contained in the body of this report are technical opinions only and are not necessarily those of Gruneisen Growth Corp. The material herein has been obtained from sources believed to be reliable and accurate, however, its accuracy and completeness cannot be guaranteed. Our firm, employees, and customers may effect transactions, including transactions contrary to any recommendation herein, or have positions in the securities mentioned herein or options with respect thereto. Any recommendation contained in this report may not be suitable for all investors and it is not to be deemed an offer or solicitation on our part with respect to the purchase or sale of any securities. |
|
 |
Financial, Energy, Biotech, and Networking Indexes Rose
Kenneth J. Gruneisen - Passed the CAN SLIM® Master's Exam
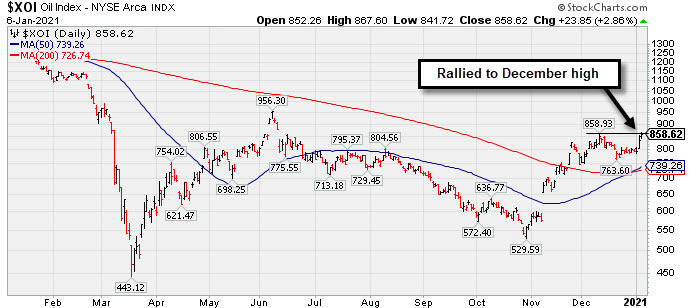
The Broker/Dealer Index ($XBD +4.63%) and Bank Index ($BKX +6.82%) posted standout gains which were a big influence on the major averages. The Retail Index ($RLX -0.25%) edged lower. The Biotech Index ($BTK +0.75%) and Networking Index ($NWX +0.43%) both posted modest gains, meanwhile, the Semiconductor Index ($SOX -0.32%) edged lower. The Oil Services Index ($OSX +3.50%) and Integrated Oil Index ($XOI +2.86%) both posted big gains. The Gold & Silver Index ($XAU +0.68%) edged higher.
PICTURED: The Integrated Oil Index ($XOI +2.86%) has rallied above its December high.
| Oil Services |
$OSX |
49.95 |
+1.69 |
+3.50% |
+12.68% |
| Integrated Oil |
$XOI |
858.62 |
+23.85 |
+2.86% |
+8.35% |
| Semiconductor |
$SOX |
2,827.96 |
-9.21 |
-0.32% |
+1.16% |
| Networking |
$NWX |
717.33 |
+3.07 |
+0.43% |
+0.03% |
| Broker/Dealer |
$XBD |
392.17 |
+17.36 |
+4.63% |
+3.86% |
| Retail |
$RLX |
3,526.22 |
-8.97 |
-0.25% |
-1.04% |
| Gold & Silver |
$XAU |
155.13 |
+1.05 |
+0.68% |
+7.58% |
| Bank |
$BKX |
104.78 |
+6.69 |
+6.82% |
+7.02% |
| Biotech |
$BTK |
5,816.08 |
+43.45 |
+0.75% |
+1.34% |
|
|
|
 |
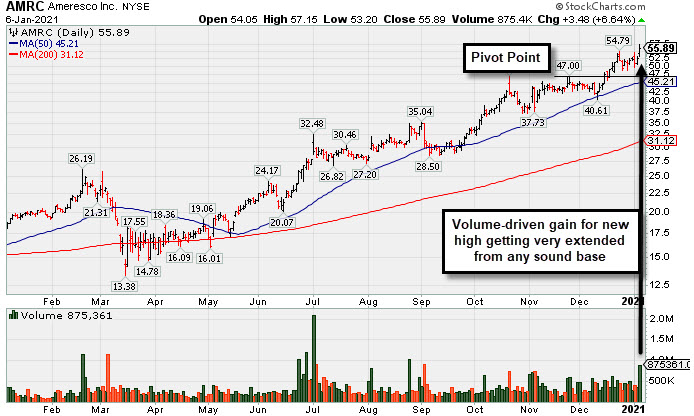
Very Extended From Base After Another Powerful Gain
Kenneth J. Gruneisen - Passed the CAN SLIM® Master's Exam
Ameresco Inc Cl A (AMRC +$3.48 or +6.64% to $55.89) powered to a new all-time high, getting more extended from any sound base with a big gain today backed by +129% above average volume. Prior highs in the $46-47 area define initial support to watch on pullbacks.
AMRC has traded up as much as +22.3% since it was highlighted in yellow with pivot point cited based on its 11/24/20 high plus 10 cents in the 12/15/20 mid-day report (read here). It was covered in greater detail in that evening's FSU section with an annotated graph under the headline, "Gain From Ascending Base Pattern Backed by Above Average Volume" It hit a new all-time high with +43% above average volume behind a 4th consecutive gain, rising from an advanced "ascending base" pattern.
AMRC reported earnings +111% on +33% sales revenues for the Sep '20 quarter versus the year ago period. Three of the 4 latest quarterly comparisons were above the +25% minimum earnings guideline (C criteria) with solid sales revenues growth. Its annual earnings (A criteria) history has been good and it has a 94 Earnings Per Share Rating, well above the 80+ minimum for buy candidates.
The ENERGY - Alternative group currently has 95 Group Relative Strength Rating (L criteria). It has only 21.2 million shares in the public float (S criteria) which can contribute to great price volatility in the event of institutional buying or selling. The number of top-rated funds owning its shares rose from 199 in Dec '19 to 286 in Sep '20, a reassuring sign concerning the I criteria. Its current Up/Down Volume Ratio of 2.0 is an unbiased indication its shares have been under accumulation over the past 50 days. |
|
|
Color Codes Explained :
Y - Better candidates highlighted by our
staff of experts.
G - Previously featured
in past reports as yellow but may no longer be buyable under the
guidelines.
***Last / Change / Volume data in this table is the closing quote data***
Symbol/Exchange
Company Name
Industry Group |
PRICE |
CHANGE
(%Change) |
Day High |
Volume
(% DAV)
(% 50 day avg vol) |
52 Wk Hi
% From Hi |
Featured
Date |
Price
Featured |
Pivot Featured |
|
Max Buy |
 CRL
-
NYSE
CRL
-
NYSE
Charles River Labs Intl
DRUGS - Biotechnology
|
$254.76
|
+2.17
0.86% |
$256.68
|
392,704
131.34% of 50 DAV
50 DAV is 299,000
|
$257.88
-1.21%
|
12/17/2020
|
$247.06
|
PP = $257.98
|
|
MB = $270.88
|
Most Recent Note - 1/5/2021 5:22:20 PM
Y - Posted a small gain today with light volume. The pivot point cited is based on its 11/09/20 high plus 10 cents. Subsequent gains above its pivot point backed by at least +40% above average volume may trigger a new (or add-on) technical buy signal. Its 50 DMA line ($239) has been acting as support. Reported Sep '20 quarterly earnings +38% on +11% sales revenues versus the year ago period, above the +25% minimum earnings guideline (C criteria). See the latest FSU analysis for more details and a new annotated graph.
>>> FEATURED STOCK ARTICLE : Hovering in Tight Range Holding Ground Near High - 1/5/2021 |
View all notes |
Set NEW NOTE alert |
Company Profile |
SEC
News |
Chart |
Request a new note
C
A
S
I |
AMD
-
NASDAQ
Advanced Micro Devices
ELECTRONICS - Semiconductor - Broad Line
|
$90.33
|
-2.44
-2.63% |
$92.28
|
51,580,219
112.36% of 50 DAV
50 DAV is 45,908,000
|
$97.98
-7.81%
|
11/18/2020
|
$82.54
|
PP = $88.72
|
|
MB = $93.16
|
Most Recent Note - 1/5/2021 5:37:27 PM
Y - Posted a 2nd consecutive gain today yet it is still hovering below its "max buy" level. Its 50 DMA line ($87.44) defines important near term support to watch on pullbacks.
>>> FEATURED STOCK ARTICLE : Pulling Back From its Record High Hit Last Week - 12/21/2020 |
View all notes |
Set NEW NOTE alert |
Company Profile |
SEC
News |
Chart |
Request a new note
C
A
S
I |
TER
-
NASDAQ
Teradyne Inc
ELECTRONICS - Semiconductor Equipment and Mate
|
$122.41
|
+0.92
0.76% |
$124.85
|
1,656,784
117.17% of 50 DAV
50 DAV is 1,414,000
|
$123.45
-0.84%
|
10/21/2020
|
$92.22
|
PP = $93.54
|
|
MB = $98.22
|
Most Recent Note - 1/5/2021 5:30:45 PM
G - Posted a gain today with lighter volume for a best-ever close. Stubbornly holding its ground with volume totals cooling. Support to watch on pullbacks is its 50 DMA line ($108.26).
>>> FEATURED STOCK ARTICLE : Perched Near Record High Very Extended From Any Sound Base - 12/30/2020 |
View all notes |
Set NEW NOTE alert |
Company Profile |
SEC
News |
Chart |
Request a new note
C
A
S
I |
AMRC
-
NYSE
Ameresco Inc Cl A
ENERGY - Alternative
|
$55.89
|
+3.48
6.64% |
$57.15
|
875,335
229.15% of 50 DAV
50 DAV is 382,000
|
$54.79
2.01%
|
12/15/2020
|
$46.72
|
PP = $47.10
|
|
MB = $49.46
|
 Most Recent Note - 1/6/2021 6:01:55 PM
G - Powered to a new all-time high, getting more extended from any sound base with a big gain today backed by +127% above average volume. Prior highs in the $46-47 area define initial support to watch on pullbacks. See the latest FSU analysis for more details and a new annotated graph.
>>> FEATURED STOCK ARTICLE : Very Extended From Base After Another Powerful Gain - 1/6/2021 |
View all notes |
Set NEW NOTE alert |
Company Profile |
SEC
News |
Chart |
Request a new note
C
A
S
I |
TREX
-
NYSE
Trex Company Inc
MATERIALS and CONSTRUCTION - General Building Materials
|
$86.24
|
+2.85
3.42% |
$87.37
|
792,217
104.51% of 50 DAV
50 DAV is 758,000
|
$87.88
-1.87%
|
6/26/2020
|
$54.53
|
PP = $66.47
|
|
MB = $69.79
|
Most Recent Note - 1/6/2021 6:10:39 PM
G - Posted a solid gain today with average volume challenging its 52-week high. Prior highs in the $80-81 area define initial support to watch above its 50 DMA line ($76.93). Recently noted that it reported Sep '20 quarterly earnings +14% on +19% sales revenues versus the year ago period, below the +25% minimum guideline (C criteria) raising fundamental concerns.
>>> FEATURED STOCK ARTICLE : Hit New High With Light Volume Behind 4th Consecutive Gain - 12/22/2020 |
View all notes |
Set NEW NOTE alert |
Company Profile |
SEC
News |
Chart |
Request a new note
C
A
S
I |
Symbol/Exchange
Company Name
Industry Group |
PRICE |
CHANGE
(%Change) |
Day High |
Volume
(% DAV)
(% 50 day avg vol) |
52 Wk Hi
% From Hi |
Featured
Date |
Price
Featured |
Pivot Featured |
|
Max Buy |
CLFD
-
NASDAQ
Clearfield Inc
TELECOMMUNICATIONS - Cables / Satalite Equipment
|
$25.48
|
+1.16
4.77% |
$25.88
|
59,530
59.53% of 50 DAV
50 DAV is 100,000
|
$28.32
-10.03%
|
11/17/2020
|
$22.06
|
PP = $26.07
|
|
MB = $27.37
|
Most Recent Note - 1/6/2021 6:06:26 PM
Y - Posted a 2nd consecutive gain with light volume today, finding prompt support at its 50 DMA line ($23.87) and at an upward trendline.
>>> FEATURED STOCK ARTICLE : Distributional Pressure While Testing Important Chart Support - 1/4/2021 |
View all notes |
Set NEW NOTE alert |
Company Profile |
SEC
News |
Chart |
Request a new note
C
A
S
I |
NOW
-
NYSE
Servicenow Inc
Computer Sftwr-Enterprse
|
$507.25
|
-24.72
-4.65% |
$520.94
|
1,940,161
141.62% of 50 DAV
50 DAV is 1,370,000
|
$566.74
-10.50%
|
8/20/2020
|
$453.34
|
PP = $454.79
|
|
MB = $477.53
|
Most Recent Note - 1/6/2021 6:03:56 PM
G - Volume was above average behind today's big loss violating its 50 DMA line ($523) and triggering a technical sell signal. Only a prompt rebound above the 50 DMA line would help its outlook improve. Recently reported Sep '20 quarterly earnings +22% on +30% sales revenues versus the year ago period, below the +25% minimum guideline (C criteria) of the fact-based investment system.
>>> FEATURED STOCK ARTICLE : Hit New Record High With Light Volume Behind Gain - 12/17/2020 |
View all notes |
Set NEW NOTE alert |
Company Profile |
SEC
News |
Chart |
Request a new note
C
A
S
I |
SMPL
-
NASDAQ
Simply Good Foods Co
Food-Confectionery
|
$30.06
|
-0.39
-1.28% |
$30.99
|
1,442,513
102.31% of 50 DAV
50 DAV is 1,410,000
|
$32.03
-6.15%
|
12/28/2020
|
$30.40
|
PP = $31.44
|
|
MB = $33.01
|
Most Recent Note - 1/4/2021 6:08:53 PM
Y - There was a "negative reversal" today after hitting a new all-time high. Subsequent gains above its pivot point backed by at least +40% above average volume may trigger a technical buy signal. Gapped up and rallied on recent news it was added to the S&P 600 Small Cap Index. Completed a new Pubic Offering on 10/09/19. Reported earnings +33% on +60% sales revenues for the Aug '20 quarter versus the year ago period, its 3rd consecutive quarterly comparison above the +25% minimum earnings guideline (C criteria). Annual earnings history (A criteria) has been strong.
>>> FEATURED STOCK ARTICLE : Challenging All-Time High as it Joins Small Cap Index - 12/28/2020 |
View all notes |
Set NEW NOTE alert |
Company Profile |
SEC
News |
Chart |
Request a new note
C
A
S
I |
ALRM
-
NASDAQ
Alarm.com Holdings Inc
Security/Sfty
|
$100.07
|
-2.15
-2.10% |
$101.63
|
467,325
107.68% of 50 DAV
50 DAV is 434,000
|
$105.19
-4.87%
|
11/6/2020
|
$71.88
|
PP = $74.76
|
|
MB = $78.50
|
Most Recent Note - 1/4/2021 6:14:12 PM
G - Suffered a loss today on average volume. Very extended from any sound base. Its 50 DMA line ($76.97) and prior high ($74.66 on 7/23/20) define important near-term support to watch on pullbacks.
>>> FEATURED STOCK ARTICLE : Perched at High After Impressive Streak of Gains - 12/24/2020 |
View all notes |
Set NEW NOTE alert |
Company Profile |
SEC
News |
Chart |
Request a new note
C
A
S
I |
TEAM
-
NASDAQ
Atlassian Corp Plc Cl A
Comp Sftwr-Spec Enterprs
|
$224.48
|
-9.94
-4.24% |
$230.20
|
1,596,972
91.83% of 50 DAV
50 DAV is 1,739,000
|
$250.03
-10.22%
|
10/12/2020
|
$193.77
|
PP = $199.60
|
|
MB = $209.58
|
Most Recent Note - 1/6/2021 6:08:50 PM
G - Its 50 DMA line ($217) and prior high in the $216 area define important near-term support to watch. Its Relative Strength Rating has slumped to 71, below the +80 minimum guideline for buy candidates. Earnings rose +7% on +26% sales revenues for the Sep '20 quarter versus the year ago period, below the +25% minimum earnings guideline (C criteria), raising concerns.
>>> FEATURED STOCK ARTICLE : Extended From Any Base After Streak of Gains for New Highs - 12/18/2020 |
View all notes |
Set NEW NOTE alert |
Company Profile |
SEC
News |
Chart |
Request a new note
C
A
S
I |
Symbol/Exchange
Company Name
Industry Group |
PRICE |
CHANGE
(%Change) |
Day High |
Volume
(% DAV)
(% 50 day avg vol) |
52 Wk Hi
% From Hi |
Featured
Date |
Price
Featured |
Pivot Featured |
|
Max Buy |
SHOP
-
NYSE
Shopify Inc Cl A
Computer Sftwr-Enterprse
|
$1,087.31
|
-31.43
-2.81% |
$1,109.00
|
1,253,362
81.28% of 50 DAV
50 DAV is 1,542,000
|
$1,285.19
-15.40%
|
12/16/2020
|
$1,146.00
|
PP = $1,147.01
|
|
MB = $1,204.36
|
Most Recent Note - 1/4/2021 6:22:19 PM
Y - Suffered a big loss today with higher (near average) volume, slumping below prior highs in the $1,146-1,130 area and falling back into the prior base raising concerns. Its 50 DMA line ($1,045) defines the next important support to watch. Reported Sep '20 quarterly earnings of $1.13 per share versus a loss of 29 cents per share on +96% sales revenues versus the year ago period. The Ontario, Canada-based Computer Software - Enterprise firm's prior quarters showed big earnings and sales revenues growth. After years of losses it had strong earnings growth in FY '17-19 (A criteria).
>>> FEATURED STOCK ARTICLE : Volume-Driven Gain for New High After Long Consolidation - 12/16/2020 |
View all notes |
Set NEW NOTE alert |
Company Profile |
SEC
News |
Chart |
Request a new note
C
A
S
I |
YETI
-
NYSE
Yeti Holdings Inc
Leisure-Products
|
$71.29
|
+1.67
2.40% |
$72.92
|
1,012,115
83.51% of 50 DAV
50 DAV is 1,212,000
|
$74.82
-4.72%
|
11/5/2020
|
$57.25
|
PP = $55.14
|
|
MB = $57.90
|
Most Recent Note - 1/6/2021 6:11:36 PM
G - Posted a 4th consecutive gain today with below average volume. Consolidating after quietly wedging to new all-time highs with recent gains lacking great volume conviction. Its 50 DMA line ($62.84) defines initial support to watch.
>>> FEATURED STOCK ARTICLE : Pulling Back After Recently Wedging to New Highs - 12/29/2020 |
View all notes |
Set NEW NOTE alert |
Company Profile |
SEC
News |
Chart |
Request a new note
C
A
S
I |
AAXN
-
NASDAQ
Axon Enterprise Inc
Security/Sfty
|
$121.69
|
-0.61
-0.50% |
$123.07
|
690,110
129.96% of 50 DAV
50 DAV is 531,000
|
$134.73
-9.68%
|
12/22/2020
|
$127.84
|
PP = $130.51
|
|
MB = $137.04
|
Most Recent Note - 1/5/2021 5:25:41 PM
Y - Color code is changed to yellow after today's big gain and prompt rebound above its 50 DMA line helped its outlook to improve. A subsequent gain and new high close above the pivot point backed by at least +40% above average volume is needed to reconfirm a new (or add-on) technical buy signal. Fundamentals remain strong.
>>> FEATURED STOCK ARTICLE : New All-Time High With Today's 5th Consecutive Gain - 12/23/2020 |
View all notes |
Set NEW NOTE alert |
Company Profile |
SEC
News |
Chart |
Request a new note
C
A
S
I |
QTWO
-
NYSE
Q2 Holdings Inc
Computer Sftwr-Financial
|
$120.89
|
-3.41
-2.74% |
$123.63
|
512,548
117.83% of 50 DAV
50 DAV is 435,000
|
$130.59
-7.43%
|
11/12/2020
|
$105.14
|
PP = $106.54
|
|
MB = $111.87
|
Most Recent Note - 1/4/2021 6:19:18 PM
G - Pulled back with below average volume today, still hovering near its all-time high. Its 50 DMA line ($111.45) defines important near term support to watch above the prior high in the $106 area.
>>> FEATURED STOCK ARTICLE : Stubbornly Holding Ground Extended From Prior Base - 12/31/2020 |
View all notes |
Set NEW NOTE alert |
Company Profile |
SEC
News |
Chart |
Request a new note
C
A
S
I |
|
|
|
THESE ARE NOT BUY RECOMMENDATIONS!
Comments contained in the body of this report are technical
opinions only. The material herein has been obtained
from sources believed to be reliable and accurate, however,
its accuracy and completeness cannot be guaranteed.
This site is not an investment advisor, hence it does
not endorse or recommend any securities or other investments.
Any recommendation contained in this report may not
be suitable for all investors and it is not to be deemed
an offer or solicitation on our part with respect to
the purchase or sale of any securities. All trademarks,
service marks and trade names appearing in this report
are the property of their respective owners, and are
likewise used for identification purposes only.
This report is a service available
only to active Paid Premium Members.
You may opt-out of receiving report notifications
at any time. Questions or comments may be submitted
by writing to Premium Membership Services 665 S.E. 10 Street, Suite 201 Deerfield Beach, FL 33441-5634 or by calling 1-800-965-8307
or 954-785-1121.
|
|
|