You are not logged in.
This means you
CAN ONLY VIEW reports that were published prior to Thursday, March 20, 2025.
You
MUST UPGRADE YOUR MEMBERSHIP if you want to see any current reports.
AFTER MARKET UPDATE - THURSDAY, JANUARY 21ST, 2021
Previous After Market Report Next After Market Report >>>
|
|
|
|
DOW |
-12.37 |
31,176.01 |
-0.04% |
|
Volume |
890,178,516 |
-10% |
|
Volume |
7,138,255,100 |
+6% |
|
NASDAQ |
+73.67 |
13,530.91 |
+0.55% |
|
Advancers |
1,223 |
39% |
|
Advancers |
1,680 |
44% |
|
S&P 500 |
+0.72 |
3,852.57 |
+0.02% |
|
Decliners |
1,908 |
61% |
|
Decliners |
2,128 |
56% |
|
Russell 2000 |
-19.20 |
2,141.42 |
-0.89% |
|
52 Wk Highs |
212 |
|
|
52 Wk Highs |
350 |
|
|
S&P 600 |
-13.59 |
1,216.23 |
-1.11% |
|
52 Wk Lows |
1 |
|
|
52 Wk Lows |
7 |
|
|
 |
Growth Stocks Extend Their Outperformance
Kenneth J. Gruneisen - Passed the CAN SLIM® Master's Exam
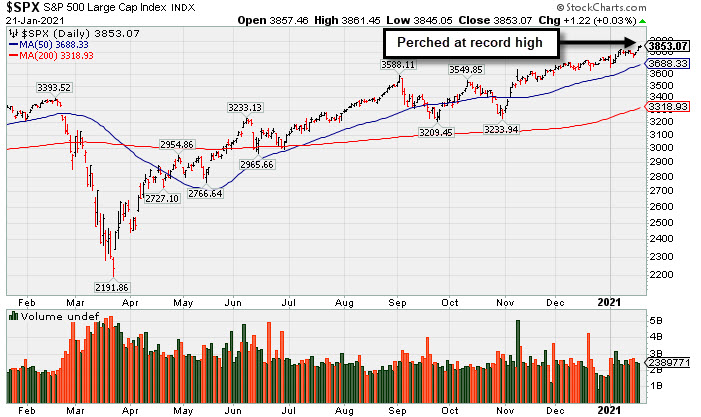
After toggling between small gains and losses, the Dow fell 12 points, while the S&P 500 was little changed. The tech-heavy Nasdaq Composite advanced 0.6%, as growth-oriented stocks extended their outperformance. The volume totals were mixed, lighter than the prior session on the NYSE and higher on the Nasdaq exchange. Breadth was negative as decliners led advancers by a 3-2 margin on the NYSE and 5-4 on the Nasdaq exchange. There were 66 high-ranked companies from the Leaders List that hit new 52-week highs and were listed on the BreakOuts Page, down from the total of 109 on the prior session. New 52-week highs totals contracted yet still easily outnumbered the new 52-week lows totals which were in the single digits on both exchanges. The major indices are in a confirmed uptrend (M criteria). Investors are reminded to always make buying and selling decisions based based on the strict criteria and rules of the fact-based investment system. PICTURED: The S&P 500 Index is perched at a record high.
All U.S. equities ended mixed on Thursday, a day after all three U.S. major averages closed at fresh record highs. Investors parsed the latest corporate earnings reports and economic data releases as well as monitored new policies from the Biden administration. The president unveiled a series of executive orders that outlined a new national strategy to combat the coronavirus pandemic.
Eight of 11 S&P 500 sectors finished in negative territory. The Energy group lagged with a more than 3% decline as WTI crude slipped 0.3% to $53.02/barrel. Consumer Discretionary, Information Technology, and Communication Services all bucked the downtrend, with the oft-cited FAANG group rising 1.2%. In earnings, United Airlines (UAL -5.73%) fell after reporting a wider-than-anticipated quarterly loss and missing revenue estimates. Union Pacific (UNP -4.71%) fell despite the railroad operator topping Wall Street’s earnings expectations. In other corporate news, homebuilders KB Home (KBH +1.68%) and DR Horton (DHI +1.94%) both rallied following an update that showed housing starts grew at 5.8% in December, the fastest pace since 2006.
Elsewhere on the economic data front, initial jobless claims fell to 900,000 in the week ending January 16. The figure came in below consensus expectations of 935,000 and the downwardly revised 926,000 reading from the prior period. A separate update showed building permits unexpectedly climbed 4.5% in the final month of 2020. Treasuries weakened, with the yield on the benchmark 10-year note adding two basis points to 1.10%. |
 Kenneth J. Gruneisen started out as a licensed stockbroker in August 1987, a couple of months prior to the historic stock market crash that took the Dow Jones Industrial Average down -22.6% in a single day. He has published daily fact-based fundamental and technical analysis on high-ranked stocks online for two decades. Through FACTBASEDINVESTING.COM, Kenneth provides educational articles, news, market commentary, and other information regarding proven investment systems that work in good times and bad.
Comments contained in the body of this report are technical opinions only and are not necessarily those of Gruneisen Growth Corp. The material herein has been obtained from sources believed to be reliable and accurate, however, its accuracy and completeness cannot be guaranteed. Our firm, employees, and customers may effect transactions, including transactions contrary to any recommendation herein, or have positions in the securities mentioned herein or options with respect thereto. Any recommendation contained in this report may not be suitable for all investors and it is not to be deemed an offer or solicitation on our part with respect to the purchase or sale of any securities. |
|
 |
Retail and Semiconductor Indexes Led Group Gainers
Kenneth J. Gruneisen - Passed the CAN SLIM® Master's Exam
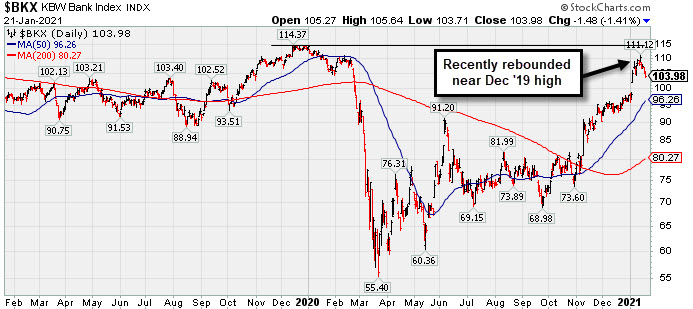
The Retail Index ($RLX +0.98%) had a positive influence on the major indices but the Bank Index ($BKX -1.41%) and Broker/Dealer Index ($XBD -0.55%) both created a drag. The Semiconductor Index ($SOX +1.53%) led the tech sector while the Networking Index ($NWX +0.05%) finished flat and the Biotech Index ($BTK -0.92%) lost ground. The Oil Services Index ($OSX -4.56%) and Integrated Oil Index ($XOI -2.95%) suffered standout losses. The Gold & Silver Index ($XAU -1.40%) also slumped.
PICTURED: The Bank Index ($BKX -1.41%) recently rebounded near its December 2019 high.
| Oil Services |
$OSX |
49.09 |
-2.35 |
-4.56% |
+10.74% |
| Integrated Oil |
$XOI |
877.95 |
-26.67 |
-2.95% |
+10.79% |
| Semiconductor |
$SOX |
3,132.17 |
+47.14 |
+1.53% |
+12.04% |
| Networking |
$NWX |
753.38 |
+0.41 |
+0.05% |
+5.06% |
| Broker/Dealer |
$XBD |
396.28 |
-2.19 |
-0.55% |
+4.95% |
| Retail |
$RLX |
3,664.70 |
+35.71 |
+0.98% |
+2.85% |
| Gold & Silver |
$XAU |
141.24 |
-2.00 |
-1.40% |
-2.05% |
| Bank |
$BKX |
103.98 |
-1.48 |
-1.41% |
+6.20% |
| Biotech |
$BTK |
6,086.56 |
-56.30 |
-0.92% |
+6.06% |
|
|
|
 |
Relative Strength Rating Suffered During Stalling Action
Kenneth J. Gruneisen - Passed the CAN SLIM® Master's Exam
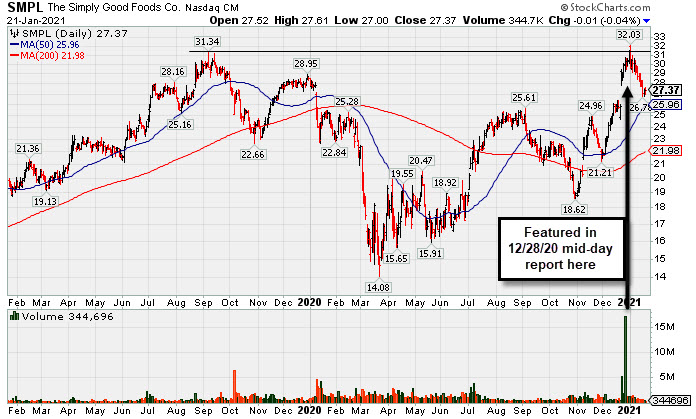
Simply Good Foods Co (SMPL -$0.02 or -0.07% to $27.36) has suffered many small losses on lighter than average volume in recent weeks. Its Relative Strength Rating has slumped to 57, well below the 80+ minimum guideline for buy candidates.
SMPL was highlighted in yellow with pivot point cited based on its 9/09/19 high plus 10 cents in the 12/28/20 mid-day report (read here). At the time it posted a 5th consecutive gain backed by about 15 times average volume, and an annotated graph included under the headline, "Challenging All-Time High as it Joins Small Cap Index", Although it was added to the S&P 600 Small Cap Index, it only wedged higher with subsequent gains lacking great volume conviction and stalled thereafter.
Fundamentals remain strong. It report Nov '20 quarterly earnings +32% on +52% sales revenues versus the year ago period, its 4th consecutive quarterly comparison above the +25% minimum earnings guideline (C criteria). Its annual earnings history (A criteria) has been strong.
SMPL completed a new Pubic Offering on 10/09/19. The company has a Timeliness Rating of B and Sponsorship Rating of C. The number of top-rated funds owning its shares fell from 442 in Dec '19 to 343 in Dec '20, however, its current Up/Down Volume Ratio of 2.5 is an unbiased indication its shares have been under accumulation over the past 50 days.
Some leadership has been provided by other companies in the Food/Beverage Sector, however, the Food-Confectionery industry group has a Group Relative Strength Rating of 3 (E) which is a concern regarding the L criteria. There are only 5 companies listed in the group.
|
|
|
Color Codes Explained :
Y - Better candidates highlighted by our
staff of experts.
G - Previously featured
in past reports as yellow but may no longer be buyable under the
guidelines.
***Last / Change / Volume data in this table is the closing quote data***
Symbol/Exchange
Company Name
Industry Group |
PRICE |
CHANGE
(%Change) |
Day High |
Volume
(% DAV)
(% 50 day avg vol) |
52 Wk Hi
% From Hi |
Featured
Date |
Price
Featured |
Pivot Featured |
|
Max Buy |
 CRL
-
NYSE
CRL
-
NYSE
Charles River Labs Intl
DRUGS - Biotechnology
|
$281.24
|
-1.70
-0.60% |
$284.60
|
274,901
95.78% of 50 DAV
50 DAV is 287,000
|
$283.60
-0.83%
|
12/17/2020
|
$247.06
|
PP = $257.98
|
|
MB = $270.88
|
 Most Recent Note - 1/21/2021 4:03:16 PM
G - Perched above its "max buy" level at its all-time high and its color code is changed to green. Its prior high ($257) defines initial support above its 50 DMA line ($247). Reported Sep '20 quarterly earnings +38% on +11% sales revenues versus the year ago period, above the +25% minimum earnings guideline (C criteria).
>>> FEATURED STOCK ARTICLE : Hovering in Tight Range Holding Ground Near High - 1/5/2021 |
View all notes |
Set NEW NOTE alert |
Company Profile |
SEC
News |
Chart |
Request a new note
C
A
S
I |
AMD
-
NYSE
Advanced Micro Devices
ELECTRONICS - Semiconductor - Broad Line
|
$91.53
|
+2.78
3.13% |
$92.07
|
52,278,069
122.34% of 50 DAV
50 DAV is 42,733,100
|
$99.23
-7.76%
|
11/18/2020
|
$82.54
|
PP = $88.72
|
|
MB = $93.16
|
Most Recent Note - 1/21/2021 3:59:39 PM
Y - Color code is changed to yellow with today's rebound above the 50 DMA line ($90.22) helping its outlook improve, however, its Relative Strength rating of 71 is below the 80+ minimum guideline for buy candidates.
>>> FEATURED STOCK ARTICLE : Distributional Pressure Brings Pullback Below "Max Buy" Level - 1/13/2021 |
View all notes |
Set NEW NOTE alert |
Company Profile |
SEC
News |
Chart |
Request a new note
C
A
S
I |
TER
-
NASDAQ
Teradyne Inc
ELECTRONICS - Semiconductor Equipment and Mate
|
$140.24
|
+1.63
1.18% |
$141.41
|
1,301,581
90.01% of 50 DAV
50 DAV is 1,446,000
|
$143.40
-2.20%
|
10/21/2020
|
$92.22
|
PP = $93.54
|
|
MB = $98.22
|
Most Recent Note - 1/19/2021 5:11:36 PM
G - Hit yet another new all-time high with today's gain backed by above average volume, getting very extended from any sound base. Support to watch on pullbacks is its 50 DMA line ($116.32).
>>> FEATURED STOCK ARTICLE : Perched Near Record High Very Extended From Any Sound Base - 12/30/2020 |
View all notes |
Set NEW NOTE alert |
Company Profile |
SEC
News |
Chart |
Request a new note
C
A
S
I |
AMRC
-
NYSE
Ameresco Inc Cl A
ENERGY - Alternative
|
$59.21
|
+0.77
1.32% |
$59.65
|
279,426
67.33% of 50 DAV
50 DAV is 415,000
|
$63.45
-6.68%
|
12/15/2020
|
$46.72
|
PP = $47.10
|
|
MB = $49.46
|
Most Recent Note - 1/19/2021 12:08:16 PM
G - Very extended from any sound base. Its 50 DMA line ($48.26) and prior highs in the $46-47 area define important near-term support to watch on pullbacks.
>>> FEATURED STOCK ARTICLE : Very Extended From Base After Another Powerful Gain - 1/6/2021 |
View all notes |
Set NEW NOTE alert |
Company Profile |
SEC
News |
Chart |
Request a new note
C
A
S
I |
TREX
-
NYSE
Trex Company Inc
MATERIALS and CONSTRUCTION - General Building Materials
|
$95.19
|
+0.01
0.01% |
$97.19
|
673,711
92.67% of 50 DAV
50 DAV is 727,000
|
$95.23
-0.04%
|
6/26/2020
|
$54.53
|
PP = $66.47
|
|
MB = $69.79
|
Most Recent Note - 1/19/2021 5:06:01 PM
G - Posted a big gain today with average volume for a new all-time high. Prior highs in the $80-81 area define initial support to watch above its 50 DMA line ($80). Recently noted that it reported Sep '20 quarterly earnings +14% on +19% sales revenues versus the year ago period, below the +25% minimum guideline (C criteria) raising fundamental concerns. See the latest FSU analysis for more details and a new annotated graph.
>>> FEATURED STOCK ARTICLE : Hit New All-Time High With Gain Backed by Average Volume - 1/19/2021 |
View all notes |
Set NEW NOTE alert |
Company Profile |
SEC
News |
Chart |
Request a new note
C
A
S
I |
Symbol/Exchange
Company Name
Industry Group |
PRICE |
CHANGE
(%Change) |
Day High |
Volume
(% DAV)
(% 50 day avg vol) |
52 Wk Hi
% From Hi |
Featured
Date |
Price
Featured |
Pivot Featured |
|
Max Buy |
CLFD
-
NASDAQ
Clearfield Inc
TELECOMMUNICATIONS - Cables / Satalite Equipment
|
$32.30
|
+0.67
2.12% |
$32.81
|
182,977
181.17% of 50 DAV
50 DAV is 101,000
|
$34.65
-6.78%
|
1/20/2021
|
$31.38
|
PP = $28.42
|
|
MB = $29.84
|
Most Recent Note - 1/21/2021 12:23:05 PM
G - Color code is changed to green while trading higher today. There was a big "breakaway gap" noted on the prior session backed by heavy volume. Prior highs in the $28 area define initial support to watch on pullbacks. Found prompt support at its 50 DMA line ($25.11) and upward trendline when consolidating.
>>> FEATURED STOCK ARTICLE : Distributional Pressure While Testing Important Chart Support - 1/4/2021 |
View all notes |
Set NEW NOTE alert |
Company Profile |
SEC
News |
Chart |
Request a new note
C
A
S
I |
NOW
-
NYSE
Servicenow Inc
Computer Sftwr-Enterprse
|
$544.33
|
+2.14
0.39% |
$546.40
|
1,006,511
77.23% of 50 DAV
50 DAV is 1,303,300
|
$566.74
-3.95%
|
8/20/2020
|
$453.34
|
PP = $454.79
|
|
MB = $477.53
|
Most Recent Note - 1/19/2021 5:17:43 PM
G - Today's big gain with lighter volume helped it rebound toward its 50 DMA line ($527). Subsequent gains above that important short term average are needed for its outlook to improve. Due to report Dec '20 quarterly results on 1/27/21. Fundamental concerns were raised when it reported Sep '20 quarterly earnings +22% on +30% sales revenues versus the year ago period, below the +25% minimum guideline (C criteria) of the fact-based investment system.
>>> FEATURED STOCK ARTICLE : Gain Today and Rebound Above 50-Day Moving Average Line - 1/8/2021 |
View all notes |
Set NEW NOTE alert |
Company Profile |
SEC
News |
Chart |
Request a new note
C
A
S
I |
SMPL
-
NASDAQ
Simply Good Foods Co
Food-Confectionery
|
$27.36
|
-0.02
-0.07% |
$27.61
|
442,324
33.11% of 50 DAV
50 DAV is 1,335,800
|
$32.03
-14.58%
|
12/28/2020
|
$30.40
|
PP = $31.44
|
|
MB = $33.01
|
Most Recent Note - 1/21/2021 5:02:41 PM
G - Color code is changed to green after its Relative Strength Rating has slumped to 59, well below the 80+ minimum guideline. See the latest FSU analysis for more details and a new annotated graph.
>>> FEATURED STOCK ARTICLE : Relative Strength Rating Suffered During Stalling Action - 1/21/2021 |
View all notes |
Set NEW NOTE alert |
Company Profile |
SEC
News |
Chart |
Request a new note
C
A
S
I |
ALRM
-
NASDAQ
Alarm.com Holdings Inc
Security/Sfty
|
$95.59
|
-1.21
-1.25% |
$98.45
|
482,458
101.78% of 50 DAV
50 DAV is 474,000
|
$108.67
-12.04%
|
11/6/2020
|
$71.88
|
PP = $74.76
|
|
MB = $78.50
|
Most Recent Note - 1/20/2021 5:27:42 PM
G - It has encountered distributional pressure after a big rally. Its 50 DMA line ($86.05) defines important near-term support to watch. See the latest FSU analysis for more details and a new annotated graph.
>>> FEATURED STOCK ARTICLE : Encountered Distributional Pressure After Big Rally - 1/20/2021 |
View all notes |
Set NEW NOTE alert |
Company Profile |
SEC
News |
Chart |
Request a new note
C
A
S
I |
TEAM
-
NASDAQ
Atlassian Corp Plc
Comp Sftwr-Spec Enterprs
|
$234.18
|
+2.57
1.11% |
$237.56
|
1,191,198
76.21% of 50 DAV
50 DAV is 1,563,100
|
$250.03
-6.34%
|
10/12/2020
|
$193.77
|
PP = $199.60
|
|
MB = $209.58
|
Most Recent Note - 1/19/2021 5:10:36 PM
G - Found support today while consolidating above its 50 DMA line ($222) and above the prior high in the $216 area which defines important near-term support to watch. However, its current Relative Strength Rating is 64, below the +80 minimum guideline for buy candidates. Earnings rose +7% on +26% sales revenues for the Sep '20 quarter versus the year ago period, below the +25% minimum earnings guideline (C criteria), raising fundamental concerns.
>>> FEATURED STOCK ARTICLE : Relative Strength Rating Remains Below 80+ Minimum Guideline - 1/11/2021 |
View all notes |
Set NEW NOTE alert |
Company Profile |
SEC
News |
Chart |
Request a new note
C
A
S
I |
Symbol/Exchange
Company Name
Industry Group |
PRICE |
CHANGE
(%Change) |
Day High |
Volume
(% DAV)
(% 50 day avg vol) |
52 Wk Hi
% From Hi |
Featured
Date |
Price
Featured |
Pivot Featured |
|
Max Buy |
SHOP
-
NYSE
Shopify Inc Cl A
Computer Sftwr-Enterprse
|
$1,198.15
|
-2.83
-0.24% |
$1,216.25
|
698,226
49.84% of 50 DAV
50 DAV is 1,401,000
|
$1,285.19
-6.77%
|
12/16/2020
|
$1,146.00
|
PP = $1,147.01
|
|
MB = $1,204.36
|
Most Recent Note - 1/19/2021 5:07:19 PM
Y - Volume totals have still been cooling while consolidating perched near its all-time high. Found prompt support near prior highs in the $1,146-1,130 area and above its 50 DMA line ($1,079) which defines the next important support to watch.
>>> FEATURED STOCK ARTICLE : Rebounded After Undercutting Prior Highs - 1/7/2021 |
View all notes |
Set NEW NOTE alert |
Company Profile |
SEC
News |
Chart |
Request a new note
C
A
S
I |
YETI
-
NYSE
Yeti Holdings Inc
Leisure-Products
|
$71.65
|
+0.30
0.42% |
$72.79
|
1,005,522
66.59% of 50 DAV
50 DAV is 1,510,000
|
$80.89
-11.42%
|
11/5/2020
|
$57.25
|
PP = $55.14
|
|
MB = $57.90
|
Most Recent Note - 1/19/2021 12:54:42 PM
G - The prior low ($67) and 50 DMA line ($66.66) define important near-term support to watch. Gapped down for a 2nd consecutive session today following a "negative reversal" last week at its all-time high. Repeatedly noted as "extended from any sound base".
>>> FEATURED STOCK ARTICLE : Pulling Back After Recently Wedging to New Highs - 12/29/2020 |
View all notes |
Set NEW NOTE alert |
Company Profile |
SEC
News |
Chart |
Request a new note
C
A
S
I |
DOCU
-
NASDAQ
Docusign Inc
Computer Sftwr-Enterprse
|
$253.94
|
-1.37
-0.54% |
$257.68
|
1,476,291
38.27% of 50 DAV
50 DAV is 3,858,000
|
$290.23
-12.50%
|
1/12/2021
|
$253.50
|
PP = $256.10
|
|
MB = $268.91
|
Most Recent Note - 1/19/2021 5:13:43 PM
Y - Posted a gain today with higher (but still below average) volume. Finished strong on 1/12/21 after highlighted in yellow with pivot point cited based on its 12/04/20 high plus 10 cents. The big gain and strong close above the pivot point backed by twice average volume clinched a technical buy signal. Recently found support near its 50 DMA line ($230). Fundamentals remain strong.
>>> FEATURED STOCK ARTICLE : Twice Average Volume Behind Breakout Gain - 1/12/2021 |
View all notes |
Set NEW NOTE alert |
Company Profile |
SEC
News |
Chart |
Request a new note
C
A
S
I |
AAXN
-
NASDAQ
Axon Enterprise Inc
Security/Sfty
|
$162.54
|
-2.02
-1.23% |
$168.40
|
839,730
133.29% of 50 DAV
50 DAV is 630,000
|
$168.48
-3.53%
|
12/22/2020
|
$127.84
|
PP = $130.51
|
|
MB = $137.04
|
Most Recent Note - 1/21/2021 12:04:00 PM
G - Very extended from any sound base, perched at its all-time high and on track today for a 7th consecutive volume-driven gain. Prior high ($134) defines initial support to watch. Found prompt support near its 50 DMA line ($128) during the recent consolidation. Fundamentals remain strong.
>>> FEATURED STOCK ARTICLE : Hit New Highs With Streak of Big Volume-Driven Gains - 1/15/2021 |
View all notes |
Set NEW NOTE alert |
Company Profile |
SEC
News |
Chart |
Request a new note
C
A
S
I |
QTWO
-
NYSE
Q2 Holdings Inc
Computer Sftwr-Financial
|
$136.56
|
+1.37
1.01% |
$136.91
|
460,045
97.88% of 50 DAV
50 DAV is 470,000
|
$135.32
0.92%
|
11/12/2020
|
$105.14
|
PP = $106.54
|
|
MB = $111.87
|
Most Recent Note - 1/19/2021 5:19:05 PM
G - Posted a gain today on average volume for a new all-time high. Its 50 DMA line ($118) defines important near term support to watch on pullbacks.
>>> FEATURED STOCK ARTICLE : Stubbornly Holding Ground Extended From Prior Base - 12/31/2020 |
View all notes |
Set NEW NOTE alert |
Company Profile |
SEC
News |
Chart |
Request a new note
C
A
S
I |
Symbol/Exchange
Company Name
Industry Group |
PRICE |
CHANGE
(%Change) |
Day High |
Volume
(% DAV)
(% 50 day avg vol) |
52 Wk Hi
% From Hi |
Featured
Date |
Price
Featured |
Pivot Featured |
|
Max Buy |
|
|
|
THESE ARE NOT BUY RECOMMENDATIONS!
Comments contained in the body of this report are technical
opinions only. The material herein has been obtained
from sources believed to be reliable and accurate, however,
its accuracy and completeness cannot be guaranteed.
This site is not an investment advisor, hence it does
not endorse or recommend any securities or other investments.
Any recommendation contained in this report may not
be suitable for all investors and it is not to be deemed
an offer or solicitation on our part with respect to
the purchase or sale of any securities. All trademarks,
service marks and trade names appearing in this report
are the property of their respective owners, and are
likewise used for identification purposes only.
This report is a service available
only to active Paid Premium Members.
You may opt-out of receiving report notifications
at any time. Questions or comments may be submitted
by writing to Premium Membership Services 665 S.E. 10 Street, Suite 201 Deerfield Beach, FL 33441-5634 or by calling 1-800-965-8307
or 954-785-1121.
|
|
|