You are not logged in.
This means you
CAN ONLY VIEW reports that were published prior to Thursday, March 20, 2025.
You
MUST UPGRADE YOUR MEMBERSHIP if you want to see any current reports.
AFTER MARKET UPDATE - MONDAY, FEBRUARY 1ST, 2021
Previous After Market Report Next After Market Report >>>
|
|
|
|
DOW |
+229.29 |
30,211.91 |
+0.76% |
|
Volume |
1,046,120,990 |
-33% |
|
Volume |
6,983,571,800 |
-10% |
|
NASDAQ |
+332.70 |
13,403.39 |
+2.55% |
|
Advancers |
2,491 |
78% |
|
Advancers |
2,913 |
76% |
|
S&P 500 |
+59.62 |
3,773.86 |
+1.61% |
|
Decliners |
705 |
22% |
|
Decliners |
906 |
24% |
|
Russell 2000 |
+52.52 |
2,126.16 |
+2.53% |
|
52 Wk Highs |
89 |
|
|
52 Wk Highs |
132 |
|
|
S&P 600 |
+21.54 |
1,210.25 |
+1.81% |
|
52 Wk Lows |
2 |
|
|
52 Wk Lows |
16 |
|
|
 |
Breadth Positive While Major Indices Rose With Lighter Volume Totals
Kenneth J. Gruneisen - Passed the CAN SLIM® Master's Exam
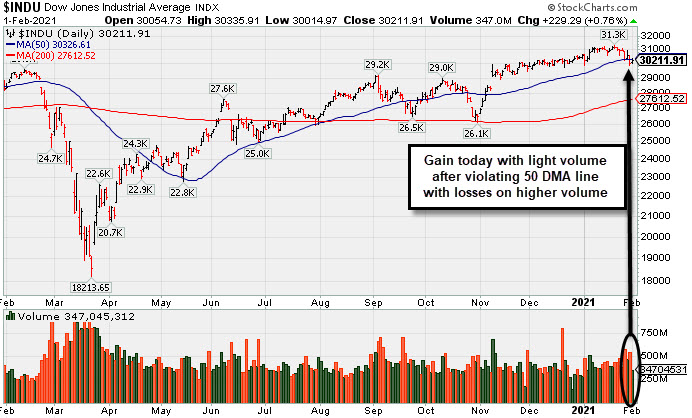
The Dow rose 229 points, while the S&P 500 advanced 1.6%. The Nasdaq Composite is jumped 2.6%. The volume totals were lighter than the prior session on the NYSE and on the Nasdaq exchange. Advancers led decliners by more than a 3-1 margin on the NYSE and on the Nasdaq exchange. There were 31 high-ranked companies from the Leaders List that hit new 52-week highs and were listed on the BreakOuts Page, up versus the total of 16 on the prior session, but down from 96 on last Monday. New 52-week highs totals expanded and easily outnumbered the new 52-week lows totals. The major indices clearly saw their uptrend come under pressure (M criteria) last week while leadership thinned. Investors are reminded to always make buying and selling decisions based based on the strict criteria and rules of the fact-based investment system. PICTURED: The Dow Jones Industrial Average posted a gain with lighter volume. It violated its 50-day moving average (DMA) line with higher volume behind losses last week raising concerns. A rebound above the 50 DMA line is needed for its outlook to improve.
Equities finished higher on Monday as a broad rally in tech stocks helped U.S. benchmarks rebound from their worst weekly performance since October. The commodity complex was also in focus, with silver surging 8.4% to a seven year high of $29.19/ounce as the precious metal became the latest focus for retail traders.
All 11 S&P 500 sectors finished the session in positive territory. Growth-oriented stocks paced the gains, with the Information Technology and Consumer Discretionary Services sectors each climbing more than 2%. Earnings results will remain in focus this week, with more than 100 S&P 500 companies slated to report profit tallies. Among companies reporting Monday, Thermo Fisher Scientific (TMO +1.13%) rose after beating Wall Street earnings and revenue expectations. Meanwhile, Google-parent Alphabet (GOOGL +3.60%) and Amazon (AMZN +4.26%) each advanced more than 3.5% ahead of their quarterly reports on Tuesday.
On the data front, the Institute for Supply Management’s gauge of U.S. manufacturing activity slipped to 58.7 in January, below expectations of 60.0 and the robust 60.5 reading the prior month. The report also revealed that prices paid by factories for raw materials jumped to the highest level in nearly 10 years, potentially signaling a rise in inflation expectations. Treasuries were little changed along the curve, with the yield on the benchmark 10-year note holding steady at 1.07% |
 Kenneth J. Gruneisen started out as a licensed stockbroker in August 1987, a couple of months prior to the historic stock market crash that took the Dow Jones Industrial Average down -22.6% in a single day. He has published daily fact-based fundamental and technical analysis on high-ranked stocks online for two decades. Through FACTBASEDINVESTING.COM, Kenneth provides educational articles, news, market commentary, and other information regarding proven investment systems that work in good times and bad.
Comments contained in the body of this report are technical opinions only and are not necessarily those of Gruneisen Growth Corp. The material herein has been obtained from sources believed to be reliable and accurate, however, its accuracy and completeness cannot be guaranteed. Our firm, employees, and customers may effect transactions, including transactions contrary to any recommendation herein, or have positions in the securities mentioned herein or options with respect thereto. Any recommendation contained in this report may not be suitable for all investors and it is not to be deemed an offer or solicitation on our part with respect to the purchase or sale of any securities. |
|
 |
Retail, Financial, Tech and Commodity-Linked Groups Rose
Kenneth J. Gruneisen - Passed the CAN SLIM® Master's Exam
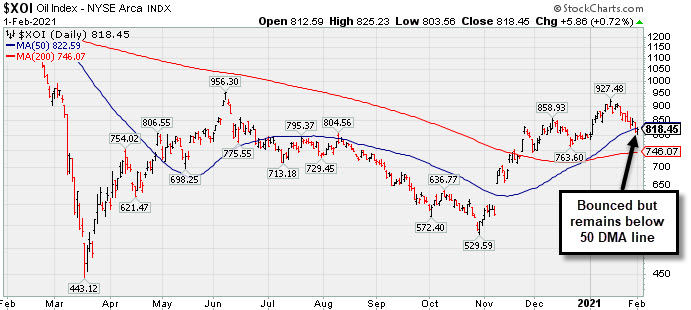
The Broker/Dealer Index ($XBD +3.48%) and Bank Index ($BKX +1.01%) posted influential gains along with the Retail Index ($RLX +2.58%). The Semiconductor Index ($SOX +3.91%) and Networking Index ($NWX +3.28%) led the tech sector higher while the Biotech Index ($BTK +1.39%) posted a smaller gain. The Gold & Silver Index ($XAU +5.58%) posted a standout gain while the Oil Services Index ($OSX +1.05%) and Integrated Oil Index ($XOI +0.72%) each posted a smaller gain.
PICTURED: The Integrated Oil Index ($XOI +0.72%) bounced but remains below its 50-day moving average (DMA) line after last week's pullback.
| Oil Services |
$OSX |
47.27 |
+0.49 |
+1.05% |
+6.62% |
| Integrated Oil |
$XOI |
818.45 |
+5.86 |
+0.72% |
+3.28% |
| Semiconductor |
$SOX |
2,999.99 |
+112.91 |
+3.91% |
+7.31% |
| Networking |
$NWX |
783.19 |
+24.90 |
+3.28% |
+9.21% |
| Broker/Dealer |
$XBD |
390.89 |
+13.16 |
+3.48% |
+3.52% |
| Retail |
$RLX |
3,612.24 |
+90.93 |
+2.58% |
+1.37% |
| Gold & Silver |
$XAU |
146.32 |
+7.73 |
+5.58% |
+1.48% |
| Bank |
$BKX |
98.77 |
+0.99 |
+1.01% |
+0.87% |
| Biotech |
$BTK |
6,067.63 |
+83.01 |
+1.39% |
+5.73% |
|
|
|
 |
Rebounding After Retreat From Record High
Kenneth J. Gruneisen - Passed the CAN SLIM® Master's Exam
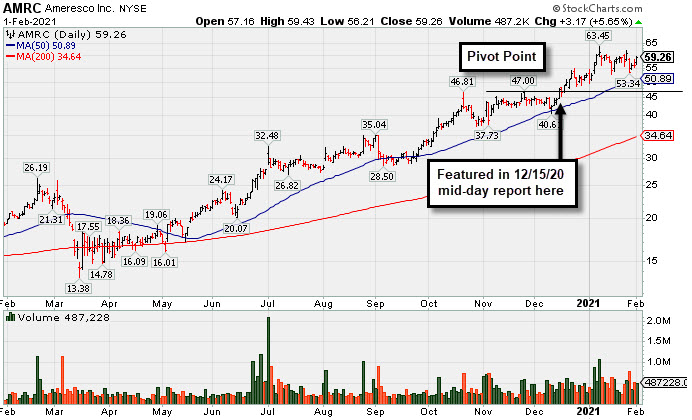
Ameresco Inc Cl A (AMRC +$3.17 or +5.65% to $59.26) bounced back impressively today after large volume-driven losses last week while retreating from its all-time high. It remains very extended from any sound base. Its 50-day moving average (DMA) line ($50.89) defines near-term support to watch above prior highs in the $46-47 area.
AMRC has traded up as much as +35.8% since it was highlighted in yellow with pivot point cited based on its 11/24/20 high plus 10 cents in the 12/15/20 mid-day report (read here). It was last covered in detail in the 1/06/21 report with an annotated graph under the headline, "Very Extended From Base After Another Powerful Gain".
AMRC reported earnings +111% on +33% sales revenues for the Sep '20 quarter versus the year ago period. Three of the 4 latest quarterly comparisons were above the +25% minimum earnings guideline (C criteria) with solid sales revenues growth. Its annual earnings (A criteria) history has been good and it has a 93 Earnings Per Share Rating, well above the 80+ minimum for buy candidates.
The ENERGY - Alternative group currently has 98 Group Relative Strength Rating (L criteria). It has only 21.2 million shares in the public float (S criteria) which can contribute to great price volatility in the event of institutional buying or selling. The number of top-rated funds owning its shares rose from 199 in Dec '19 to 293 in Dec '20, a reassuring sign concerning the I criteria. Its current Up/Down Volume Ratio of 1.6 is an unbiased indication its shares have been under accumulation over the past 50 days. |
|
|
Color Codes Explained :
Y - Better candidates highlighted by our
staff of experts.
G - Previously featured
in past reports as yellow but may no longer be buyable under the
guidelines.
***Last / Change / Volume data in this table is the closing quote data***
Symbol/Exchange
Company Name
Industry Group |
PRICE |
CHANGE
(%Change) |
Day High |
Volume
(% DAV)
(% 50 day avg vol) |
52 Wk Hi
% From Hi |
Featured
Date |
Price
Featured |
Pivot Featured |
|
Max Buy |
 CRL
-
NYSE
CRL
-
NYSE
Charles River Labs Intl
DRUGS - Biotechnology
|
$266.00
|
+6.95
2.68% |
$267.62
|
510,649
184.95% of 50 DAV
50 DAV is 276,100
|
$284.60
-6.54%
|
12/17/2020
|
$247.06
|
PP = $257.98
|
|
MB = $270.88
|
 Most Recent Note - 2/1/2021 12:39:35 PM
Y - Losses last week tested important support at the prior high ($257) and its 50 DMA line ($251). Reported Sep '20 quarterly earnings +38% on +11% sales revenues versus the year ago period, above the +25% minimum earnings guideline (C criteria).
>>> FEATURED STOCK ARTICLE : Testing Important Support on Pullback - 1/29/2021 |
View all notes |
Set NEW NOTE alert |
Company Profile |
SEC
News |
Chart |
Request a new note
C
A
S
I |
AMD
-
NYSE
Advanced Micro Devices
ELECTRONICS - Semiconductor - Broad Line
|
$87.66
|
+2.02
2.36% |
$87.95
|
42,253,084
95.01% of 50 DAV
50 DAV is 44,473,100
|
$99.23
-11.66%
|
11/18/2020
|
$82.54
|
PP = $88.72
|
|
MB = $93.16
|
Most Recent Note - 1/27/2021 4:51:15 PM
G - Fundamentals remain strong after it reported Dec '20 quarterly earnings +63% on +53% sales revenues versus the year ago period. Color code is changed to green after today's damaging volume-driven loss violated the 50 DMA line ($91.14) hurting its outlook. Its current Relative Strength rating of 77 is still below the 80+ minimum guideline for buy candidates.
>>> FEATURED STOCK ARTICLE : Distributional Pressure Brings Pullback Below "Max Buy" Level - 1/13/2021 |
View all notes |
Set NEW NOTE alert |
Company Profile |
SEC
News |
Chart |
Request a new note
C
A
S
I |
AMRC
-
NYSE
Ameresco Inc Cl A
ENERGY - Alternative
|
$59.26
|
+3.17
5.65% |
$59.43
|
493,557
113.46% of 50 DAV
50 DAV is 435,000
|
$63.45
-6.60%
|
12/15/2020
|
$46.72
|
PP = $47.10
|
|
MB = $49.46
|
Most Recent Note - 2/1/2021 4:40:46 PM
G - Bounced back impressively today after large volume-driven losses last week while retreating from its all-time high. It remains very extended from any sound base. Its 50-day moving average (DMA) line ($50.89) defines near-term support to watch above prior highs in the $46-47 area. See the latest FSU analysis for more details and a new annotated graph.
>>> FEATURED STOCK ARTICLE : Rebounding After Retreat From Record High - 2/1/2021 |
View all notes |
Set NEW NOTE alert |
Company Profile |
SEC
News |
Chart |
Request a new note
C
A
S
I |
TREX
-
NYSE
Trex Company Inc
MATERIALS and CONSTRUCTION - General Building Materials
|
$95.76
|
+3.99
4.35% |
$96.15
|
730,957
106.40% of 50 DAV
50 DAV is 687,000
|
$104.35
-8.23%
|
6/26/2020
|
$54.53
|
PP = $66.47
|
|
MB = $69.79
|
Most Recent Note - 2/1/2021 4:48:34 PM
G - Rebounded toward its all-time high with today's big gain on average volume after a streak of 4 straight volume-driven losses. Its 50 DMA line ($84.15) and prior highs in the $80-81 area define important support to watch on pullbacks. Sep '20 quarterly earnings were +14% on +19% sales revenues versus the year ago period, below the +25% minimum guideline (C criteria) raising fundamental concerns.
>>> FEATURED STOCK ARTICLE : Hit New All-Time High With Gain Backed by Average Volume - 1/19/2021 |
View all notes |
Set NEW NOTE alert |
Company Profile |
SEC
News |
Chart |
Request a new note
C
A
S
I |
CLFD
-
NASDAQ
Clearfield Inc
TELECOMMUNICATIONS - Cables / Satalite Equipment
|
$33.53
|
+2.21
7.06% |
$33.99
|
255,289
210.98% of 50 DAV
50 DAV is 121,000
|
$37.54
-10.68%
|
1/20/2021
|
$31.38
|
PP = $28.42
|
|
MB = $29.84
|
Most Recent Note - 2/1/2021 12:37:42 PM
G - Extended from any sound base after a streak of volume-driven gains. Prior highs in the $28 area define initial support to watch above its 50 DMA line ($26.52). Reported Dec '20 quarterly earnings +475% on +40% sales revenues versus the year ago period, continuing its strong earning track record.
>>> FEATURED STOCK ARTICLE : Perched Near Record High With Earnings Report Due Soon - 1/27/2021 |
View all notes |
Set NEW NOTE alert |
Company Profile |
SEC
News |
Chart |
Request a new note
C
A
S
I |
Symbol/Exchange
Company Name
Industry Group |
PRICE |
CHANGE
(%Change) |
Day High |
Volume
(% DAV)
(% 50 day avg vol) |
52 Wk Hi
% From Hi |
Featured
Date |
Price
Featured |
Pivot Featured |
|
Max Buy |
NOW
-
NYSE
Servicenow Inc
Computer Sftwr-Enterprse
|
$558.56
|
+15.40
2.84% |
$564.73
|
1,709,645
128.58% of 50 DAV
50 DAV is 1,329,600
|
$566.74
-1.44%
|
8/20/2020
|
$453.34
|
PP = $454.79
|
|
MB = $477.53
|
Most Recent Note - 1/28/2021 12:42:24 PM
G - Gapped up today promptly rebounding above its 50 DMA line ($531) and challenging its prior high. Fundamental concerns remain after it reported Dec '20 quarterly earnings +22% on +31% sales revenues versus the year ago period, its 2nd consecutive comparison below the +25% minimum guideline (C criteria) of the fact-based investment system.
>>> FEATURED STOCK ARTICLE : Gain Today and Rebound Above 50-Day Moving Average Line - 1/8/2021 |
View all notes |
Set NEW NOTE alert |
Company Profile |
SEC
News |
Chart |
Request a new note
C
A
S
I |
SMPL
-
NASDAQ
Simply Good Foods Co
Food-Confectionery
|
$29.09
|
+0.55
1.93% |
$29.44
|
524,853
41.74% of 50 DAV
50 DAV is 1,257,500
|
$32.03
-9.18%
|
12/28/2020
|
$30.40
|
PP = $31.44
|
|
MB = $33.01
|
Most Recent Note - 2/1/2021 4:46:20 PM
G - Posted another gain today with much lighter than average volume. Its Relative Strength Rating is 74, still below the 80+ minimum guideline. Its 50 DMA line ($26.68) and prior low ($26.78) define near term support in the area to watch.
>>> FEATURED STOCK ARTICLE : Relative Strength Rating Suffered During Stalling Action - 1/21/2021 |
View all notes |
Set NEW NOTE alert |
Company Profile |
SEC
News |
Chart |
Request a new note
C
A
S
I |
ALRM
-
NASDAQ
Alarm.com Holdings Inc
Security/Sfty
|
$95.56
|
+2.64
2.84% |
$96.03
|
306,046
65.96% of 50 DAV
50 DAV is 464,000
|
$108.67
-12.06%
|
11/6/2020
|
$71.88
|
PP = $74.76
|
|
MB = $78.50
|
Most Recent Note - 1/29/2021 5:10:29 PM
G - It was down again today with lighter than average volume, slumping near the 50 DMA line ($89.52) which defines important near-term support to watch.
>>> FEATURED STOCK ARTICLE : Encountered Distributional Pressure After Big Rally - 1/20/2021 |
View all notes |
Set NEW NOTE alert |
Company Profile |
SEC
News |
Chart |
Request a new note
C
A
S
I |
TEAM
-
NASDAQ
Atlassian Corp Plc
Comp Sftwr-Spec Enterprs
|
$234.87
|
+3.74
1.62% |
$238.53
|
1,887,172
118.38% of 50 DAV
50 DAV is 1,594,200
|
$250.03
-6.06%
|
10/12/2020
|
$193.77
|
PP = $199.60
|
|
MB = $209.58
|
Most Recent Note - 1/29/2021 12:50:46 PM
G - Sputtering below its 50 DMA line ($228) which acted as resistance after a violation raised concerns. Recent low ($208.62 on 1/27/21) defines important near-term support to watch. Its current Relative Strength Rating is 62, below the +80 minimum guideline for buy candidates. Earnings rose +7% on +26% sales revenues for the Sep '20 quarter versus the year ago period, below the +25% minimum earnings guideline (C criteria), raising fundamental concerns.
>>> FEATURED STOCK ARTICLE : Relative Strength Rating Remains Below 80+ Minimum Guideline - 1/11/2021 |
View all notes |
Set NEW NOTE alert |
Company Profile |
SEC
News |
Chart |
Request a new note
C
A
S
I |
SHOP
-
NYSE
Shopify Inc Cl A
Computer Sftwr-Enterprse
|
$1,144.93
|
+46.34
4.22% |
$1,149.01
|
1,080,589
84.62% of 50 DAV
50 DAV is 1,277,000
|
$1,285.19
-10.91%
|
12/16/2020
|
$1,146.00
|
PP = $1,147.01
|
|
MB = $1,204.36
|
Most Recent Note - 2/1/2021 4:43:56 PM
G - Posted a gain today with light volume. Faces some resistance due to overhead supply up to the $1,285 level. Recently finding support near its 50 DMA line ($1,118). Prior low ($1,076 on 1/06/21) defines the next important support to watch.
>>> FEATURED STOCK ARTICLE : Rebounded After Undercutting Prior Highs - 1/7/2021 |
View all notes |
Set NEW NOTE alert |
Company Profile |
SEC
News |
Chart |
Request a new note
C
A
S
I |
Symbol/Exchange
Company Name
Industry Group |
PRICE |
CHANGE
(%Change) |
Day High |
Volume
(% DAV)
(% 50 day avg vol) |
52 Wk Hi
% From Hi |
Featured
Date |
Price
Featured |
Pivot Featured |
|
Max Buy |
YETI
-
NYSE
Yeti Holdings Inc
Leisure-Products
|
$67.14
|
+1.32
2.01% |
$67.33
|
804,920
59.19% of 50 DAV
50 DAV is 1,360,000
|
$80.89
-17.00%
|
11/5/2020
|
$57.25
|
PP = $55.14
|
|
MB = $57.90
|
Most Recent Note - 1/28/2021 5:33:03 PM
G - Quietly consolidating near its 50 DMA line ($68.54) which has been acting as support. More damaging losses would raise concerns and trigger a technical sell signal.
>>> FEATURED STOCK ARTICLE : 50-Day Moving Average and Prior Lows Define Near-Term Support - 1/22/2021 |
View all notes |
Set NEW NOTE alert |
Company Profile |
SEC
News |
Chart |
Request a new note
C
A
S
I |
BJ
-
NYSE
BJs Wholesale Club Hldgs
Retail-DiscountandVariety
|
$42.48
|
+0.41
0.97% |
$42.90
|
2,802,422
102.72% of 50 DAV
50 DAV is 2,728,100
|
$50.18
-15.34%
|
1/28/2021
|
$44.74
|
PP = $47.56
|
|
MB = $49.94
|
Most Recent Note - 1/29/2021 5:09:05 PM
Y - Suffered a 2nd consecutive loss today with above average volume. Finished weak on the prior session after highlighted in yellow with pivot point cited based on its 8/26/21 high. Abruptly retreated after a volume-driven breakout on the prior session capped a 7 session winning streak. See the latest FSU analysis for more details and an annotated graph.
>>> FEATURED STOCK ARTICLE : Pulled Back After Breakout Capped 7-Day Winning Streak - 1/28/2021 |
View all notes |
Set NEW NOTE alert |
Company Profile |
SEC
News |
Chart |
Request a new note
C
A
S
I |
DOCU
-
NASDAQ
Docusign Inc
Computer Sftwr-Enterprse
|
$230.14
|
-2.75
-1.18% |
$234.47
|
3,220,387
91.02% of 50 DAV
50 DAV is 3,538,000
|
$290.23
-20.70%
|
1/12/2021
|
$253.50
|
PP = $256.10
|
|
MB = $268.91
|
Most Recent Note - 1/27/2021 5:01:40 PM
G - Color code is changed to green after today's 3rd big loss with near average volume raised concerns and triggered a technical sell signal by violating its 50 DMA line ($233). Only a prompt rebound above the 50 DMA line would help its outlook improve. The prior low ($216.50 on 1/04/21) defines the next important support to watch. Fundamentals remain strong.
>>> FEATURED STOCK ARTICLE : Twice Average Volume Behind Breakout Gain - 1/12/2021 |
View all notes |
Set NEW NOTE alert |
Company Profile |
SEC
News |
Chart |
Request a new note
C
A
S
I |
AAXN
-
NASDAQ
Axon Enterprise Inc
Security/Sfty
|
$166.15
|
+1.99
1.21% |
$168.00
|
331,200
53.91% of 50 DAV
50 DAV is 614,400
|
$180.69
-8.05%
|
12/22/2020
|
$127.84
|
PP = $130.51
|
|
MB = $137.04
|
Most Recent Note - 2/1/2021 5:26:01 PM
Very extended from any sound base. Prior high ($134) defines important support coinciding with its 50 DMA line which acted as support during the recent consolidation. Fundamentals remain strong. Recently changed its ticker symbol to AXON where ongoing notes and analysis continues on this stock.
>>> FEATURED STOCK ARTICLE : Hit New Highs With Streak of Big Volume-Driven Gains - 1/15/2021 |
View all notes |
Set NEW NOTE alert |
Company Profile |
SEC
News |
Chart |
Request a new note
C
A
S
I |
QTWO
-
NYSE
Q2 Holdings Inc
Computer Sftwr-Financial
|
$131.05
|
+3.06
2.39% |
$132.10
|
860,937
181.17% of 50 DAV
50 DAV is 475,200
|
$142.76
-8.20%
|
11/12/2020
|
$105.14
|
PP = $106.54
|
|
MB = $111.87
|
Most Recent Note - 2/1/2021 4:51:00 PM
G - Posted a gain today with heavy volume, breaking streak of 3 volume-driven losses. Extended from any sound base. Its 50 DMA line ($123.624) defines important near term support to watch on pullbacks.
>>> FEATURED STOCK ARTICLE : Perched Near All-Time High Stubbornly Holding Ground - 1/26/2021 |
View all notes |
Set NEW NOTE alert |
Company Profile |
SEC
News |
Chart |
Request a new note
C
A
S
I |
Symbol/Exchange
Company Name
Industry Group |
PRICE |
CHANGE
(%Change) |
Day High |
Volume
(% DAV)
(% 50 day avg vol) |
52 Wk Hi
% From Hi |
Featured
Date |
Price
Featured |
Pivot Featured |
|
Max Buy |
AXON
-
NASDAQ
Axon Enterprise Inc
Security/Sfty
|
$166.15
|
+1.99
1.21% |
$168.00
|
331,200
53.94% of 50 DAV
50 DAV is 614,000
|
$180.69
-8.05%
|
12/22/2020
|
$127.84
|
PP = $130.51
|
|
MB = $137.04
|
Most Recent Note - 2/1/2021 5:22:13 PM
G - Very extended from any sound base. Prior high ($134) defines important support coinciding with its 50 DMA line which acted as support during the recent consolidation. Fundamentals remain strong. Formerly traded under the ticker symbol AAXN where prior notes and detailed analysis may be reviewed.
There are no Featured Stock Updates™ available for this stock at this time. You may request one by clicking the Request a New Note link below |
View all notes |
Set NEW NOTE alert |
Company Profile |
SEC
News |
Chart |
Request a new note
C
A
S
I |
|
|
|
THESE ARE NOT BUY RECOMMENDATIONS!
Comments contained in the body of this report are technical
opinions only. The material herein has been obtained
from sources believed to be reliable and accurate, however,
its accuracy and completeness cannot be guaranteed.
This site is not an investment advisor, hence it does
not endorse or recommend any securities or other investments.
Any recommendation contained in this report may not
be suitable for all investors and it is not to be deemed
an offer or solicitation on our part with respect to
the purchase or sale of any securities. All trademarks,
service marks and trade names appearing in this report
are the property of their respective owners, and are
likewise used for identification purposes only.
This report is a service available
only to active Paid Premium Members.
You may opt-out of receiving report notifications
at any time. Questions or comments may be submitted
by writing to Premium Membership Services 665 S.E. 10 Street, Suite 201 Deerfield Beach, FL 33441-5634 or by calling 1-800-965-8307
or 954-785-1121.
|
|
|