You are not logged in.
This means you
CAN ONLY VIEW reports that were published prior to Thursday, March 20, 2025.
You
MUST UPGRADE YOUR MEMBERSHIP if you want to see any current reports.
AFTER MARKET UPDATE - TUESDAY, JANUARY 19TH, 2021
Previous After Market Report Next After Market Report >>>
|
|
|
|
DOW |
+116.26 |
30,930.52 |
+0.38% |
|
Volume |
1,070,009,622 |
-13% |
|
Volume |
6,148,332,100 |
-2% |
|
NASDAQ |
+197.23 |
13,195.74 |
+1.52% |
|
Advancers |
1,975 |
63% |
|
Advancers |
2,536 |
67% |
|
S&P 500 |
+30.66 |
3,798.91 |
+0.81% |
|
Decliners |
1,179 |
37% |
|
Decliners |
1,249 |
33% |
|
Russell 2000 |
+25.79 |
2,148.99 |
+1.21% |
|
52 Wk Highs |
203 |
|
|
52 Wk Highs |
415 |
|
|
S&P 600 |
+12.39 |
1,224.30 |
+1.02% |
|
52 Wk Lows |
3 |
|
|
52 Wk Lows |
14 |
|
|
 |
Breadth Positive and Leadership Improved Behind Indices' Gains
Kenneth J. Gruneisen - Passed the CAN SLIM® Master's Exam
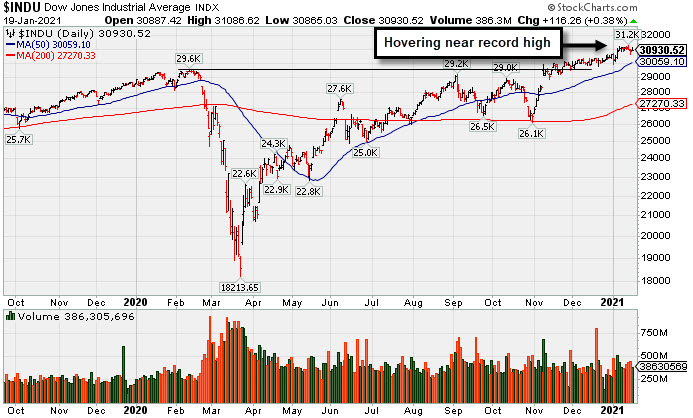
The Dow rose 116 points, while the S&P 500 added 0.8%. The Nasdaq Composite jumped 1.5%. The volume totals were lighter than the prior session on the NYSE and on the Nasdaq exchange. Breadth was clearly positive as advancers led decliners by almost a 2-1 margin on the NYSE and on the Nasdaq exchange. Leadership improved as there were 86 high-ranked companies from the Leaders List that hit new 52-week highs and were listed on the BreakOuts Page, versus the total of 33 on the prior session. New 52-week highs totals expanded and easily outnumbered the new 52-week lows totals on both exchanges. The major indices are in a confirmed uptrend (M criteria). Investors are reminded to always make buying and selling decisions based based on the strict criteria and rules of the fact-based investment system. PICTURED: The Dow Jones Industrial Average is hovering near its record high.
U.S. stocks advanced on Tuesday, as investors digested earnings results and monitored comments from incoming Treasury Secretary Janet Yellen during her confirmation hearing. The former Fed Chair discussed President-elect Biden’s $1.9 trillion coronavirus relief plan and responded to the Senate Finance committee’s questions on the federal deficit, potential tax changes, and the Fed's emergency lending programs. She also noted the Biden administration would not try to weaken the U.S. dollar for competitive advantage.
Eight of 11 S&P 500 sectors ended in positive territory, with the defensive groups Real Estate, Consumer Staples and Utilities the only laggards. Energy led advancers, extending its 2021 gains to 15%. Growth-oriented stocks also outperformed, with Communication Services and Information Technology both adding more than 1%. In earnings, Goldman Sachs (GS -2.26%) fell after its management signaled caution during the investor call following the bank's robust fourth-quarter earnings report. Meanwhile, Bank of America (BAC -0.73%) fell after disappointing Wall Street with an 18% year-over-year drop in fourth-quarter profits amid a decline in interest income.
There were no notable economic data releases today. Treasuries ended the day little changed, with the yield on the benchmark 10-year note holding steady at 1.09%. In commodities, WTI crude rose 1.2% to $53.01/barrel, despite the International Energy Agency (IEA) once again lowering its global demand forecast this year for oil consumption. COMEX gold added 0.5% to $1838.70/ounce after touching its lowest level since December 2nd on Monday amid strength in the U.S. dollar. |
 Kenneth J. Gruneisen started out as a licensed stockbroker in August 1987, a couple of months prior to the historic stock market crash that took the Dow Jones Industrial Average down -22.6% in a single day. He has published daily fact-based fundamental and technical analysis on high-ranked stocks online for two decades. Through FACTBASEDINVESTING.COM, Kenneth provides educational articles, news, market commentary, and other information regarding proven investment systems that work in good times and bad.
Comments contained in the body of this report are technical opinions only and are not necessarily those of Gruneisen Growth Corp. The material herein has been obtained from sources believed to be reliable and accurate, however, its accuracy and completeness cannot be guaranteed. Our firm, employees, and customers may effect transactions, including transactions contrary to any recommendation herein, or have positions in the securities mentioned herein or options with respect thereto. Any recommendation contained in this report may not be suitable for all investors and it is not to be deemed an offer or solicitation on our part with respect to the purchase or sale of any securities. |
|
 |
Financial, Tech, and Energy-Linked Groups Rose
Kenneth J. Gruneisen - Passed the CAN SLIM® Master's Exam
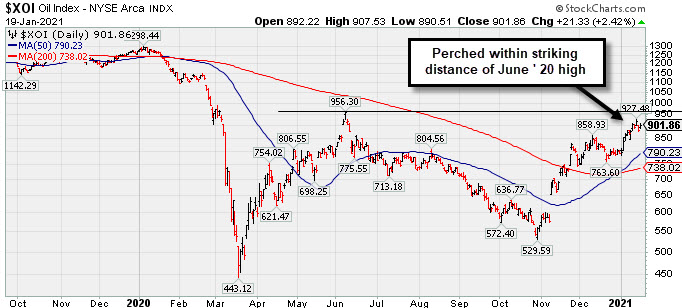
The Broker/Dealer Index ($XBD +0.77%) and Bank Index ($BKX +0.43%) both posted modest gains while the Retail Index ($RLX +0.07%) finished flat. The Semiconductor Index ($SOX +3.37%) led the tech sector higher while the Biotech Index ($BTK +1.75%) and Networking Index ($NWX +1.17%) also posted decent gains. The Integrated Oil Index ($XOI +2.42%) outpaced the Oil Services Index ($OSX +0.38%). The Gold & Silver Index ($XAU +1.07%) also posted a solid gain.
PICTURED: The Integrated Oil Index ($XOI +2.42%) posted a big gain, rising near its Jun '20 high.
| Oil Services |
$OSX |
52.27 |
+0.20 |
+0.38% |
+17.90% |
| Integrated Oil |
$XOI |
901.86 |
+21.33 |
+2.42% |
+13.80% |
| Semiconductor |
$SOX |
3,093.77 |
+101.00 |
+3.37% |
+10.67% |
| Networking |
$NWX |
750.87 |
+8.66 |
+1.17% |
+4.71% |
| Broker/Dealer |
$XBD |
401.35 |
+3.07 |
+0.77% |
+6.29% |
| Retail |
$RLX |
3,534.41 |
+2.51 |
+0.07% |
-0.81% |
| Gold & Silver |
$XAU |
138.99 |
+1.47 |
+1.07% |
-3.61% |
| Bank |
$BKX |
107.38 |
+0.45 |
+0.43% |
+9.67% |
| Biotech |
$BTK |
6,127.44 |
+105.41 |
+1.75% |
+6.77% |
|
|
|
 |
Hit New All-Time High With Gain Backed by Average Volume
Kenneth J. Gruneisen - Passed the CAN SLIM® Master's Exam
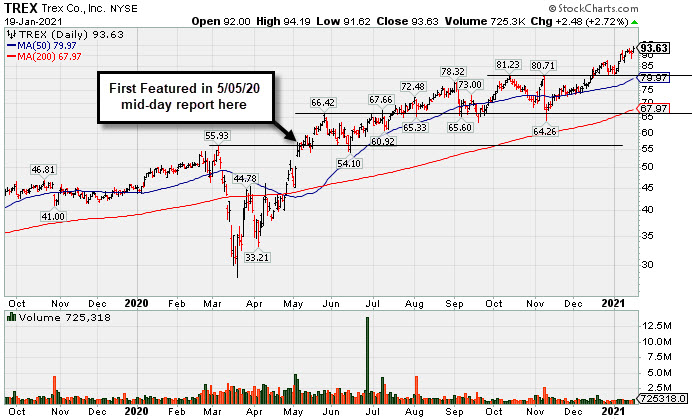
Trex Company Inc (TREX +$2.48 or +2.72% to $93.63) posted another gain today with average volume for a new all-time high. Prior highs in the $80-81 area define initial support to watch above its 50-day moving average (DMA) line ($80).
Recently it reported Sep '20 quarterly earnings +14% on +19% sales revenues versus the year ago period, below the +25% minimum guideline (C criteria) raising fundamental concerns while breaking a streak of 4 consecutive quarterly comparisons above the +25% minimum earnings guideline (C criteria).
TREX last appeared in this FSU section on 12/22/20 with an annotated graph under the headline, "Hit New High With Light Volume Behind 4th Consecutive Gain". It has a 95 Earnings Per Share Rating. Annual earnings (A criteria) growth has been strong. The company hails from the General Building Materials industry group which currently has a Group Relative Strength Rating of (61) B.
The company has a new CEO as of 4/29/20. After a 2:1 share split effective 9/15/20 it now has a supply (S criteria) of 115.8 million shares outstanding. The number of top-rated funds owning its shares rose from 540 in Jun '19 to 768 in Sep '20, a reassuring sign concerning the I criteria. Its current Up/Down Volume Ratio of 1.4 is an unbiased indication its shares have been under accumulation over the past 50 days. It has a Timeliness rating of B and a Sponsorship Rating of B.
|
|
|
Color Codes Explained :
Y - Better candidates highlighted by our
staff of experts.
G - Previously featured
in past reports as yellow but may no longer be buyable under the
guidelines.
***Last / Change / Volume data in this table is the closing quote data***
Symbol/Exchange
Company Name
Industry Group |
PRICE |
CHANGE
(%Change) |
Day High |
Volume
(% DAV)
(% 50 day avg vol) |
52 Wk Hi
% From Hi |
Featured
Date |
Price
Featured |
Pivot Featured |
|
Max Buy |
 CRL
-
NYSE
CRL
-
NYSE
Charles River Labs Intl
DRUGS - Biotechnology
|
$278.89
|
+5.17
1.89% |
$280.10
|
375,318
128.09% of 50 DAV
50 DAV is 293,000
|
$278.08
0.29%
|
12/17/2020
|
$247.06
|
PP = $257.98
|
|
MB = $270.88
|
Most Recent Note - 1/15/2021 5:12:38 PM
Y - Posted a solid gain today rebounding near its all-time high. Recent gains above its pivot point backed by at least +40% above average volume helped clinch a proper new (or add-on) technical buy signal. Its 50 DMA line ($245) acted as support. Reported Sep '20 quarterly earnings +38% on +11% sales revenues versus the year ago period, above the +25% minimum earnings guideline (C criteria).
>>> FEATURED STOCK ARTICLE : Hovering in Tight Range Holding Ground Near High - 1/5/2021 |
View all notes |
Set NEW NOTE alert |
Company Profile |
SEC
News |
Chart |
Request a new note
C
A
S
I |
AMD
-
NYSE
Advanced Micro Devices
ELECTRONICS - Semiconductor - Broad Line
|
$89.45
|
+1.24
1.41% |
$89.58
|
44,894,968
103.47% of 50 DAV
50 DAV is 43,389,500
|
$99.23
-9.86%
|
11/18/2020
|
$82.54
|
PP = $88.72
|
|
MB = $93.16
|
Most Recent Note - 1/15/2021 5:15:19 PM
G - Color code is changed to green after today's 4th consecutive volume-driven loss undercut its recent lows in the $89 area and violated its 50 DMA line ($89.83) raising concerns. Only a prompt rebound above the 50 DMA line would help its outlook improve.
>>> FEATURED STOCK ARTICLE : Distributional Pressure Brings Pullback Below "Max Buy" Level - 1/13/2021 |
View all notes |
Set NEW NOTE alert |
Company Profile |
SEC
News |
Chart |
Request a new note
C
A
S
I |
TER
-
NASDAQ
Teradyne Inc
ELECTRONICS - Semiconductor Equipment and Mate
|
$140.63
|
+3.33
2.43% |
$141.57
|
1,874,601
128.49% of 50 DAV
50 DAV is 1,459,000
|
$139.55
0.77%
|
10/21/2020
|
$92.22
|
PP = $93.54
|
|
MB = $98.22
|
 Most Recent Note - 1/19/2021 5:11:36 PM
G - Hit yet another new all-time high with today's gain backed by above average volume, getting very extended from any sound base. Support to watch on pullbacks is its 50 DMA line ($116.32).
>>> FEATURED STOCK ARTICLE : Perched Near Record High Very Extended From Any Sound Base - 12/30/2020 |
View all notes |
Set NEW NOTE alert |
Company Profile |
SEC
News |
Chart |
Request a new note
C
A
S
I |
AMRC
-
NYSE
Ameresco Inc Cl A
ENERGY - Alternative
|
$57.53
|
+3.50
6.48% |
$58.05
|
602,595
142.46% of 50 DAV
50 DAV is 423,000
|
$63.45
-9.33%
|
12/15/2020
|
$46.72
|
PP = $47.10
|
|
MB = $49.46
|
Most Recent Note - 1/19/2021 12:08:16 PM
G - Very extended from any sound base. Its 50 DMA line ($48.26) and prior highs in the $46-47 area define important near-term support to watch on pullbacks.
>>> FEATURED STOCK ARTICLE : Very Extended From Base After Another Powerful Gain - 1/6/2021 |
View all notes |
Set NEW NOTE alert |
Company Profile |
SEC
News |
Chart |
Request a new note
C
A
S
I |
TREX
-
NYSE
Trex Company Inc
MATERIALS and CONSTRUCTION - General Building Materials
|
$93.63
|
+2.48
2.72% |
$94.19
|
723,186
98.80% of 50 DAV
50 DAV is 732,000
|
$93.29
0.36%
|
6/26/2020
|
$54.53
|
PP = $66.47
|
|
MB = $69.79
|
Most Recent Note - 1/19/2021 5:06:01 PM
G - Posted a big gain today with average volume for a new all-time high. Prior highs in the $80-81 area define initial support to watch above its 50 DMA line ($80). Recently noted that it reported Sep '20 quarterly earnings +14% on +19% sales revenues versus the year ago period, below the +25% minimum guideline (C criteria) raising fundamental concerns. See the latest FSU analysis for more details and a new annotated graph.
>>> FEATURED STOCK ARTICLE : Hit New All-Time High With Gain Backed by Average Volume - 1/19/2021 |
View all notes |
Set NEW NOTE alert |
Company Profile |
SEC
News |
Chart |
Request a new note
C
A
S
I |
Symbol/Exchange
Company Name
Industry Group |
PRICE |
CHANGE
(%Change) |
Day High |
Volume
(% DAV)
(% 50 day avg vol) |
52 Wk Hi
% From Hi |
Featured
Date |
Price
Featured |
Pivot Featured |
|
Max Buy |
CLFD
-
NASDAQ
Clearfield Inc
TELECOMMUNICATIONS - Cables / Satalite Equipment
|
$28.15
|
+0.81
2.96% |
$28.19
|
78,271
77.50% of 50 DAV
50 DAV is 101,000
|
$28.32
-0.60%
|
11/17/2020
|
$22.06
|
PP = $26.07
|
|
MB = $27.37
|
Most Recent Note - 1/19/2021 5:21:10 PM
G - Posted a big gain today back above its "max buy" level and closed near the session high. Color code is changed to green. Recently found prompt support at its 50 DMA line ($24.79) and upward trendline when consolidating.
>>> FEATURED STOCK ARTICLE : Distributional Pressure While Testing Important Chart Support - 1/4/2021 |
View all notes |
Set NEW NOTE alert |
Company Profile |
SEC
News |
Chart |
Request a new note
C
A
S
I |
NOW
-
NYSE
Servicenow Inc
Computer Sftwr-Enterprse
|
$519.42
|
+5.66
1.10% |
$522.95
|
976,075
73.88% of 50 DAV
50 DAV is 1,321,100
|
$566.74
-8.35%
|
8/20/2020
|
$453.34
|
PP = $454.79
|
|
MB = $477.53
|
Most Recent Note - 1/19/2021 5:17:43 PM
G - Today's big gain with lighter volume helped it rebound toward its 50 DMA line ($527). Subsequent gains above that important short term average are needed for its outlook to improve. Due to report Dec '20 quarterly results on 1/27/21. Fundamental concerns were raised when it reported Sep '20 quarterly earnings +22% on +30% sales revenues versus the year ago period, below the +25% minimum guideline (C criteria) of the fact-based investment system.
>>> FEATURED STOCK ARTICLE : Gain Today and Rebound Above 50-Day Moving Average Line - 1/8/2021 |
View all notes |
Set NEW NOTE alert |
Company Profile |
SEC
News |
Chart |
Request a new note
C
A
S
I |
SMPL
-
NASDAQ
Simply Good Foods Co
Food-Confectionery
|
$27.01
|
-0.99
-3.54% |
$28.28
|
694,120
51.02% of 50 DAV
50 DAV is 1,360,400
|
$32.03
-15.67%
|
12/28/2020
|
$30.40
|
PP = $31.44
|
|
MB = $33.01
|
Most Recent Note - 1/19/2021 5:08:48 PM
Y - Pulled back today for a 7th consecutive loss on light volume. A "negative reversal" was noted on 1/04/21 at its all-time high. Subsequent gains above its pivot point backed by at least +40% above average volume are still needed to trigger a technical buy signal.
>>> FEATURED STOCK ARTICLE : Challenging All-Time High as it Joins Small Cap Index - 12/28/2020 |
View all notes |
Set NEW NOTE alert |
Company Profile |
SEC
News |
Chart |
Request a new note
C
A
S
I |
ALRM
-
NASDAQ
Alarm.com Holdings Inc
Security/Sfty
|
$97.94
|
+0.33
0.34% |
$98.70
|
479,501
102.02% of 50 DAV
50 DAV is 470,000
|
$108.67
-9.87%
|
11/6/2020
|
$71.88
|
PP = $74.76
|
|
MB = $78.50
|
Most Recent Note - 1/15/2021 12:29:53 PM
G - It is still very extended from any sound base while slumping further today with above average volume. Gapped down on the prior session and suffered a large loss with above average volume after announcing an offering of $350 million convertible senior notes. Its 50 DMA line ($84.76) and prior high ($74.66 on 7/23/20) define important near-term support to watch.
>>> FEATURED STOCK ARTICLE : Perched at High After Impressive Streak of Gains - 12/24/2020 |
View all notes |
Set NEW NOTE alert |
Company Profile |
SEC
News |
Chart |
Request a new note
C
A
S
I |
TEAM
-
NASDAQ
Atlassian Corp Plc
Comp Sftwr-Spec Enterprs
|
$226.74
|
+3.81
1.71% |
$229.41
|
1,485,116
93.43% of 50 DAV
50 DAV is 1,589,600
|
$250.03
-9.31%
|
10/12/2020
|
$193.77
|
PP = $199.60
|
|
MB = $209.58
|
Most Recent Note - 1/19/2021 5:10:36 PM
G - Found support today while consolidating above its 50 DMA line ($222) and above the prior high in the $216 area which defines important near-term support to watch. However, its current Relative Strength Rating is 64, below the +80 minimum guideline for buy candidates. Earnings rose +7% on +26% sales revenues for the Sep '20 quarter versus the year ago period, below the +25% minimum earnings guideline (C criteria), raising fundamental concerns.
>>> FEATURED STOCK ARTICLE : Relative Strength Rating Remains Below 80+ Minimum Guideline - 1/11/2021 |
View all notes |
Set NEW NOTE alert |
Company Profile |
SEC
News |
Chart |
Request a new note
C
A
S
I |
Symbol/Exchange
Company Name
Industry Group |
PRICE |
CHANGE
(%Change) |
Day High |
Volume
(% DAV)
(% 50 day avg vol) |
52 Wk Hi
% From Hi |
Featured
Date |
Price
Featured |
Pivot Featured |
|
Max Buy |
SHOP
-
NYSE
Shopify Inc Cl A
Computer Sftwr-Enterprse
|
$1,173.97
|
+3.50
0.30% |
$1,190.66
|
765,625
53.69% of 50 DAV
50 DAV is 1,426,000
|
$1,285.19
-8.65%
|
12/16/2020
|
$1,146.00
|
PP = $1,147.01
|
|
MB = $1,204.36
|
Most Recent Note - 1/19/2021 5:07:19 PM
Y - Volume totals have still been cooling while consolidating perched near its all-time high. Found prompt support near prior highs in the $1,146-1,130 area and above its 50 DMA line ($1,079) which defines the next important support to watch.
>>> FEATURED STOCK ARTICLE : Rebounded After Undercutting Prior Highs - 1/7/2021 |
View all notes |
Set NEW NOTE alert |
Company Profile |
SEC
News |
Chart |
Request a new note
C
A
S
I |
YETI
-
NYSE
Yeti Holdings Inc
Leisure-Products
|
$69.17
|
-4.84
-6.54% |
$71.96
|
3,867,440
325.54% of 50 DAV
50 DAV is 1,188,000
|
$80.89
-14.49%
|
11/5/2020
|
$57.25
|
PP = $55.14
|
|
MB = $57.90
|
Most Recent Note - 1/19/2021 12:54:42 PM
G - The prior low ($67) and 50 DMA line ($66.66) define important near-term support to watch. Gapped down for a 2nd consecutive session today following a "negative reversal" last week at its all-time high. Repeatedly noted as "extended from any sound base".
>>> FEATURED STOCK ARTICLE : Pulling Back After Recently Wedging to New Highs - 12/29/2020 |
View all notes |
Set NEW NOTE alert |
Company Profile |
SEC
News |
Chart |
Request a new note
C
A
S
I |
DOCU
-
NASDAQ
Docusign Inc
Computer Sftwr-Enterprse
|
$256.57
|
+7.29
2.92% |
$260.38
|
3,061,256
77.66% of 50 DAV
50 DAV is 3,942,000
|
$290.23
-11.60%
|
1/12/2021
|
$253.50
|
PP = $256.10
|
|
MB = $268.91
|
Most Recent Note - 1/19/2021 5:13:43 PM
Y - Posted a gain today with higher (but still below average) volume. Finished strong on 1/12/21 after highlighted in yellow with pivot point cited based on its 12/04/20 high plus 10 cents. The big gain and strong close above the pivot point backed by twice average volume clinched a technical buy signal. Recently found support near its 50 DMA line ($230). Fundamentals remain strong.
>>> FEATURED STOCK ARTICLE : Twice Average Volume Behind Breakout Gain - 1/12/2021 |
View all notes |
Set NEW NOTE alert |
Company Profile |
SEC
News |
Chart |
Request a new note
C
A
S
I |
AAXN
-
NASDAQ
Axon Enterprise Inc
Security/Sfty
|
$159.36
|
+8.59
5.70% |
$159.85
|
1,209,643
200.94% of 50 DAV
50 DAV is 602,000
|
$166.49
-4.28%
|
12/22/2020
|
$127.84
|
PP = $130.51
|
|
MB = $137.04
|
Most Recent Note - 1/19/2021 12:06:07 PM
G - Very extended from any sound base, perched at its all-time high and on track for a 5th consecutive volume-driven gain. Prior high ($134) defines initial support to watch. Found prompt support near its 50 DMA line ($126) during the recent consolidation. Fundamentals remain strong. See the latest FSU analysis for more details and a new annotated graph.
>>> FEATURED STOCK ARTICLE : Hit New Highs With Streak of Big Volume-Driven Gains - 1/15/2021 |
View all notes |
Set NEW NOTE alert |
Company Profile |
SEC
News |
Chart |
Request a new note
C
A
S
I |
QTWO
-
NYSE
Q2 Holdings Inc
Computer Sftwr-Financial
|
$132.18
|
+3.07
2.38% |
$133.25
|
455,801
96.57% of 50 DAV
50 DAV is 472,000
|
$132.08
0.08%
|
11/12/2020
|
$105.14
|
PP = $106.54
|
|
MB = $111.87
|
Most Recent Note - 1/19/2021 5:19:05 PM
G - Posted a gain today on average volume for a new all-time high. Its 50 DMA line ($118) defines important near term support to watch on pullbacks.
>>> FEATURED STOCK ARTICLE : Stubbornly Holding Ground Extended From Prior Base - 12/31/2020 |
View all notes |
Set NEW NOTE alert |
Company Profile |
SEC
News |
Chart |
Request a new note
C
A
S
I |
Symbol/Exchange
Company Name
Industry Group |
PRICE |
CHANGE
(%Change) |
Day High |
Volume
(% DAV)
(% 50 day avg vol) |
52 Wk Hi
% From Hi |
Featured
Date |
Price
Featured |
Pivot Featured |
|
Max Buy |
|
|
|
THESE ARE NOT BUY RECOMMENDATIONS!
Comments contained in the body of this report are technical
opinions only. The material herein has been obtained
from sources believed to be reliable and accurate, however,
its accuracy and completeness cannot be guaranteed.
This site is not an investment advisor, hence it does
not endorse or recommend any securities or other investments.
Any recommendation contained in this report may not
be suitable for all investors and it is not to be deemed
an offer or solicitation on our part with respect to
the purchase or sale of any securities. All trademarks,
service marks and trade names appearing in this report
are the property of their respective owners, and are
likewise used for identification purposes only.
This report is a service available
only to active Paid Premium Members.
You may opt-out of receiving report notifications
at any time. Questions or comments may be submitted
by writing to Premium Membership Services 665 S.E. 10 Street, Suite 201 Deerfield Beach, FL 33441-5634 or by calling 1-800-965-8307
or 954-785-1121.
|
|
|