You are not logged in.
This means you
CAN ONLY VIEW reports that were published prior to Thursday, March 20, 2025.
You
MUST UPGRADE YOUR MEMBERSHIP if you want to see any current reports.
AFTER MARKET UPDATE - FRIDAY, JANUARY 8TH, 2021
Previous After Market Report Next After Market Report >>>
|
|
|
|
DOW |
+56.84 |
31,097.97 |
+0.18% |
|
Volume |
1,040,887,958 |
-6% |
|
Volume |
7,157,421,000 |
+6% |
|
NASDAQ |
+134.50 |
13,201.98 |
+1.03% |
|
Advancers |
1,604 |
52% |
|
Advancers |
1,953 |
52% |
|
S&P 500 |
+20.89 |
3,824.68 |
+0.55% |
|
Decliners |
1,470 |
48% |
|
Decliners |
1,773 |
48% |
|
Russell 2000 |
-5.23 |
2,091.66 |
-0.25% |
|
52 Wk Highs |
322 |
|
|
52 Wk Highs |
545 |
|
|
S&P 600 |
-9.55 |
1,190.26 |
-0.80% |
|
52 Wk Lows |
0 |
|
|
52 Wk Lows |
11 |
|
|
 |
Major Indices Rose Even Further With a Lot of Leadership
Kenneth J. Gruneisen - Passed the CAN SLIM® Master's Exam
The Dow and S&P 500 both rose for a fourth straight session, rising 56 points and 0.6%, respectively. Each benchmark also notched weekly gains, with the Dow climbing 1.7% and the S&P 500 advancing 1.8%. Meanwhile, the Nasdaq Composite rallied 1% on Friday, capping a weekly jump of 2.4%. The Russell 2000 index of small cap stocks narrowly bucked the uptrend, but still rose more than 5% for the week. The volume totals were mixed, lighter than the prior session volume total on the NYSE and higher on the Nasdaq exchange. Breadth was slightly positive as advancers led decliners by a narrow margin on the NYSE and on the Nasdaq exchange. There were 140 high-ranked companies from the Leaders List that hit new 52-week highs and were listed on the BreakOuts Page, versus the total of 160 on the prior session. New 52-week highs totals easily outnumbered new 52-week lows totals on both exchanges. The major indices are in a confirmed uptrend (M criteria). Investors are reminded to always make buying and selling decisions based based on the strict criteria and rules of the fact-based investment system. PICTURED: The Dow Jones Industrial Average posted a 4th consecutive gain for a new record high.
All three U.S. major averages closed at fresh all-time highs as prospects for an increase in fiscal aid overshadowed a disappointing update on the U.S. labor market. Reports that President-elect Joe Biden called on a Democratic-led Congress to provide additional coronavirus relief buoyed sentiment. He highlighted the monthly jobs report, which showed U.S. nonfarm payrolls fell 140,000 in December. The figure was the first contraction since April, and came in well below expectations for a scant 50,000 gain and the prior month's upwardly revised 336,000 increase. Meanwhile, the unemployment rate held steady at 6.7%. Treasuries extended their decline. The yield on the benchmark 10-year note climbed three basis points to 1.11%, 20 basis points above where in ended 2020.
rose Seven of 11 S&P 500 sectors finished in positive territory. Consumer Discretionary stocks paced the gains, with Tesla (TSLA +7.84%) rallying to cap an 11th straight daily advance. Financials was a notable laggard, as banks snapped a three day rally. In other corporate news, Micron Technology (MU -2.14%) had a "negative reversal" after topping Wall Street earnings projections. F5 Networks (FFIV +6.19%) rose after announcing it will buy software startup Volterra for $440 million. |
 Kenneth J. Gruneisen started out as a licensed stockbroker in August 1987, a couple of months prior to the historic stock market crash that took the Dow Jones Industrial Average down -22.6% in a single day. He has published daily fact-based fundamental and technical analysis on high-ranked stocks online for two decades. Through FACTBASEDINVESTING.COM, Kenneth provides educational articles, news, market commentary, and other information regarding proven investment systems that work in good times and bad.
Comments contained in the body of this report are technical opinions only and are not necessarily those of Gruneisen Growth Corp. The material herein has been obtained from sources believed to be reliable and accurate, however, its accuracy and completeness cannot be guaranteed. Our firm, employees, and customers may effect transactions, including transactions contrary to any recommendation herein, or have positions in the securities mentioned herein or options with respect thereto. Any recommendation contained in this report may not be suitable for all investors and it is not to be deemed an offer or solicitation on our part with respect to the purchase or sale of any securities. |
|
 |
Retail Index Posted a Standout Gain
Kenneth J. Gruneisen - Passed the CAN SLIM® Master's Exam
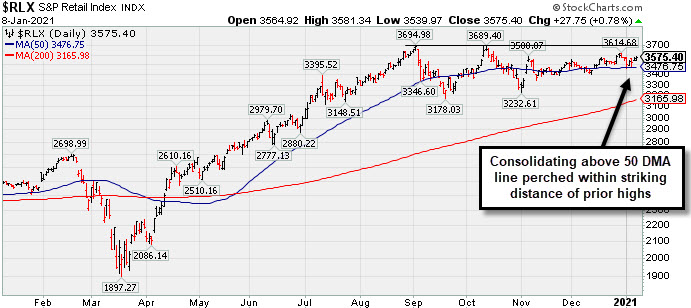
The Retail Index ($RLX +0.78%) posted an influential gain while the Broker/Dealer Index ($XBD +0.18%) inched higher but the Bank Index ($BKX -0.88%) lost ground. The Biotech Index ($BTK -0.84%) pulled back while the Semiconductor Index ($SOX +0.01%) ended flat and the Networking Index ($NWX +0.27%) eked out a small gain. The Gold & Silver Index ($XAU -4.71%) was a standout decliner while the Oil Services Index ($OSX -0.95%) and Integrated Oil Index ($XOI -0.55%) each suffered a smaller loss.
PICTURED: The Retail Index ($RLX +0.78%) posted an influential gain while consolidating above its 50-day moving average (DMA) line perched within striking distance of prior highs.
| Oil Services |
$OSX |
50.37 |
-0.48 |
-0.95% |
+13.62% |
| Integrated Oil |
$XOI |
868.96 |
-4.81 |
-0.55% |
+9.65% |
| Semiconductor |
$SOX |
2,937.39 |
+0.39 |
+0.01% |
+5.08% |
| Networking |
$NWX |
727.01 |
+1.94 |
+0.27% |
+1.38% |
| Broker/Dealer |
$XBD |
398.17 |
+0.72 |
+0.18% |
+5.45% |
| Retail |
$RLX |
3,575.40 |
+27.75 |
+0.78% |
+0.34% |
| Gold & Silver |
$XAU |
147.24 |
-7.28 |
-4.71% |
+2.11% |
| Bank |
$BKX |
106.31 |
-0.95 |
-0.88% |
+8.58% |
| Biotech |
$BTK |
5,958.69 |
-50.50 |
-0.84% |
+3.83% |
|
|
|
 |
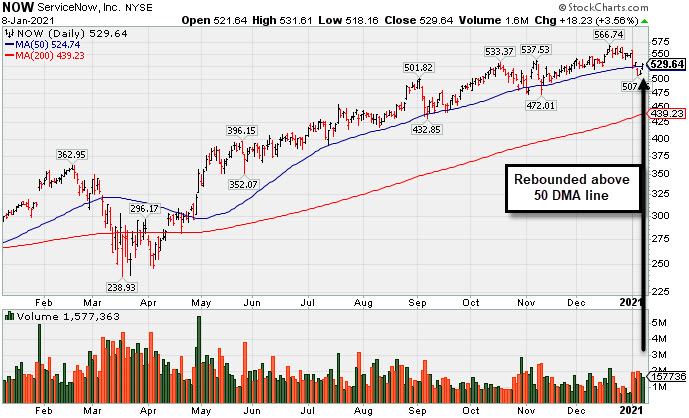
Gain Today and Rebound Above 50-Day Moving Average Line
Kenneth J. Gruneisen - Passed the CAN SLIM® Master's Exam
ServiceNow Inc (NOW +$18.23 or +3.56% to $529.64) volume was near average behind today's big gain as it rebounded above its 50-day moving average (DMA) line ($524) helping its outlook improve. Recently it reported Sep '20 quarterly earnings +22% on +30% sales revenues versus the year ago period, below the +25% minimum guideline (C criteria) of the fact-based investment system, raising fundamental concerns.
A slump in the group has raised some concerns regarding the L criteria. The Computer Software - Enterprise group currently has a Group Relative Strength Rating of D+ (24), down from B- (52) when last shown in this FSU section on 12/17/20 with an annotated graph under the headline, "Hit New Record High With Light Volume Behind Gain".
It reported Jun '20 quarterly earnings +73% on +28% sales revenues versus the year ago period and prior results had been routinely above the +25% minimum earnings guideline (C criteria). It has an Earnings Per Share Rating of 98. NOW has a new CEO as of 1/01/20.
NOW traded up as much as +65.2% since first highlighted in yellow in the 4/30/20 mid-day report with a pivot point based on its 2/19/20 high plus 10 cents (read here). The number of top-rated funds owning its shares rose from 1,030 in Jun '17 to 2.470 in Sep '20, a reassuring sign concerning the I criteria. It has a Timeliness Rating of B and a Sponsorship Rating of A. Its current Up/Down Volume Ratio of 1.2 is an unbiased indication its shares have been under slight accumulation over the past 50 days. |
|
|
Color Codes Explained :
Y - Better candidates highlighted by our
staff of experts.
G - Previously featured
in past reports as yellow but may no longer be buyable under the
guidelines.
***Last / Change / Volume data in this table is the closing quote data***
Symbol/Exchange
Company Name
Industry Group |
PRICE |
CHANGE
(%Change) |
Day High |
Volume
(% DAV)
(% 50 day avg vol) |
52 Wk Hi
% From Hi |
Featured
Date |
Price
Featured |
Pivot Featured |
|
Max Buy |
 CRL
-
NYSE
CRL
-
NYSE
Charles River Labs Intl
DRUGS - Biotechnology
|
$271.01
|
+7.85
2.98% |
$271.73
|
427,221
139.30% of 50 DAV
50 DAV is 306,700
|
$263.37
2.90%
|
12/17/2020
|
$247.06
|
PP = $257.98
|
|
MB = $270.88
|
Most Recent Note - 1/7/2021 5:42:03 PM
Y - Posted a 3rd consecutive gain today with near average volume hitting a new all-time high. The pivot point cited is based on its 11/09/20 high plus 10 cents. Subsequent gains above its pivot point backed by at least +40% above average volume may help clinch a proper new (or add-on) technical buy signal. Its 50 DMA line ($239) has been acting as support. Reported Sep '20 quarterly earnings +38% on +11% sales revenues versus the year ago period, above the +25% minimum earnings guideline (C criteria). See the latest FSU analysis for more details and a new annotated graph.
>>> FEATURED STOCK ARTICLE : Hovering in Tight Range Holding Ground Near High - 1/5/2021 |
View all notes |
Set NEW NOTE alert |
Company Profile |
SEC
News |
Chart |
Request a new note
C
A
S
I |
AMD
-
NASDAQ
Advanced Micro Devices
ELECTRONICS - Semiconductor - Broad Line
|
$94.58
|
-0.58
-0.61% |
$96.40
|
39,685,580
87.25% of 50 DAV
50 DAV is 45,485,000
|
$97.98
-3.47%
|
11/18/2020
|
$82.54
|
PP = $88.72
|
|
MB = $93.16
|
Most Recent Note - 1/7/2021 5:35:21 PM
G - Posted a big gain today with below average volume and its color code is changed to green after rising back above its "max buy" level. Its 50 DMA line ($87.87) defines important near term support to watch on pullbacks.
>>> FEATURED STOCK ARTICLE : Pulling Back From its Record High Hit Last Week - 12/21/2020 |
View all notes |
Set NEW NOTE alert |
Company Profile |
SEC
News |
Chart |
Request a new note
C
A
S
I |
TER
-
NASDAQ
Teradyne Inc
ELECTRONICS - Semiconductor Equipment and Mate
|
$132.15
|
+2.24
1.72% |
$133.48
|
1,340,275
93.01% of 50 DAV
50 DAV is 1,441,000
|
$130.74
1.08%
|
10/21/2020
|
$92.22
|
PP = $93.54
|
|
MB = $98.22
|
Most Recent Note - 1/7/2021 5:38:10 PM
G - Powered to a new all-time high as it posted a 3rd consecutive gain today with above average volume. Support to watch on pullbacks is its 50 DMA line ($109.67).
>>> FEATURED STOCK ARTICLE : Perched Near Record High Very Extended From Any Sound Base - 12/30/2020 |
View all notes |
Set NEW NOTE alert |
Company Profile |
SEC
News |
Chart |
Request a new note
C
A
S
I |
AMRC
-
NYSE
Ameresco Inc Cl A
ENERGY - Alternative
|
$61.28
|
+1.38
2.30% |
$63.45
|
1,071,334
269.86% of 50 DAV
50 DAV is 397,000
|
$60.24
1.73%
|
12/15/2020
|
$46.72
|
PP = $47.10
|
|
MB = $49.46
|
Most Recent Note - 1/7/2021 5:36:20 PM
G - Powered to a new all-time high with today's 3rd consecutive volume-driven gain, getting more extended from any sound base. Prior highs in the $46-47 area define initial support to watch on pullbacks. See the latest FSU analysis for more details and an annotated graph.
>>> FEATURED STOCK ARTICLE : Very Extended From Base After Another Powerful Gain - 1/6/2021 |
View all notes |
Set NEW NOTE alert |
Company Profile |
SEC
News |
Chart |
Request a new note
C
A
S
I |
TREX
-
NYSE
Trex Company Inc
MATERIALS and CONSTRUCTION - General Building Materials
|
$88.97
|
-1.63
-1.80% |
$92.33
|
698,446
90.47% of 50 DAV
50 DAV is 772,000
|
$90.74
-1.95%
|
6/26/2020
|
$54.53
|
PP = $66.47
|
|
MB = $69.79
|
Most Recent Note - 1/7/2021 5:39:13 PM
G - Posted a 3rd consecutive gain today with average volume hitting a new 52-week high. Prior highs in the $80-81 area define initial support to watch above its 50 DMA line ($77.25). Recently noted that it reported Sep '20 quarterly earnings +14% on +19% sales revenues versus the year ago period, below the +25% minimum guideline (C criteria) raising fundamental concerns.
>>> FEATURED STOCK ARTICLE : Hit New High With Light Volume Behind 4th Consecutive Gain - 12/22/2020 |
View all notes |
Set NEW NOTE alert |
Company Profile |
SEC
News |
Chart |
Request a new note
C
A
S
I |
Symbol/Exchange
Company Name
Industry Group |
PRICE |
CHANGE
(%Change) |
Day High |
Volume
(% DAV)
(% 50 day avg vol) |
52 Wk Hi
% From Hi |
Featured
Date |
Price
Featured |
Pivot Featured |
|
Max Buy |
CLFD
-
NASDAQ
Clearfield Inc
TELECOMMUNICATIONS - Cables / Satalite Equipment
|
$25.88
|
+0.05
0.19% |
$26.17
|
52,313
51.80% of 50 DAV
50 DAV is 101,000
|
$28.32
-8.62%
|
11/17/2020
|
$22.06
|
PP = $26.07
|
|
MB = $27.37
|
Most Recent Note - 1/6/2021 6:06:26 PM
Y - Posted a 2nd consecutive gain with light volume today, finding prompt support at its 50 DMA line ($23.87) and at an upward trendline.
>>> FEATURED STOCK ARTICLE : Distributional Pressure While Testing Important Chart Support - 1/4/2021 |
View all notes |
Set NEW NOTE alert |
Company Profile |
SEC
News |
Chart |
Request a new note
C
A
S
I |
NOW
-
NYSE
Servicenow Inc
Computer Sftwr-Enterprse
|
$529.64
|
+18.23
3.56% |
$531.61
|
1,577,340
112.88% of 50 DAV
50 DAV is 1,397,400
|
$566.74
-6.55%
|
8/20/2020
|
$453.34
|
PP = $454.79
|
|
MB = $477.53
|
 Most Recent Note - 1/8/2021 5:29:46 PM
G - Today's big gain and rebound above its 50 DMA line ($524) helped its outlook improve. Recently reported Sep '20 quarterly earnings +22% on +30% sales revenues versus the year ago period, below the +25% minimum guideline (C criteria) of the fact-based investment system. See the latest FSU analysis for more details and a new annotated graph.
>>> FEATURED STOCK ARTICLE : Gain Today and Rebound Above 50-Day Moving Average Line - 1/8/2021 |
View all notes |
Set NEW NOTE alert |
Company Profile |
SEC
News |
Chart |
Request a new note
C
A
S
I |
SMPL
-
NASDAQ
Simply Good Foods Co
Food-Confectionery
|
$29.77
|
-0.30
-1.00% |
$30.43
|
781,108
55.85% of 50 DAV
50 DAV is 1,398,600
|
$32.03
-7.06%
|
12/28/2020
|
$30.40
|
PP = $31.44
|
|
MB = $33.01
|
Most Recent Note - 1/8/2021 5:33:22 PM
Y - Quietly consolidating after a "negative reversal" on 1/04/21 at its all-time high. Subsequent gains above its pivot point backed by at least +40% above average volume may trigger a technical buy signal.
>>> FEATURED STOCK ARTICLE : Challenging All-Time High as it Joins Small Cap Index - 12/28/2020 |
View all notes |
Set NEW NOTE alert |
Company Profile |
SEC
News |
Chart |
Request a new note
C
A
S
I |
ALRM
-
NASDAQ
Alarm.com Holdings Inc
Security/Sfty
|
$105.08
|
-0.42
-0.40% |
$107.18
|
351,748
80.31% of 50 DAV
50 DAV is 438,000
|
$105.68
-0.57%
|
11/6/2020
|
$71.88
|
PP = $74.76
|
|
MB = $78.50
|
Most Recent Note - 1/7/2021 5:33:43 PM
G - Posted a big gain today with light volume for a new all-time high. Very extended from any sound base. Its 50 DMA line ($79.51) and prior high ($74.66 on 7/23/20) define important near-term support to watch on pullbacks.
>>> FEATURED STOCK ARTICLE : Perched at High After Impressive Streak of Gains - 12/24/2020 |
View all notes |
Set NEW NOTE alert |
Company Profile |
SEC
News |
Chart |
Request a new note
C
A
S
I |
TEAM
-
NASDAQ
Atlassian Corp Plc
Comp Sftwr-Spec Enterprs
|
$235.48
|
+2.10
0.90% |
$238.00
|
799,787
45.41% of 50 DAV
50 DAV is 1,761,400
|
$250.03
-5.82%
|
10/12/2020
|
$193.77
|
PP = $199.60
|
|
MB = $209.58
|
Most Recent Note - 1/6/2021 6:08:50 PM
G - Its 50 DMA line ($217) and prior high in the $216 area define important near-term support to watch. Its Relative Strength Rating has slumped to 71, below the +80 minimum guideline for buy candidates. Earnings rose +7% on +26% sales revenues for the Sep '20 quarter versus the year ago period, below the +25% minimum earnings guideline (C criteria), raising concerns.
>>> FEATURED STOCK ARTICLE : Extended From Any Base After Streak of Gains for New Highs - 12/18/2020 |
View all notes |
Set NEW NOTE alert |
Company Profile |
SEC
News |
Chart |
Request a new note
C
A
S
I |
Symbol/Exchange
Company Name
Industry Group |
PRICE |
CHANGE
(%Change) |
Day High |
Volume
(% DAV)
(% 50 day avg vol) |
52 Wk Hi
% From Hi |
Featured
Date |
Price
Featured |
Pivot Featured |
|
Max Buy |
SHOP
-
NYSE
Shopify Inc Cl A
Computer Sftwr-Enterprse
|
$1,188.92
|
+29.39
2.53% |
$1,194.89
|
1,371,261
88.70% of 50 DAV
50 DAV is 1,546,000
|
$1,285.19
-7.49%
|
12/16/2020
|
$1,146.00
|
PP = $1,147.01
|
|
MB = $1,204.36
|
Most Recent Note - 1/7/2021 5:32:05 PM
Y - Rebounded today with higher (near average) volume, finding prompt support after briefly slumping below prior highs in the $1,146-1,130 area and falling back into the prior base raising concerns. Its 50 DMA line ($1,051) defines the next important support to watch. See the latest FSU analysis for more details and a new annotated graph.
>>> FEATURED STOCK ARTICLE : Rebounded After Undercutting Prior Highs - 1/7/2021 |
View all notes |
Set NEW NOTE alert |
Company Profile |
SEC
News |
Chart |
Request a new note
C
A
S
I |
YETI
-
NYSE
Yeti Holdings Inc
Leisure-Products
|
$73.48
|
+0.92
1.27% |
$74.35
|
513,730
42.01% of 50 DAV
50 DAV is 1,223,000
|
$74.82
-1.79%
|
11/5/2020
|
$57.25
|
PP = $55.14
|
|
MB = $57.90
|
Most Recent Note - 1/6/2021 6:11:36 PM
G - Posted a 4th consecutive gain today with below average volume. Consolidating after quietly wedging to new all-time highs with recent gains lacking great volume conviction. Its 50 DMA line ($62.84) defines initial support to watch.
>>> FEATURED STOCK ARTICLE : Pulling Back After Recently Wedging to New Highs - 12/29/2020 |
View all notes |
Set NEW NOTE alert |
Company Profile |
SEC
News |
Chart |
Request a new note
C
A
S
I |
AAXN
-
NASDAQ
Axon Enterprise Inc
Security/Sfty
|
$125.36
|
+0.79
0.63% |
$128.28
|
450,995
84.24% of 50 DAV
50 DAV is 535,400
|
$124.73
0.51%
|
12/22/2020
|
$127.84
|
PP = $130.51
|
|
MB = $137.04
|
Most Recent Note - 1/8/2021 5:34:32 PM
Y - Quietly consolidating above its 50 DMA line ($120.88). A subsequent gain and new high close above the pivot point backed by at least +40% above average volume is needed to reconfirm a new (or add-on) technical buy signal. Fundamentals remain strong.
>>> FEATURED STOCK ARTICLE : New All-Time High With Today's 5th Consecutive Gain - 12/23/2020 |
View all notes |
Set NEW NOTE alert |
Company Profile |
SEC
News |
Chart |
Request a new note
C
A
S
I |
QTWO
-
NYSE
Q2 Holdings Inc
Computer Sftwr-Financial
|
$126.27
|
+2.09
1.68% |
$127.24
|
279,708
64.26% of 50 DAV
50 DAV is 435,300
|
$130.59
-3.31%
|
11/12/2020
|
$105.14
|
PP = $106.54
|
|
MB = $111.87
|
Most Recent Note - 1/8/2021 5:31:28 PM
G - Posted a 2nd consecutive gain today on light volume while hovering near its all-time high. Its 50 DMA line ($113.77) defines important near term support to watch above the prior high in the $106 area.
>>> FEATURED STOCK ARTICLE : Stubbornly Holding Ground Extended From Prior Base - 12/31/2020 |
View all notes |
Set NEW NOTE alert |
Company Profile |
SEC
News |
Chart |
Request a new note
C
A
S
I |
|
|
|
THESE ARE NOT BUY RECOMMENDATIONS!
Comments contained in the body of this report are technical
opinions only. The material herein has been obtained
from sources believed to be reliable and accurate, however,
its accuracy and completeness cannot be guaranteed.
This site is not an investment advisor, hence it does
not endorse or recommend any securities or other investments.
Any recommendation contained in this report may not
be suitable for all investors and it is not to be deemed
an offer or solicitation on our part with respect to
the purchase or sale of any securities. All trademarks,
service marks and trade names appearing in this report
are the property of their respective owners, and are
likewise used for identification purposes only.
This report is a service available
only to active Paid Premium Members.
You may opt-out of receiving report notifications
at any time. Questions or comments may be submitted
by writing to Premium Membership Services 665 S.E. 10 Street, Suite 201 Deerfield Beach, FL 33441-5634 or by calling 1-800-965-8307
or 954-785-1121.
|
|
|