You are not logged in.
This means you
CAN ONLY VIEW reports that were published prior to Thursday, March 20, 2025.
You
MUST UPGRADE YOUR MEMBERSHIP if you want to see any current reports.
AFTER MARKET UPDATE - THURSDAY, JANUARY 7TH, 2021
Previous After Market Report Next After Market Report >>>
|
|
|
|
DOW |
+211.73 |
31,041.13 |
+0.69% |
|
Volume |
1,104,440,697 |
-21% |
|
Volume |
6,733,022,300 |
-11% |
|
NASDAQ |
+324.57 |
13,065.36 |
+2.55% |
|
Advancers |
1,912 |
61% |
|
Advancers |
2,760 |
74% |
|
S&P 500 |
+55.66 |
3,803.80 |
+1.49% |
|
Decliners |
1,204 |
39% |
|
Decliners |
958 |
26% |
|
Russell 2000 |
+38.96 |
2,096.89 |
+1.89% |
|
52 Wk Highs |
375 |
|
|
52 Wk Highs |
539 |
|
|
S&P 600 |
+14.79 |
1,199.81 |
+1.25% |
|
52 Wk Lows |
5 |
|
|
52 Wk Lows |
6 |
|
|
 |
Major Indices Rose With Positive Breadth and Greater Leadership
Kenneth J. Gruneisen - Passed the CAN SLIM® Master's Exam
The Dow jumped 211 points, while the S&P 500 rose 1.5%. The Nasdaq Composite rallied 2.6% to end above 13,000 for the first time as Tech shares staged a rebound after coming under pressure during Wednesday’s session. The volume totals were lighter than the prior session volume totals on the NYSE and on the Nasdaq exchange. Breadth was positive as advancers led decliners by more than a 3-2 margin on the NYSE and by almost a 3-1 margin on the Nasdaq exchange. There were 160 high-ranked companies from the Leaders List that hit new 52-week highs and were listed on the BreakOuts Page, versus the total of 143 on the prior session. New 52-week highs totals expanded and easily outnumbered new 52-week lows totals which were in the single digits on both exchanges. The major indices are in a confirmed uptrend (M criteria). Investors are reminded to always make buying and selling decisions based based on the strict criteria and rules of the fact-based investment system. PICTURED: The S&P Index posted a big gain for a new record high.
All three U.S. major averages closed at fresh all-time highs on Thursday, as investors focused on prospects for additional fiscal stimulus. The results of the special runoff election in Georgia revealed Democrats won both Senate seats, giving the party a majority in both chambers of Congress. Further, President Trump called for a peaceful transfer of power, following turmoil on Capitol Hill.
Economic data also boosted sentiment, with a report from the Institute for Supply Management showing activity in the U.S. services sector expanded at a faster-than-anticipated pace in December. A separate release revealed weekly initial jobless claims unexpectedly fell to 787,000 in the week ending January 2 from the prior upwardly revised 790,000 figure. Treasuries declined, with the yield on the 10-year note rising five basis points to 1.08%.
Nine of 11 S&P 500 sectors finished in positive territory, with Technology stocks pacing the gains. The Financials group was another notable advancer, as banks climbed with Treasury yields. In earnings, Constellation Brands (STZ +2.30%) rose after the company authorized a $2 billion share repurchase program following a better-than-expected earnings report. Walgreens Boots Alliance (WBA +5.18%) rose after topping Wall Street's earnings and revenue projections and reiterating its prior 2021 forecast. In other corporate news, DXC Technology (DXCT +9.30%) jumped following reports France’s Atos made a takeover offer of more than $10 billion for the IT company. |
 Kenneth J. Gruneisen started out as a licensed stockbroker in August 1987, a couple of months prior to the historic stock market crash that took the Dow Jones Industrial Average down -22.6% in a single day. He has published daily fact-based fundamental and technical analysis on high-ranked stocks online for two decades. Through FACTBASEDINVESTING.COM, Kenneth provides educational articles, news, market commentary, and other information regarding proven investment systems that work in good times and bad.
Comments contained in the body of this report are technical opinions only and are not necessarily those of Gruneisen Growth Corp. The material herein has been obtained from sources believed to be reliable and accurate, however, its accuracy and completeness cannot be guaranteed. Our firm, employees, and customers may effect transactions, including transactions contrary to any recommendation herein, or have positions in the securities mentioned herein or options with respect thereto. Any recommendation contained in this report may not be suitable for all investors and it is not to be deemed an offer or solicitation on our part with respect to the purchase or sale of any securities. |
|
 |
Tech, Financial, Retail, and Energy-Linked Groups Rose
Kenneth J. Gruneisen - Passed the CAN SLIM® Master's Exam
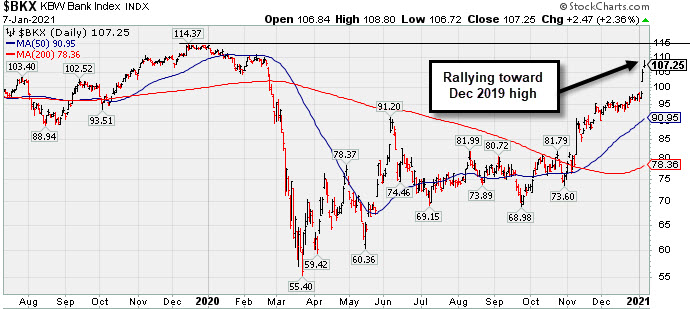
Financial shares had a positive bias as the Bank Index ($BKX +2.40%) and Broker/Dealer Index ($XBD +1.35%) posted solid gains. The Retail Index ($RLX +0.61%) edged higher. The Semiconductor Index ($SOX +3.88%) and Biotech Index ($BTK +3.32%) led the tech sector higher while the Networking Index ($NWX +1.08%) posted a smaller gain. Commodity-linked groups were mixed as the Oil Services Index ($OSX +1.78%) and Integrated Oil Index ($XOI +1.76%) both posted solid gains, meanwhile the Gold & Silver Index ($XAU -0.39%) edged lower.
PICTURED: The Bank Index ($BKX +2.40%) has been rallying toward its December 2019 high.
| Oil Services |
$OSX |
50.84 |
+0.89 |
+1.78% |
+14.68% |
| Integrated Oil |
$XOI |
873.77 |
+15.15 |
+1.76% |
+10.26% |
| Semiconductor |
$SOX |
2,937.65 |
+109.69 |
+3.88% |
+5.09% |
| Networking |
$NWX |
725.09 |
+7.76 |
+1.08% |
+1.11% |
| Broker/Dealer |
$XBD |
397.45 |
+5.28 |
+1.35% |
+5.26% |
| Retail |
$RLX |
3,547.65 |
+21.43 |
+0.61% |
-0.44% |
| Gold & Silver |
$XAU |
154.53 |
-0.60 |
-0.39% |
+7.17% |
| Bank |
$BKX |
107.29 |
+2.51 |
+2.40% |
+9.58% |
| Biotech |
$BTK |
6,009.18 |
+193.10 |
+3.32% |
+4.71% |
|
|
|
 |
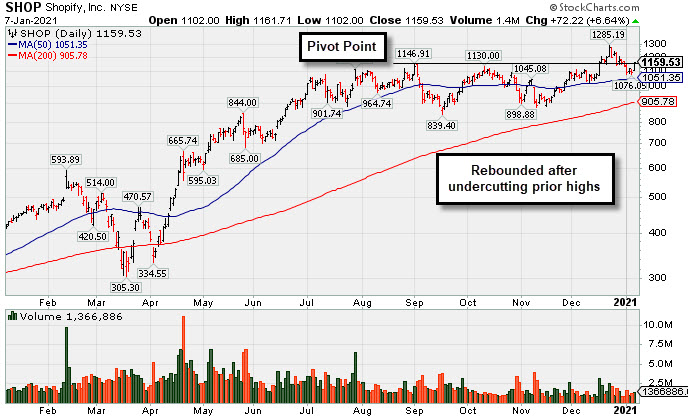
Rebounded After Undercutting Prior Highs
Kenneth J. Gruneisen - Passed the CAN SLIM® Master's Exam
Shopify Inc Cl A (SHOP +$72.22 or +6.64% to $1,159.53) rebounded today repairing a big loss on the prior session with a solid gain on higher (near average) volume. The prompt support came after a brief slump below prior highs in the $1,146-1,130 area, falling back into the prior base, raised concerns. Its recent low and its 50-day moving average (DMA) line ($1,051) define important near-term support to watch.
SHOP was highlighted in yellow with pivot point cited based on its 9/01/20 high plus 10 cents in the 12/15/20 mid-day report (read here). It was shown in greater detail that evening with an annotated graph under the headline, "Volume-Driven Gain for New High After Long Consolidation", as it hit a new all-time high with a big gain backed by +117% above average volume while rising from a 15-week base. The gain and strong close above its pivot point clinched a convincing technical buy signal.
It reported Sep '20 quarterly earnings of $1.13 per share versus a loss of 29 cents per share on +96% sales revenues versus the year ago period. The Ontario, Canada-based Computer Software - Enterprise firm's prior quarters showed big earnings increases well above the +25% minimum guideline (C criteria) with very strong underlying sales revenues growth. After years of losses it had strong earnings growth in FY '17-19 (A criteria).
The number of top-rated funds owning its shares rose from 1,151 in Sep '19 to 1,609 in Sep '20, a reassuring sign concerning the I criteria. It has a C Timeliness rating and an A Sponsorship Rating. There are 121.9 million shares outstanding (S criteria) which can contribute to greater price volatility in the event of institutional buying or selling. |
|
|
Color Codes Explained :
Y - Better candidates highlighted by our
staff of experts.
G - Previously featured
in past reports as yellow but may no longer be buyable under the
guidelines.
***Last / Change / Volume data in this table is the closing quote data***
Symbol/Exchange
Company Name
Industry Group |
PRICE |
CHANGE
(%Change) |
Day High |
Volume
(% DAV)
(% 50 day avg vol) |
52 Wk Hi
% From Hi |
Featured
Date |
Price
Featured |
Pivot Featured |
|
Max Buy |
 CRL
-
NYSE
CRL
-
NYSE
Charles River Labs Intl
DRUGS - Biotechnology
|
$263.16
|
+8.40
3.30% |
$263.37
|
337,958
111.61% of 50 DAV
50 DAV is 302,800
|
$257.88
2.05%
|
12/17/2020
|
$247.06
|
PP = $257.98
|
|
MB = $270.88
|
 Most Recent Note - 1/7/2021 5:42:03 PM
Y - Posted a 3rd consecutive gain today with near average volume hitting a new all-time high. The pivot point cited is based on its 11/09/20 high plus 10 cents. Subsequent gains above its pivot point backed by at least +40% above average volume may help clinch a proper new (or add-on) technical buy signal. Its 50 DMA line ($239) has been acting as support. Reported Sep '20 quarterly earnings +38% on +11% sales revenues versus the year ago period, above the +25% minimum earnings guideline (C criteria). See the latest FSU analysis for more details and a new annotated graph.
>>> FEATURED STOCK ARTICLE : Hovering in Tight Range Holding Ground Near High - 1/5/2021 |
View all notes |
Set NEW NOTE alert |
Company Profile |
SEC
News |
Chart |
Request a new note
C
A
S
I |
AMD
-
NASDAQ
Advanced Micro Devices
ELECTRONICS - Semiconductor - Broad Line
|
$95.16
|
+4.83
5.35% |
$95.51
|
42,401,666
92.15% of 50 DAV
50 DAV is 46,015,000
|
$97.98
-2.88%
|
11/18/2020
|
$82.54
|
PP = $88.72
|
|
MB = $93.16
|
Most Recent Note - 1/7/2021 5:35:21 PM
G - Posted a big gain today with below average volume and its color code is changed to green after rising back above its "max buy" level. Its 50 DMA line ($87.87) defines important near term support to watch on pullbacks.
>>> FEATURED STOCK ARTICLE : Pulling Back From its Record High Hit Last Week - 12/21/2020 |
View all notes |
Set NEW NOTE alert |
Company Profile |
SEC
News |
Chart |
Request a new note
C
A
S
I |
TER
-
NASDAQ
Teradyne Inc
ELECTRONICS - Semiconductor Equipment and Mate
|
$129.91
|
+7.50
6.13% |
$130.74
|
2,115,803
148.58% of 50 DAV
50 DAV is 1,424,000
|
$124.85
4.05%
|
10/21/2020
|
$92.22
|
PP = $93.54
|
|
MB = $98.22
|
Most Recent Note - 1/7/2021 5:38:10 PM
G - Powered to a new all-time high as it posted a 3rd consecutive gain today with above average volume. Support to watch on pullbacks is its 50 DMA line ($109.67).
>>> FEATURED STOCK ARTICLE : Perched Near Record High Very Extended From Any Sound Base - 12/30/2020 |
View all notes |
Set NEW NOTE alert |
Company Profile |
SEC
News |
Chart |
Request a new note
C
A
S
I |
AMRC
-
NYSE
Ameresco Inc Cl A
ENERGY - Alternative
|
$59.90
|
+4.01
7.17% |
$60.24
|
540,175
137.10% of 50 DAV
50 DAV is 394,000
|
$57.15
4.81%
|
12/15/2020
|
$46.72
|
PP = $47.10
|
|
MB = $49.46
|
Most Recent Note - 1/7/2021 5:36:20 PM
G - Powered to a new all-time high with today's 3rd consecutive volume-driven gain, getting more extended from any sound base. Prior highs in the $46-47 area define initial support to watch on pullbacks. See the latest FSU analysis for more details and an annotated graph.
>>> FEATURED STOCK ARTICLE : Very Extended From Base After Another Powerful Gain - 1/6/2021 |
View all notes |
Set NEW NOTE alert |
Company Profile |
SEC
News |
Chart |
Request a new note
C
A
S
I |
TREX
-
NYSE
Trex Company Inc
MATERIALS and CONSTRUCTION - General Building Materials
|
$90.60
|
+4.36
5.06% |
$90.74
|
766,087
100.27% of 50 DAV
50 DAV is 764,000
|
$87.88
3.10%
|
6/26/2020
|
$54.53
|
PP = $66.47
|
|
MB = $69.79
|
Most Recent Note - 1/7/2021 5:39:13 PM
G - Posted a 3rd consecutive gain today with average volume hitting a new 52-week high. Prior highs in the $80-81 area define initial support to watch above its 50 DMA line ($77.25). Recently noted that it reported Sep '20 quarterly earnings +14% on +19% sales revenues versus the year ago period, below the +25% minimum guideline (C criteria) raising fundamental concerns.
>>> FEATURED STOCK ARTICLE : Hit New High With Light Volume Behind 4th Consecutive Gain - 12/22/2020 |
View all notes |
Set NEW NOTE alert |
Company Profile |
SEC
News |
Chart |
Request a new note
C
A
S
I |
Symbol/Exchange
Company Name
Industry Group |
PRICE |
CHANGE
(%Change) |
Day High |
Volume
(% DAV)
(% 50 day avg vol) |
52 Wk Hi
% From Hi |
Featured
Date |
Price
Featured |
Pivot Featured |
|
Max Buy |
CLFD
-
NASDAQ
Clearfield Inc
TELECOMMUNICATIONS - Cables / Satalite Equipment
|
$25.83
|
+0.35
1.37% |
$26.38
|
66,743
66.08% of 50 DAV
50 DAV is 101,000
|
$28.32
-8.79%
|
11/17/2020
|
$22.06
|
PP = $26.07
|
|
MB = $27.37
|
Most Recent Note - 1/6/2021 6:06:26 PM
Y - Posted a 2nd consecutive gain with light volume today, finding prompt support at its 50 DMA line ($23.87) and at an upward trendline.
>>> FEATURED STOCK ARTICLE : Distributional Pressure While Testing Important Chart Support - 1/4/2021 |
View all notes |
Set NEW NOTE alert |
Company Profile |
SEC
News |
Chart |
Request a new note
C
A
S
I |
NOW
-
NYSE
Servicenow Inc
Computer Sftwr-Enterprse
|
$511.41
|
+4.16
0.82% |
$516.90
|
1,841,936
132.28% of 50 DAV
50 DAV is 1,392,500
|
$566.74
-9.76%
|
8/20/2020
|
$453.34
|
PP = $454.79
|
|
MB = $477.53
|
Most Recent Note - 1/6/2021 6:03:56 PM
G - Volume was above average behind today's big loss violating its 50 DMA line ($523) and triggering a technical sell signal. Only a prompt rebound above the 50 DMA line would help its outlook improve. Recently reported Sep '20 quarterly earnings +22% on +30% sales revenues versus the year ago period, below the +25% minimum guideline (C criteria) of the fact-based investment system.
>>> FEATURED STOCK ARTICLE : Hit New Record High With Light Volume Behind Gain - 12/17/2020 |
View all notes |
Set NEW NOTE alert |
Company Profile |
SEC
News |
Chart |
Request a new note
C
A
S
I |
SMPL
-
NASDAQ
Simply Good Foods Co
Food-Confectionery
|
$30.07
|
+0.01
0.03% |
$30.68
|
1,001,897
71.11% of 50 DAV
50 DAV is 1,409,000
|
$32.03
-6.12%
|
12/28/2020
|
$30.40
|
PP = $31.44
|
|
MB = $33.01
|
Most Recent Note - 1/4/2021 6:08:53 PM
Y - There was a "negative reversal" today after hitting a new all-time high. Subsequent gains above its pivot point backed by at least +40% above average volume may trigger a technical buy signal. Gapped up and rallied on recent news it was added to the S&P 600 Small Cap Index. Completed a new Pubic Offering on 10/09/19. Reported earnings +33% on +60% sales revenues for the Aug '20 quarter versus the year ago period, its 3rd consecutive quarterly comparison above the +25% minimum earnings guideline (C criteria). Annual earnings history (A criteria) has been strong.
>>> FEATURED STOCK ARTICLE : Challenging All-Time High as it Joins Small Cap Index - 12/28/2020 |
View all notes |
Set NEW NOTE alert |
Company Profile |
SEC
News |
Chart |
Request a new note
C
A
S
I |
ALRM
-
NASDAQ
Alarm.com Holdings Inc
Security/Sfty
|
$105.50
|
+5.43
5.43% |
$105.68
|
291,046
66.60% of 50 DAV
50 DAV is 437,000
|
$105.19
0.29%
|
11/6/2020
|
$71.88
|
PP = $74.76
|
|
MB = $78.50
|
Most Recent Note - 1/7/2021 5:33:43 PM
G - Posted a big gain today with light volume for a new all-time high. Very extended from any sound base. Its 50 DMA line ($79.51) and prior high ($74.66 on 7/23/20) define important near-term support to watch on pullbacks.
>>> FEATURED STOCK ARTICLE : Perched at High After Impressive Streak of Gains - 12/24/2020 |
View all notes |
Set NEW NOTE alert |
Company Profile |
SEC
News |
Chart |
Request a new note
C
A
S
I |
TEAM
-
NASDAQ
Atlassian Corp Plc
Comp Sftwr-Spec Enterprs
|
$233.38
|
+8.90
3.96% |
$233.89
|
1,309,386
74.85% of 50 DAV
50 DAV is 1,749,400
|
$250.03
-6.66%
|
10/12/2020
|
$193.77
|
PP = $199.60
|
|
MB = $209.58
|
Most Recent Note - 1/6/2021 6:08:50 PM
G - Its 50 DMA line ($217) and prior high in the $216 area define important near-term support to watch. Its Relative Strength Rating has slumped to 71, below the +80 minimum guideline for buy candidates. Earnings rose +7% on +26% sales revenues for the Sep '20 quarter versus the year ago period, below the +25% minimum earnings guideline (C criteria), raising concerns.
>>> FEATURED STOCK ARTICLE : Extended From Any Base After Streak of Gains for New Highs - 12/18/2020 |
View all notes |
Set NEW NOTE alert |
Company Profile |
SEC
News |
Chart |
Request a new note
C
A
S
I |
Symbol/Exchange
Company Name
Industry Group |
PRICE |
CHANGE
(%Change) |
Day High |
Volume
(% DAV)
(% 50 day avg vol) |
52 Wk Hi
% From Hi |
Featured
Date |
Price
Featured |
Pivot Featured |
|
Max Buy |
SHOP
-
NYSE
Shopify Inc Cl A
Computer Sftwr-Enterprse
|
$1,159.53
|
+72.22
6.64% |
$1,161.71
|
1,367,029
88.42% of 50 DAV
50 DAV is 1,546,000
|
$1,285.19
-9.78%
|
12/16/2020
|
$1,146.00
|
PP = $1,147.01
|
|
MB = $1,204.36
|
Most Recent Note - 1/7/2021 5:32:05 PM
Y - Rebounded today with higher (near average) volume, finding prompt support after briefly slumping below prior highs in the $1,146-1,130 area and falling back into the prior base raising concerns. Its 50 DMA line ($1,051) defines the next important support to watch. See the latest FSU analysis for more details and a new annotated graph.
>>> FEATURED STOCK ARTICLE : Rebounded After Undercutting Prior Highs - 1/7/2021 |
View all notes |
Set NEW NOTE alert |
Company Profile |
SEC
News |
Chart |
Request a new note
C
A
S
I |
YETI
-
NYSE
Yeti Holdings Inc
Leisure-Products
|
$72.56
|
+1.27
1.78% |
$73.93
|
828,597
67.92% of 50 DAV
50 DAV is 1,220,000
|
$74.82
-3.02%
|
11/5/2020
|
$57.25
|
PP = $55.14
|
|
MB = $57.90
|
Most Recent Note - 1/6/2021 6:11:36 PM
G - Posted a 4th consecutive gain today with below average volume. Consolidating after quietly wedging to new all-time highs with recent gains lacking great volume conviction. Its 50 DMA line ($62.84) defines initial support to watch.
>>> FEATURED STOCK ARTICLE : Pulling Back After Recently Wedging to New Highs - 12/29/2020 |
View all notes |
Set NEW NOTE alert |
Company Profile |
SEC
News |
Chart |
Request a new note
C
A
S
I |
AAXN
-
NASDAQ
Axon Enterprise Inc
Security/Sfty
|
$124.57
|
+2.88
2.37% |
$125.05
|
430,975
80.86% of 50 DAV
50 DAV is 533,000
|
$134.73
-7.54%
|
12/22/2020
|
$127.84
|
PP = $130.51
|
|
MB = $137.04
|
Most Recent Note - 1/5/2021 5:25:41 PM
Y - Color code is changed to yellow after today's big gain and prompt rebound above its 50 DMA line helped its outlook to improve. A subsequent gain and new high close above the pivot point backed by at least +40% above average volume is needed to reconfirm a new (or add-on) technical buy signal. Fundamentals remain strong.
>>> FEATURED STOCK ARTICLE : New All-Time High With Today's 5th Consecutive Gain - 12/23/2020 |
View all notes |
Set NEW NOTE alert |
Company Profile |
SEC
News |
Chart |
Request a new note
C
A
S
I |
QTWO
-
NYSE
Q2 Holdings Inc
Computer Sftwr-Financial
|
$124.18
|
+3.29
2.72% |
$124.86
|
266,746
60.35% of 50 DAV
50 DAV is 442,000
|
$130.59
-4.91%
|
11/12/2020
|
$105.14
|
PP = $106.54
|
|
MB = $111.87
|
Most Recent Note - 1/4/2021 6:19:18 PM
G - Pulled back with below average volume today, still hovering near its all-time high. Its 50 DMA line ($111.45) defines important near term support to watch above the prior high in the $106 area.
>>> FEATURED STOCK ARTICLE : Stubbornly Holding Ground Extended From Prior Base - 12/31/2020 |
View all notes |
Set NEW NOTE alert |
Company Profile |
SEC
News |
Chart |
Request a new note
C
A
S
I |
|
|
|
THESE ARE NOT BUY RECOMMENDATIONS!
Comments contained in the body of this report are technical
opinions only. The material herein has been obtained
from sources believed to be reliable and accurate, however,
its accuracy and completeness cannot be guaranteed.
This site is not an investment advisor, hence it does
not endorse or recommend any securities or other investments.
Any recommendation contained in this report may not
be suitable for all investors and it is not to be deemed
an offer or solicitation on our part with respect to
the purchase or sale of any securities. All trademarks,
service marks and trade names appearing in this report
are the property of their respective owners, and are
likewise used for identification purposes only.
This report is a service available
only to active Paid Premium Members.
You may opt-out of receiving report notifications
at any time. Questions or comments may be submitted
by writing to Premium Membership Services 665 S.E. 10 Street, Suite 201 Deerfield Beach, FL 33441-5634 or by calling 1-800-965-8307
or 954-785-1121.
|
|
|