You are not logged in.
This means you
CAN ONLY VIEW reports that were published prior to Monday, April 14, 2025.
You
MUST UPGRADE YOUR MEMBERSHIP if you want to see any current reports.
AFTER MARKET UPDATE - MONDAY, JANUARY 25TH, 2021
Previous After Market Report Next After Market Report >>>
|
|
|
|
DOW |
-36.98 |
30,960.00 |
-0.12% |
|
Volume |
1,192,878,885 |
+14% |
|
Volume |
7,119,902,800 |
+21% |
|
NASDAQ |
+92.38 |
13,635.44 |
+0.68% |
|
Advancers |
1,310 |
42% |
|
Advancers |
1,778 |
47% |
|
S&P 500 |
+13.89 |
3,855.36 |
+0.36% |
|
Decliners |
1,838 |
58% |
|
Decliners |
1,967 |
53% |
|
Russell 2000 |
-5.49 |
2,163.27 |
-0.25% |
|
52 Wk Highs |
287 |
|
|
52 Wk Highs |
500 |
|
|
S&P 600 |
+1.13 |
1,232.83 |
+0.09% |
|
52 Wk Lows |
2 |
|
|
52 Wk Lows |
7 |
|
|
 |
Major Indices Ended Mixed With a Healthy Crop of Strong Leaders
Kenneth J. Gruneisen - Passed the CAN SLIM® Master's Exam
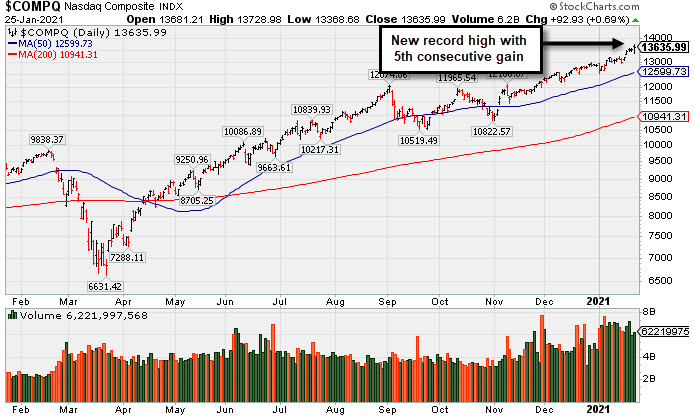
The Dow slipped 36 points, while the S&P 500 and Nasdaq Composite each closed at a new record high, climbing 0.4% and 0.7%, respectively. The volume totals were higher than the prior session on the NYSE and on the Nasdaq exchange. Decliners led advancers by a 3-2 margin on the NYSE and by a narrower margin on the Nasdaq exchange. There were 96 high-ranked companies from the Leaders List that hit new 52-week highs and were listed on the BreakOuts Page, versus the total of 52 on the prior session. New 52-week highs totals expanded and easily outnumbered the new 52-week lows totals which were in the single digits on both exchanges for a 4th consecutive session. The major indices are in a confirmed uptrend (M criteria). Investors are reminded to always make buying and selling decisions based based on the strict criteria and rules of the fact-based investment system. PICTURED: The Nasdaq Composite Index hit a new record high with its 5th consecutive gain.
Stocks ended mixed on Monday, as investors braced for a busy week of fourth-quarter earnings results. More than one-fifth of the S&P 500 index will post profit tallies this week, including mega caps Microsoft (MSFT +1.58%) and Apple (AAPL +2.77%). Meanwhile, fiscal stimulus updates garnered attention after the size of President Biden’s $1.9 trillion spending package was met with bipartisan resistance over the weekend. Negotiations on Capitol Hill are expected to resume, but the timeline for a finalized deal remains uncertain as a top Democrat lawmaker signaled a new measure may take a month at the earliest.
Market participants also monitored coronavirus related updates, with new variants of the virus raising concerns and inspiring new restrictions around the globe. On the data front, the Chicago Fed Activity Index unexpectedly improved in December, while Dallas Fed manufacturing activity posted a surprise drop in January. Treasuries advanced, with the yield on the 10-year note falling five basis points to 1.03%.
Seven of 11 S&P 500 sectors ended in positive territory, with the cyclical-oriented groups like Energy and Industrials lagging. Meanwhile, the defensive sectors Utilities and Consumer Staples paced the gains. Tech stocks also rallied, with Apple rising 2.6%. In earnings, Kimberly-Clark (KMB +3.21%) rose after the consumer products company beat Wall Street estimates on the top and bottom line. In other corporate news, GameStop (GME +18.12%) surged amid speculative retail trading, leaving the video game retailer more than 300% higher so far in 2021. |
 Kenneth J. Gruneisen started out as a licensed stockbroker in August 1987, a couple of months prior to the historic stock market crash that took the Dow Jones Industrial Average down -22.6% in a single day. He has published daily fact-based fundamental and technical analysis on high-ranked stocks online for two decades. Through FACTBASEDINVESTING.COM, Kenneth provides educational articles, news, market commentary, and other information regarding proven investment systems that work in good times and bad.
Comments contained in the body of this report are technical opinions only and are not necessarily those of Gruneisen Growth Corp. The material herein has been obtained from sources believed to be reliable and accurate, however, its accuracy and completeness cannot be guaranteed. Our firm, employees, and customers may effect transactions, including transactions contrary to any recommendation herein, or have positions in the securities mentioned herein or options with respect thereto. Any recommendation contained in this report may not be suitable for all investors and it is not to be deemed an offer or solicitation on our part with respect to the purchase or sale of any securities. |
|
 |
Tech Sector Showed Gains as Commodities and Financials Fell
Kenneth J. Gruneisen - Passed the CAN SLIM® Master's Exam
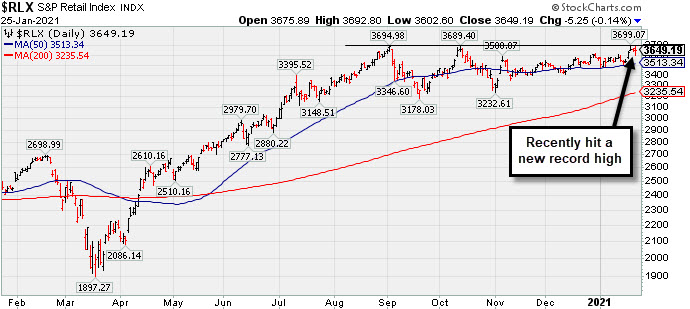
The Bank Index ($BKX -0.94%) and Broker/Dealer Index ($XBD -0.62%) outpaced the Retail Index ($RLX -0.15%) to the downside. The Biotech Index ($BTK +2.10%) led the tech sector higher while the Networking Index ($NWX +0.90%) posted a smaller gain and the Semiconductor Index ($SOX +0.21%) also edged higher. Commodity-linked groups were weak as the Oil Services Index ($OSX -3.36%), Integrated Oil Index ($XOI -1.31%), and Gold & Silver Index ($XAU -1.15%) ended unanimously lower.
PICTURED: The Retail Index ($RLX -0.15%) recently hit a new record high.
| Oil Services |
$OSX |
48.12 |
-1.67 |
-3.36% |
+8.55% |
| Integrated Oil |
$XOI |
863.44 |
-11.49 |
-1.31% |
+8.95% |
| Semiconductor |
$SOX |
3,080.99 |
+6.59 |
+0.21% |
+10.21% |
| Networking |
$NWX |
761.64 |
+6.81 |
+0.90% |
+6.21% |
| Broker/Dealer |
$XBD |
391.13 |
-2.44 |
-0.62% |
+3.58% |
| Retail |
$RLX |
3,649.19 |
-5.50 |
-0.15% |
+2.41% |
| Gold & Silver |
$XAU |
138.54 |
-1.61 |
-1.15% |
-3.92% |
| Bank |
$BKX |
102.80 |
-0.98 |
-0.94% |
+4.99% |
| Biotech |
$BTK |
6,290.56 |
+129.33 |
+2.10% |
+9.61% |
|
|
|
 |
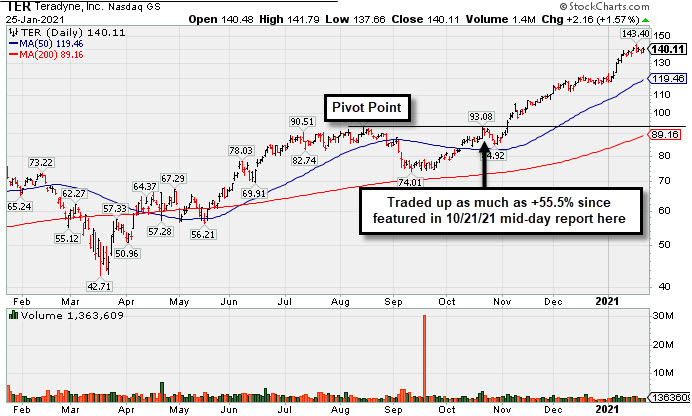
Traded +55.5% Higher in 3 Months Since Featured
Kenneth J. Gruneisen - Passed the CAN SLIM® Master's Exam
Teradyne Inc (TER +$2.16 or +1.57% to $140.11) is quietly hovering near its all-time high after today's gain backed by below average volume, very extended from any sound base. Support to watch on pullbacks is its 50-day moving average (DMA) line ($119.48).
Recently it reported earnings +53% on +41% sales revenues for the Sep '20 quarter versus the year ago period, its 4th consecutive quarterly comparison with earnings above the +25% minimum earnings guideline (C criteria). Sequential comparisons show encouraging acceleration in its sales revenues growth rate. Its annual earnings (A criteria) history has been strong.
TER has traded up as much as +55.5% since it was highlighted in yellow with pivot point cited based on its 8/14/20 high plus 10 cents in the 10/21/20 mid-day report (read here). It was last shown in this FSU section on 12/30/20 with an annotated graph under the headline, "Perched Near Record High Very Extended From Any Sound Base".
The high-ranked ELECTRONICS - Semiconductor Equipment firm has 166.1 million shares outstanding (S criteria). The number of top-rated funds owning its shares rise from 1,149 in Dec '19 to 1,565 in Sep '20, a reassuring sign concerning the I criteria. Its current Up/Down Volume ratio of 1.2 is an unbiased indication its shares have been under accumulation over the past 50 days. |
|
|
Color Codes Explained :
Y - Better candidates highlighted by our
staff of experts.
G - Previously featured
in past reports as yellow but may no longer be buyable under the
guidelines.
***Last / Change / Volume data in this table is the closing quote data***
Symbol/Exchange
Company Name
Industry Group |
PRICE |
CHANGE
(%Change) |
Day High |
Volume
(% DAV)
(% 50 day avg vol) |
52 Wk Hi
% From Hi |
Featured
Date |
Price
Featured |
Pivot Featured |
|
Max Buy |
 CRL
-
NYSE
CRL
-
NYSE
Charles River Labs Intl
DRUGS - Biotechnology
|
$273.54
|
-6.64
-2.37% |
$283.25
|
307,143
108.92% of 50 DAV
50 DAV is 282,000
|
$284.60
-3.89%
|
12/17/2020
|
$247.06
|
PP = $257.98
|
|
MB = $270.88
|
Most Recent Note - 1/21/2021 4:03:16 PM
G - Perched above its "max buy" level at its all-time high and its color code is changed to green. Its prior high ($257) defines initial support above its 50 DMA line ($247). Reported Sep '20 quarterly earnings +38% on +11% sales revenues versus the year ago period, above the +25% minimum earnings guideline (C criteria).
>>> FEATURED STOCK ARTICLE : Hovering in Tight Range Holding Ground Near High - 1/5/2021 |
View all notes |
Set NEW NOTE alert |
Company Profile |
SEC
News |
Chart |
Request a new note
C
A
S
I |
AMD
-
NYSE
Advanced Micro Devices
ELECTRONICS - Semiconductor - Broad Line
|
$94.13
|
+1.34
1.44% |
$95.74
|
54,928,322
127.73% of 50 DAV
50 DAV is 43,002,700
|
$99.23
-5.14%
|
11/18/2020
|
$82.54
|
PP = $88.72
|
|
MB = $93.16
|
Most Recent Note - 1/22/2021 4:55:58 PM
Y - Today's early gain nearly challenged its 52-week high, but it ended near the session low. Rebound above the 50 DMA line ($90.41) helped its outlook improve, however, its Relative Strength rating of 73 is still below the 80+ minimum guideline for buy candidates. Keep in mind it is due to report Dec '20 quarterly results on 1/26/21.
>>> FEATURED STOCK ARTICLE : Distributional Pressure Brings Pullback Below "Max Buy" Level - 1/13/2021 |
View all notes |
Set NEW NOTE alert |
Company Profile |
SEC
News |
Chart |
Request a new note
C
A
S
I |
TER
-
NASDAQ
Teradyne Inc
ELECTRONICS - Semiconductor Equipment and Mate
|
$140.11
|
+2.16
1.57% |
$141.79
|
1,363,609
95.76% of 50 DAV
50 DAV is 1,424,000
|
$143.40
-2.29%
|
10/21/2020
|
$92.22
|
PP = $93.54
|
|
MB = $98.22
|
 Most Recent Note - 1/25/2021 6:04:02 PM
G - Hovering near its all-time high, very extended from any sound base. Support to watch on pullbacks is its 50 DMA line ($119.48). See the latest FSU analysis for more details and a new annotated graph.
>>> FEATURED STOCK ARTICLE : Traded +55.5% Higher in 3 Months Since Featured - 1/25/2021 |
View all notes |
Set NEW NOTE alert |
Company Profile |
SEC
News |
Chart |
Request a new note
C
A
S
I |
AMRC
-
NYSE
Ameresco Inc Cl A
ENERGY - Alternative
|
$57.58
|
-1.54
-2.60% |
$60.35
|
464,315
113.80% of 50 DAV
50 DAV is 408,000
|
$63.45
-9.25%
|
12/15/2020
|
$46.72
|
PP = $47.10
|
|
MB = $49.46
|
Most Recent Note - 1/19/2021 12:08:16 PM
G - Very extended from any sound base. Its 50 DMA line ($48.26) and prior highs in the $46-47 area define important near-term support to watch on pullbacks.
>>> FEATURED STOCK ARTICLE : Very Extended From Base After Another Powerful Gain - 1/6/2021 |
View all notes |
Set NEW NOTE alert |
Company Profile |
SEC
News |
Chart |
Request a new note
C
A
S
I |
TREX
-
NYSE
Trex Company Inc
MATERIALS and CONSTRUCTION - General Building Materials
|
$98.49
|
+0.33
0.34% |
$104.35
|
1,454,256
210.76% of 50 DAV
50 DAV is 690,000
|
$98.52
-0.03%
|
6/26/2020
|
$54.53
|
PP = $66.47
|
|
MB = $69.79
|
Most Recent Note - 1/25/2021 1:10:40 PM
G - Off earlier highs after rallying for new all-time highs with 4 consecutive gains. Prior highs in the $80-81 area define important support to watch coinciding with its 50 DMA line ($81.89). Sep '20 quarterly earnings were +14% on +19% sales revenues versus the year ago period, below the +25% minimum guideline (C criteria) raising fundamental concerns.
>>> FEATURED STOCK ARTICLE : Hit New All-Time High With Gain Backed by Average Volume - 1/19/2021 |
View all notes |
Set NEW NOTE alert |
Company Profile |
SEC
News |
Chart |
Request a new note
C
A
S
I |
Symbol/Exchange
Company Name
Industry Group |
PRICE |
CHANGE
(%Change) |
Day High |
Volume
(% DAV)
(% 50 day avg vol) |
52 Wk Hi
% From Hi |
Featured
Date |
Price
Featured |
Pivot Featured |
|
Max Buy |
CLFD
-
NASDAQ
Clearfield Inc
TELECOMMUNICATIONS - Cables / Satalite Equipment
|
$35.28
|
+2.23
6.75% |
$36.77
|
352,040
338.50% of 50 DAV
50 DAV is 104,000
|
$34.65
1.82%
|
1/20/2021
|
$31.38
|
PP = $28.42
|
|
MB = $29.84
|
Most Recent Note - 1/25/2021 12:37:55 PM
G - Today's 5th consecutive volume-driven gain is adding to an impressive winning streak that includes the 1/20/21 big "breakaway gap" backed by heavy volume. Prior highs in the $28 area define initial support to watch on pullbacks. Found prompt support at its 50 DMA line ($25.50) and upward trendline when consolidating.
>>> FEATURED STOCK ARTICLE : Distributional Pressure While Testing Important Chart Support - 1/4/2021 |
View all notes |
Set NEW NOTE alert |
Company Profile |
SEC
News |
Chart |
Request a new note
C
A
S
I |
NOW
-
NYSE
Servicenow Inc
Computer Sftwr-Enterprse
|
$537.88
|
-3.21
-0.59% |
$552.82
|
1,698,442
132.73% of 50 DAV
50 DAV is 1,279,600
|
$566.74
-5.09%
|
8/20/2020
|
$453.34
|
PP = $454.79
|
|
MB = $477.53
|
Most Recent Note - 1/19/2021 5:17:43 PM
G - Today's big gain with lighter volume helped it rebound toward its 50 DMA line ($527). Subsequent gains above that important short term average are needed for its outlook to improve. Due to report Dec '20 quarterly results on 1/27/21. Fundamental concerns were raised when it reported Sep '20 quarterly earnings +22% on +30% sales revenues versus the year ago period, below the +25% minimum guideline (C criteria) of the fact-based investment system.
>>> FEATURED STOCK ARTICLE : Gain Today and Rebound Above 50-Day Moving Average Line - 1/8/2021 |
View all notes |
Set NEW NOTE alert |
Company Profile |
SEC
News |
Chart |
Request a new note
C
A
S
I |
SMPL
-
NASDAQ
Simply Good Foods Co
Food-Confectionery
|
$28.40
|
+1.00
3.65% |
$29.25
|
813,344
61.87% of 50 DAV
50 DAV is 1,314,700
|
$32.03
-11.33%
|
12/28/2020
|
$30.40
|
PP = $31.44
|
|
MB = $33.01
|
Most Recent Note - 1/25/2021 6:07:30 PM
G - Posted a big gain today with lighter than average volume. Its Relative Strength Rating is still 68, well below the 80+ minimum guideline. See the latest FSU analysis for more details and an annotated graph.
>>> FEATURED STOCK ARTICLE : Relative Strength Rating Suffered During Stalling Action - 1/21/2021 |
View all notes |
Set NEW NOTE alert |
Company Profile |
SEC
News |
Chart |
Request a new note
C
A
S
I |
ALRM
-
NASDAQ
Alarm.com Holdings Inc
Security/Sfty
|
$97.86
|
+0.86
0.89% |
$99.91
|
447,555
97.51% of 50 DAV
50 DAV is 459,000
|
$108.67
-9.95%
|
11/6/2020
|
$71.88
|
PP = $74.76
|
|
MB = $78.50
|
Most Recent Note - 1/22/2021 4:54:12 PM
G - Posted a small gain today with lighter volume. Encountered distributional pressure after a big rally. Its 50 DMA line ($87) defines important near-term support to watch.
>>> FEATURED STOCK ARTICLE : Encountered Distributional Pressure After Big Rally - 1/20/2021 |
View all notes |
Set NEW NOTE alert |
Company Profile |
SEC
News |
Chart |
Request a new note
C
A
S
I |
TEAM
-
NASDAQ
Atlassian Corp Plc
Comp Sftwr-Spec Enterprs
|
$231.08
|
-4.37
-1.86% |
$240.26
|
1,187,556
76.44% of 50 DAV
50 DAV is 1,553,600
|
$250.03
-7.58%
|
10/12/2020
|
$193.77
|
PP = $199.60
|
|
MB = $209.58
|
Most Recent Note - 1/19/2021 5:10:36 PM
G - Found support today while consolidating above its 50 DMA line ($222) and above the prior high in the $216 area which defines important near-term support to watch. However, its current Relative Strength Rating is 64, below the +80 minimum guideline for buy candidates. Earnings rose +7% on +26% sales revenues for the Sep '20 quarter versus the year ago period, below the +25% minimum earnings guideline (C criteria), raising fundamental concerns.
>>> FEATURED STOCK ARTICLE : Relative Strength Rating Remains Below 80+ Minimum Guideline - 1/11/2021 |
View all notes |
Set NEW NOTE alert |
Company Profile |
SEC
News |
Chart |
Request a new note
C
A
S
I |
Symbol/Exchange
Company Name
Industry Group |
PRICE |
CHANGE
(%Change) |
Day High |
Volume
(% DAV)
(% 50 day avg vol) |
52 Wk Hi
% From Hi |
Featured
Date |
Price
Featured |
Pivot Featured |
|
Max Buy |
SHOP
-
NYSE
Shopify Inc Cl A
Computer Sftwr-Enterprse
|
$1,205.92
|
+9.22
0.77% |
$1,247.45
|
1,485,175
112.00% of 50 DAV
50 DAV is 1,326,000
|
$1,285.19
-6.17%
|
12/16/2020
|
$1,146.00
|
PP = $1,147.01
|
|
MB = $1,204.36
|
Most Recent Note - 1/19/2021 5:07:19 PM
Y - Volume totals have still been cooling while consolidating perched near its all-time high. Found prompt support near prior highs in the $1,146-1,130 area and above its 50 DMA line ($1,079) which defines the next important support to watch.
>>> FEATURED STOCK ARTICLE : Rebounded After Undercutting Prior Highs - 1/7/2021 |
View all notes |
Set NEW NOTE alert |
Company Profile |
SEC
News |
Chart |
Request a new note
C
A
S
I |
YETI
-
NYSE
Yeti Holdings Inc
Leisure-Products
|
$70.06
|
-0.15
-0.21% |
$72.23
|
1,079,920
75.47% of 50 DAV
50 DAV is 1,431,000
|
$80.89
-13.39%
|
11/5/2020
|
$57.25
|
PP = $55.14
|
|
MB = $57.90
|
Most Recent Note - 1/22/2021 4:51:10 PM
G - Consolidating above the prior low ($67) and its 50 DMA line ($67.53) which coincide defining important near-term support to watch. Gapped down for 2 consecutive sessions following a "negative reversal" noted at its all-time high. See the latest FSU analysis for more details and a new annotated graph.
>>> FEATURED STOCK ARTICLE : 50-Day Moving Average and Prior Lows Define Near-Term Support - 1/22/2021 |
View all notes |
Set NEW NOTE alert |
Company Profile |
SEC
News |
Chart |
Request a new note
C
A
S
I |
DOCU
-
NASDAQ
Docusign Inc
Computer Sftwr-Enterprse
|
$244.40
|
-10.75
-4.21% |
$260.00
|
4,190,663
115.25% of 50 DAV
50 DAV is 3,636,000
|
$290.23
-15.79%
|
1/12/2021
|
$253.50
|
PP = $256.10
|
|
MB = $268.91
|
Most Recent Note - 1/25/2021 6:10:50 PM
Y - Suffered a big loss today with higher (near average) volume raising concerns while sputtering below the pivot point cited. Near-term support to watch is its 50 DMA line ($232) and prior low ($216.50 on 1/04/21) . Fundamentals remain strong.
>>> FEATURED STOCK ARTICLE : Twice Average Volume Behind Breakout Gain - 1/12/2021 |
View all notes |
Set NEW NOTE alert |
Company Profile |
SEC
News |
Chart |
Request a new note
C
A
S
I |
AAXN
-
NASDAQ
Axon Enterprise Inc
Security/Sfty
|
$174.54
|
+4.28
2.51% |
$177.71
|
609,095
100.68% of 50 DAV
50 DAV is 605,000
|
$171.73
1.64%
|
12/22/2020
|
$127.84
|
PP = $130.51
|
|
MB = $137.04
|
Most Recent Note - 1/25/2021 6:05:38 PM
G - Getting more extended from any sound base, it hit yet another new all-time high with today's gain on average volume. Prior high ($134) defines initial support to watch. Found prompt support near its 50 DMA line ($130) during the recent consolidation. Fundamentals remain strong.
>>> FEATURED STOCK ARTICLE : Hit New Highs With Streak of Big Volume-Driven Gains - 1/15/2021 |
View all notes |
Set NEW NOTE alert |
Company Profile |
SEC
News |
Chart |
Request a new note
C
A
S
I |
QTWO
-
NYSE
Q2 Holdings Inc
Computer Sftwr-Financial
|
$138.62
|
-1.07
-0.77% |
$142.76
|
590,897
125.99% of 50 DAV
50 DAV is 469,000
|
$139.81
-0.85%
|
11/12/2020
|
$105.14
|
PP = $106.54
|
|
MB = $111.87
|
Most Recent Note - 1/19/2021 5:19:05 PM
G - Posted a gain today on average volume for a new all-time high. Its 50 DMA line ($118) defines important near term support to watch on pullbacks.
>>> FEATURED STOCK ARTICLE : Stubbornly Holding Ground Extended From Prior Base - 12/31/2020 |
View all notes |
Set NEW NOTE alert |
Company Profile |
SEC
News |
Chart |
Request a new note
C
A
S
I |
Symbol/Exchange
Company Name
Industry Group |
PRICE |
CHANGE
(%Change) |
Day High |
Volume
(% DAV)
(% 50 day avg vol) |
52 Wk Hi
% From Hi |
Featured
Date |
Price
Featured |
Pivot Featured |
|
Max Buy |
|
|
|
THESE ARE NOT BUY RECOMMENDATIONS!
Comments contained in the body of this report are technical
opinions only. The material herein has been obtained
from sources believed to be reliable and accurate, however,
its accuracy and completeness cannot be guaranteed.
This site is not an investment advisor, hence it does
not endorse or recommend any securities or other investments.
Any recommendation contained in this report may not
be suitable for all investors and it is not to be deemed
an offer or solicitation on our part with respect to
the purchase or sale of any securities. All trademarks,
service marks and trade names appearing in this report
are the property of their respective owners, and are
likewise used for identification purposes only.
This report is a service available
only to active Paid Premium Members.
You may opt-out of receiving report notifications
at any time. Questions or comments may be submitted
by writing to Premium Membership Services 665 S.E. 10 Street, Suite 201 Deerfield Beach, FL 33441-5634 or by calling 1-800-965-8307
or 954-785-1121.
|
|
|