You are not logged in.
This means you
CAN ONLY VIEW reports that were published prior to Tuesday, April 8, 2025.
You
MUST UPGRADE YOUR MEMBERSHIP if you want to see any current reports.
AFTER MARKET UPDATE - FRIDAY, DECEMBER 11TH, 2020
Previous After Market Report Next After Market Report >>>
|
|
|
|
DOW |
+47.11 |
30,046.37 |
+0.16% |
|
Volume |
909,253,905 |
-6% |
|
Volume |
4,237,502,700 |
-5% |
|
NASDAQ |
-34.46 |
12,371.35 |
-0.28% |
|
Advancers |
1,302 |
42% |
|
Advancers |
1,487 |
41% |
|
S&P 500 |
-4.64 |
3,663.46 |
-0.13% |
|
Decliners |
1,811 |
58% |
|
Decliners |
2,162 |
59% |
|
Russell 2000 |
-11.01 |
1,911.70 |
-0.57% |
|
52 Wk Highs |
201 |
|
|
52 Wk Highs |
259 |
|
|
S&P 600 |
-8.63 |
1,086.59 |
-0.79% |
|
52 Wk Lows |
2 |
|
|
52 Wk Lows |
14 |
|
|
 |
Breadth Showed Negative Bias as Major Indices Ended Mixed
Kenneth J. Gruneisen - Passed the CAN SLIM® Master's Exam
The Dow reversed a more than 100 point decline to end 47 points higher, and pared its weekly loss to 0.6%. The S&P 500 slipped 0.1%, capping a three day losing streak and posting a 1% weekly decline. The Nasdaq Composite slipped 0.2% for the day and 0.7% for the week. Meanwhile, the small cap Russell 2000 index bucked the week’s downtrend, adding nearly 1%. The volume totals Friday were lighter than the prior session on the NYSE and on the Nasdaq exchange. Decliners led advancers by a 3-2 margin on the NYSE and on the Nasdaq exchange. There were 40 high-ranked companies from the Leaders List that hit new 52-week highs and were listed on the BreakOuts Page, versus the total of 37 on the prior session. New 52-week highs totals expanded and solidly outnumbered new 52-week lows totals on both exchanges. The major indices confirmed a new uptrend (M criteria) with recent follow-through gains backed by higher volume and more leadership. Investors are reminded to always make buying and selling decisions based based on the strict criteria and rules of the fact-based investment system. 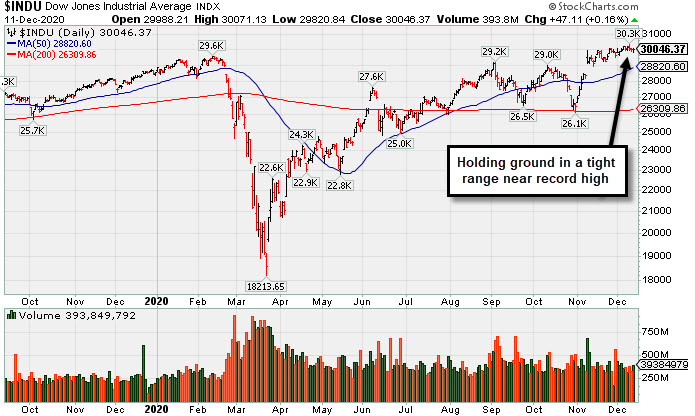 PICTURED: The Dow Jones Industrial Average has been holding its ground in a tight range near its record high.
Stocks fluctuated on Friday as investors monitored updates from Capitol Hill, and weighed worsening COVID trends against lingering vaccine optimism. Stalled progress towards a fifth coronavirus relief measure in Washington dampened sentiment, but stocks found some reprieve following news the Senate passed a one-week stopgap spending bill to advert a government shutdown.
On the data front, an update showed core producer prices (ex-food and energy) increased 1.4% year-over-year. A flash reading from the University of Michigan revealed consumer sentiment unexpectedly rose to 81.4 in December from 76.9 the prior month. Treasuries advanced, with the yield on the 10-year note falling one basis point to 0.89%. In FX trading, the British pound slid against the greenback after leaders of the EU and U.K. both warned that a no-deal Brexit was increasingly likely.
Six of 11 S&P 500 sectors ended lower, with Energy and Financials leading laggards. The Communication Services group bucked the downtrend, with Disney (DIS +13.59%) surging after providing upbeat projections for its Disney+ streaming service subscriber growth. In other corporate news, Broadcom (AVGO -1.03%) fell after issuing tepid guidance following an earnings beat. Qualcomm (QCOM -7.36%) fell amid reports Apple (AAPL -0.67%) has started building its own iPhone modems. |
 Kenneth J. Gruneisen started out as a licensed stockbroker in August 1987, a couple of months prior to the historic stock market crash that took the Dow Jones Industrial Average down -22.6% in a single day. He has published daily fact-based fundamental and technical analysis on high-ranked stocks online for two decades. Through FACTBASEDINVESTING.COM, Kenneth provides educational articles, news, market commentary, and other information regarding proven investment systems that work in good times and bad.
Comments contained in the body of this report are technical opinions only and are not necessarily those of Gruneisen Growth Corp. The material herein has been obtained from sources believed to be reliable and accurate, however, its accuracy and completeness cannot be guaranteed. Our firm, employees, and customers may effect transactions, including transactions contrary to any recommendation herein, or have positions in the securities mentioned herein or options with respect thereto. Any recommendation contained in this report may not be suitable for all investors and it is not to be deemed an offer or solicitation on our part with respect to the purchase or sale of any securities. |
|
 |
Networking and Biotech Indexes Posted Small Gains
Kenneth J. Gruneisen - Passed the CAN SLIM® Master's Exam
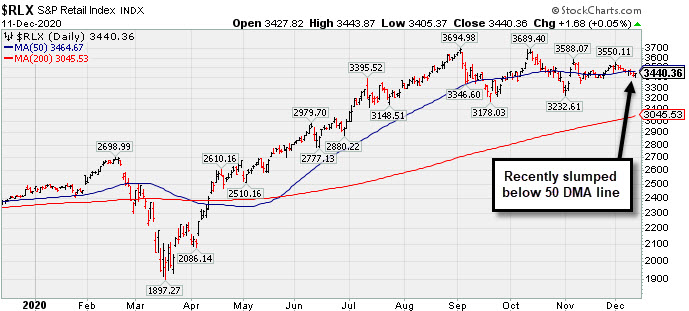
The Retail Index ($RLX +0.05%) finished flat while the Broker/Dealer Index ($XBD -0.17%) edged lower and the Bank Index ($BKX -1.36%) suffered a larger loss. The Semiconductor Index ($SOX -1.08%) ended lower while the Networking Index ($NWX +0.79%) and the Biotech Index ($BTK +0.37%) both posted modest gains. Commodity-linked groups had a negative bias as the Gold & Silver Index ($XAU -1.07%), Oil Services Index ($OSX -1.70%), and the Integrated Oil Index ($XOI -1.14%) each lost ground.
PICTURED: The Retail Index ($RLX +0.05%) recenty slumped below its 50-day moving average (DMA) line.
| Oil Services |
$OSX |
46.23 |
-0.80 |
-1.70% |
-40.94% |
| Integrated Oil |
$XOI |
838.93 |
-9.69 |
-1.14% |
-33.97% |
| Semiconductor |
$SOX |
2,704.08 |
-29.58 |
-1.08% |
+46.20% |
| Networking |
$NWX |
675.34 |
+5.29 |
+0.79% |
+15.76% |
| Broker/Dealer |
$XBD |
360.32 |
-0.61 |
-0.17% |
+24.09% |
| Retail |
$RLX |
3,440.36 |
+1.68 |
+0.05% |
+40.46% |
| Gold & Silver |
$XAU |
138.60 |
-1.50 |
-1.07% |
+29.63% |
| Bank |
$BKX |
94.19 |
-1.30 |
-1.36% |
-16.91% |
| Biotech |
$BTK |
5,542.34 |
+20.48 |
+0.37% |
+9.37% |
|
|
|
 |
Relative Strength Rating Slumped While Lingering Below 50 DMA
Kenneth J. Gruneisen - Passed the CAN SLIM® Master's Exam
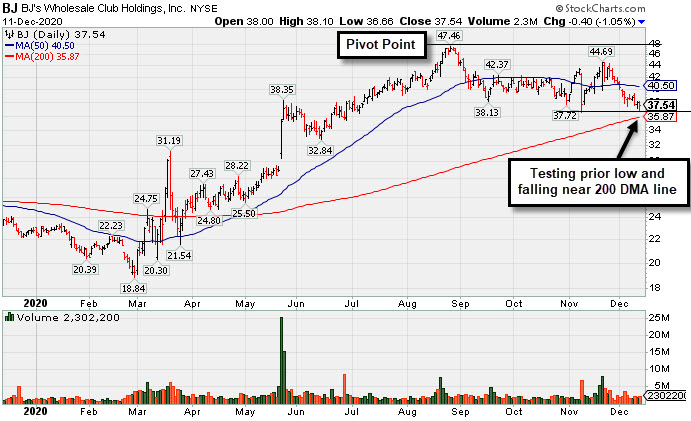
B J S Whlsl Club Hldgs (BJ -$0.40 or -1.05% to $37.54) has been sputtering below its 50-day moving average (DMA) line ($40.50). Its Relative Strength rating has slumped to 60, well below the 80+ minimum guideline for buy candidates. It will be dropped from the Featured Stocks list tonight. A rebound above the 50 DMA line is needed for its outlook to improve.
BJ failed to make progress after highlighted in yellow with pivot point cited based on its 8/26/20 high plus 10 cents in the 11/19/20 mid-day report (read here). It was shown in the FSU section that evening with an annotated graph under the headline, "Rebounding Near High With 3rd Strong Quarterly Report".
BJ reported Oct '20 quarterly results +124% on +16% sales revenues versus the year ago period, its 3rd consecutive strong quarterly comparison above the +25% minimum guideline (C criteria), helping it better match with the fundamental guidelines of the fact-based investment system. Annual earnings growth (A criteria) has been strong. The high-ranked Retail-DiscountandVariety firm completed its new IPO at $17 on 6/28/19. It has a new CEO as of 2/03/20
BJ has a fairly small supply of 137.9 million shares outstanding (S criteria). The number of top-rated funds owning its shares rose from 533 in Dec '19 to 760 in Sep '20, a reassuring sign concerning the I criteria. Its current Up/Down Volume Ratio of 1.0 is an unbiased indication its shares have been neutral concerning accumulation/distribution over the past 50 days.
|
|
|
Color Codes Explained :
Y - Better candidates highlighted by our
staff of experts.
G - Previously featured
in past reports as yellow but may no longer be buyable under the
guidelines.
***Last / Change / Volume data in this table is the closing quote data***
Symbol/Exchange
Company Name
Industry Group |
PRICE |
CHANGE
(%Change) |
Day High |
Volume
(% DAV)
(% 50 day avg vol) |
52 Wk Hi
% From Hi |
Featured
Date |
Price
Featured |
Pivot Featured |
|
Max Buy |
 CRL
-
NYSE
CRL
-
NYSE
Charles River Labs Intl
DRUGS - Biotechnology
|
$236.27
|
-3.50
-1.46% |
$239.53
|
294,928
93.63% of 50 DAV
50 DAV is 315,000
|
$257.88
-8.38%
|
7/15/2020
|
$192.66
|
PP = $189.95
|
|
MB = $199.45
|
Most Recent Note - 12/7/2020 7:02:59 PM
G - Still consolidating above its 50 DMA line ($234.72) which has been acting as support. Reported Sep '20 quarterly earnings +38% on +11% sales revenues versus the year ago period, above the +25% minimum earnings guideline (C criteria).
>>> FEATURED STOCK ARTICLE : Consolidating Near Important Support Levels - 11/23/2020 |
View all notes |
Set NEW NOTE alert |
Company Profile |
SEC
News |
Chart |
Request a new note
C
A
S
I |
AMD
-
NASDAQ
Advanced Micro Devices
ELECTRONICS - Semiconductor - Broad Line
|
$91.65
|
-0.01
-0.01% |
$92.33
|
28,173,549
57.59% of 50 DAV
50 DAV is 48,923,000
|
$96.37
-4.90%
|
11/18/2020
|
$82.54
|
PP = $88.72
|
|
MB = $93.16
|
Most Recent Note - 12/9/2020 12:45:37 PM
G - Volume totals are cooling while still stubbornly holding ground perched at its all-time high. Its 50 DMA line ($84.14) defines important near term support to watch on pulllbacks.
>>> FEATURED STOCK ARTICLE : Volume Heavy Behind AMD's Breakout from Double Bottom Base - 11/30/2020 |
View all notes |
Set NEW NOTE alert |
Company Profile |
SEC
News |
Chart |
Request a new note
C
A
S
I |
TER
-
NASDAQ
Teradyne Inc
ELECTRONICS - Semiconductor Equipment and Mate
|
$115.37
|
-0.31
-0.27% |
$116.13
|
1,130,104
74.45% of 50 DAV
50 DAV is 1,518,000
|
$118.96
-3.02%
|
10/21/2020
|
$92.22
|
PP = $93.54
|
|
MB = $98.22
|
Most Recent Note - 12/7/2020 7:08:00 PM
G - Posted a small gain today with below average volume for another new all-time high. Support to watch on pullbacks is its 50 DMA line and prior highs in the $93 area. See the latest FSU analysis for more details and a new annotated graph.
>>> FEATURED STOCK ARTICLE : Stubbornly Holding Ground and Rising for a New High - 12/7/2020 |
View all notes |
Set NEW NOTE alert |
Company Profile |
SEC
News |
Chart |
Request a new note
C
A
S
I |
TREX
-
NYSE
Trex Company Inc
MATERIALS and CONSTRUCTION - General Building Materials
|
$77.66
|
+0.12
0.15% |
$78.36
|
450,557
61.47% of 50 DAV
50 DAV is 733,000
|
$81.23
-4.39%
|
6/26/2020
|
$54.53
|
PP = $66.47
|
|
MB = $69.79
|
Most Recent Note - 12/9/2020 12:40:35 PM
G - Gapped up today and it is perched within striking distance of its 52-week high. Its 50 DMA line ($74.56) defines near-term support. Recently noted that it reported Sep '20 quarterly earnings +14% on +19% sales revenues versus the year ago period, below the +25% minimum guideline (C criteria) raising fundamental concerns.
>>> FEATURED STOCK ARTICLE : Consolidating Back Above 50-Day Moving Average Line - 12/1/2020 |
View all notes |
Set NEW NOTE alert |
Company Profile |
SEC
News |
Chart |
Request a new note
C
A
S
I |
CLFD
-
NASDAQ
Clearfield Inc
TELECOMMUNICATIONS - Cables / Satalite Equipment
|
$25.42
|
-0.21
-0.82% |
$25.87
|
38,819
41.74% of 50 DAV
50 DAV is 93,000
|
$26.54
-4.22%
|
11/17/2020
|
$22.06
|
PP = $26.07
|
|
MB = $27.37
|
Most Recent Note - 12/10/2020 5:22:57 PM
Y - Posted a gain today with below average volume challenging its 52-week high. Near term support is defined by its 50 DMA line ($22.89) and an upward trendline. A subsequent gain and close above the pivot point backed by at least +40% above average volume is needed to trigger a proper technical buy signal. See the latest FSU analysis for more details and a new annotated graph.
>>> FEATURED STOCK ARTICLE : Perched Near Pivot Point in Need of Confirming Gain on Volume - 12/10/2020 |
View all notes |
Set NEW NOTE alert |
Company Profile |
SEC
News |
Chart |
Request a new note
C
A
S
I |
Symbol/Exchange
Company Name
Industry Group |
PRICE |
CHANGE
(%Change) |
Day High |
Volume
(% DAV)
(% 50 day avg vol) |
52 Wk Hi
% From Hi |
Featured
Date |
Price
Featured |
Pivot Featured |
|
Max Buy |
NOW
-
NYSE
Servicenow Inc
Computer Sftwr-Enterprse
|
$537.36
|
-0.64
-0.12% |
$540.69
|
843,945
64.33% of 50 DAV
50 DAV is 1,312,000
|
$545.00
-1.40%
|
8/20/2020
|
$453.34
|
PP = $454.79
|
|
MB = $477.53
|
Most Recent Note - 12/7/2020 7:04:35 PM
G - Perched near ita all-time high after finding prompt support near its 50 DMA line. Recently reported Sep '20 quarterly earnings +22% on +30% sales revenues versus the year ago period, below the +25% minimum guideline (C criteria) of the fact-based investment system.
>>> FEATURED STOCK ARTICLE : Consolidating Above 50-Day Average Still Perched Near All-Time High - 11/24/2020 |
View all notes |
Set NEW NOTE alert |
Company Profile |
SEC
News |
Chart |
Request a new note
C
A
S
I |
ALRM
-
NASDAQ
Alarm.com Holdings Inc
Security/Sfty
|
$77.85
|
-1.03
-1.31% |
$78.84
|
237,338
69.60% of 50 DAV
50 DAV is 341,000
|
$80.99
-3.88%
|
11/6/2020
|
$71.88
|
PP = $74.76
|
|
MB = $78.50
|
Most Recent Note - 12/10/2020 5:29:42 PM
G - Overcame early weakness and managed a "positive reversal" today, posting a gain with light volume. Perched near its all-time high stubbornly holding its ground. Prior high ($74.66 on 7/23/20) defnes initial support to watch above its 50 DMA line.
>>> FEATURED STOCK ARTICLE : Alarm Hits a New Record High - 12/4/2020 |
View all notes |
Set NEW NOTE alert |
Company Profile |
SEC
News |
Chart |
Request a new note
C
A
S
I |
TEAM
-
NASDAQ
Atlassian Corp Plc Cl A
Comp Sftwr-Spec Enterprs
|
$232.01
|
+4.82
2.12% |
$232.24
|
1,247,989
66.35% of 50 DAV
50 DAV is 1,881,000
|
$235.17
-1.34%
|
10/12/2020
|
$193.77
|
PP = $199.60
|
|
MB = $209.58
|
 Most Recent Note - 12/11/2020 5:02:22 PM
G - Extended from any sound base, it posted another gain with below average volume today for a best-ever close. Reported earnings +7% on +26% sales revenues for the Sep '20 quarter versus the year ago period, well below the +25% minimum earnings guideline (C criteria), raising concerns.
>>> FEATURED STOCK ARTICLE : Quiet Volume Behind Gain Today for a New All-Time High - 11/27/2020 |
View all notes |
Set NEW NOTE alert |
Company Profile |
SEC
News |
Chart |
Request a new note
C
A
S
I |
YETI
-
NYSE
Yeti Holdings Inc
Leisure-Products
|
$68.26
|
-3.01
-4.22% |
$72.06
|
1,641,460
134.00% of 50 DAV
50 DAV is 1,225,000
|
$72.02
-5.22%
|
11/5/2020
|
$57.25
|
PP = $55.14
|
|
MB = $57.90
|
Most Recent Note - 12/11/2020 12:28:26 PM
G - Extended from any sound base, pulling back today after 4 consecutive gains hitting new all-time highs. Its 50 DMA line ($56.27) and prior highs in the $55-54 area define important near-term support to watch on pullbacks.
>>> FEATURED STOCK ARTICLE : Volume Totals Cooloing While Stubbornly Holding Ground at High - 12/2/2020 |
View all notes |
Set NEW NOTE alert |
Company Profile |
SEC
News |
Chart |
Request a new note
C
A
S
I |
BJ
-
NYSE
BJs Wholesale Club Hldgs
Retail-DiscountandVariety
|
$37.54
|
-0.40
-1.05% |
$38.10
|
2,301,196
100.60% of 50 DAV
50 DAV is 2,287,500
|
$47.46
-20.90%
|
11/19/2020
|
$42.97
|
PP = $47.56
|
|
MB = $49.94
|
Most Recent Note - 12/11/2020 5:01:08 PM
Sputtering near the prior low and slumping toward its 200 DMA line which may likely act as support. However, its Relative Strength rating has slumped to 60, well below the 80+ minimum guideline for buy candidtaes. It will be dropped from the Featured Stocks list. A rebound above the 50 DMA line is needed for its outlook to improve.
>>> FEATURED STOCK ARTICLE : Relative Strength Rating Slumped While Lingering Below 50 DMA - 12/11/2020 |
View all notes |
Set NEW NOTE alert |
Company Profile |
SEC
News |
Chart |
Request a new note
C
A
S
I |
Symbol/Exchange
Company Name
Industry Group |
PRICE |
CHANGE
(%Change) |
Day High |
Volume
(% DAV)
(% 50 day avg vol) |
52 Wk Hi
% From Hi |
Featured
Date |
Price
Featured |
Pivot Featured |
|
Max Buy |
AAXN
-
NASDAQ
Axon Enterprise Inc
Security/Sfty
|
$123.12
|
-2.36
-1.88% |
$127.58
|
474,354
91.22% of 50 DAV
50 DAV is 520,000
|
$130.41
-5.59%
|
11/6/2020
|
$122.75
|
PP = $113.00
|
|
MB = $118.65
|
Most Recent Note - 12/10/2020 5:25:03 PM
G - After early weakness it managed a "positive reversal" today for a gain with above average volume. Its 50 DMA line ($111.65) defines near term support to watch on pullbacks. Recently reported Sep '20 quarterly earnings +43% on +27% sales revenues versus the year ago period.
>>> FEATURED STOCK ARTICLE : Volume Totals Cooling While Hovering Near All-Time High - 12/3/2020 |
View all notes |
Set NEW NOTE alert |
Company Profile |
SEC
News |
Chart |
Request a new note
C
A
S
I |
QTWO
-
NYSE
Q2 Holdings Inc
Computer Sftwr-Financial
|
$116.86
|
+1.53
1.33% |
$117.39
|
254,441
62.36% of 50 DAV
50 DAV is 408,000
|
$119.97
-2.59%
|
11/12/2020
|
$105.14
|
PP = $106.54
|
|
MB = $111.87
|
Most Recent Note - 12/8/2020 7:16:58 PM
G - Posted a small gain today with above average volume while hovering above its "max buy" level and near its all-time high. Prior high in the $106 area and its 50 DMA line ($102) define important near term suport to watch on pullbacks. See the latest FSU analysis for more details and a new annotated graph.
>>> FEATURED STOCK ARTICLE : Computer Software - Financial Firm Hovering Near Record High - 12/8/2020 |
View all notes |
Set NEW NOTE alert |
Company Profile |
SEC
News |
Chart |
Request a new note
C
A
S
I |
|
|
|
THESE ARE NOT BUY RECOMMENDATIONS!
Comments contained in the body of this report are technical
opinions only. The material herein has been obtained
from sources believed to be reliable and accurate, however,
its accuracy and completeness cannot be guaranteed.
This site is not an investment advisor, hence it does
not endorse or recommend any securities or other investments.
Any recommendation contained in this report may not
be suitable for all investors and it is not to be deemed
an offer or solicitation on our part with respect to
the purchase or sale of any securities. All trademarks,
service marks and trade names appearing in this report
are the property of their respective owners, and are
likewise used for identification purposes only.
This report is a service available
only to active Paid Premium Members.
You may opt-out of receiving report notifications
at any time. Questions or comments may be submitted
by writing to Premium Membership Services 665 S.E. 10 Street, Suite 201 Deerfield Beach, FL 33441-5634 or by calling 1-800-965-8307
or 954-785-1121.
|
|
|