You are not logged in.
This means you
CAN ONLY VIEW reports that were published prior to Thursday, April 10, 2025.
You
MUST UPGRADE YOUR MEMBERSHIP if you want to see any current reports.
AFTER MARKET UPDATE - WEDNESDAY, DECEMBER 29TH, 2021
Previous After Market Report Next After Market Report >>>
|
|
|
|
DOW |
+90.42 |
36,488.63 |
+0.25% |
|
Volume |
608,789,438 |
+7% |
|
Volume |
3,667,773,600 |
+1% |
|
NASDAQ |
-15.51 |
15,766.22 |
-0.10% |
|
Advancers |
1,831 |
55% |
|
Advancers |
1,932 |
42% |
|
S&P 500 |
+6.71 |
4,793.06 |
+0.14% |
|
Decliners |
1,476 |
45% |
|
Decliners |
2,714 |
58% |
|
Russell 2000 |
+2.74 |
2,249.24 |
+0.12% |
|
52 Wk Highs |
157 |
|
|
52 Wk Highs |
126 |
|
|
S&P 600 |
+5.81 |
1,408.81 |
+0.41% |
|
52 Wk Lows |
89 |
|
|
52 Wk Lows |
448 |
|
|
 |
Major Indices Were Mixed as Light Volume Trading Continues
Kenneth J. Gruneisen - Passed the CAN SLIM® Master's Exam
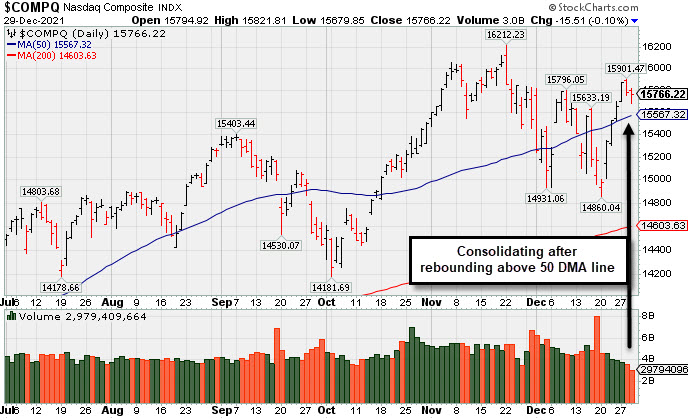
The Dow added 90 points to a fresh record, rising for a sixth consecutive session. The S&P 500 eked out a gain of 0.1% to notch its 70th all-time closing high of 2021. The broad benchmark is on track for its best quarter of the year and strongest three-year rally since 1999. The Nasdaq Composite dipped 0.1%. The volume totals reported were higher than the prior session on the NYSE and on the Nasdaq exchange. Decliners led advancers by almost 3-2 margin on the Nasdaq exchange, meanwhile advancers led decliners by a 6-5 margin on the NYSE. Leadership remained at a healthy level as there were 76 high-ranked companies from the Leaders List that hit new 52-week highs and were listed on the BreakOuts Page, versus the total of 90 on the prior session. New 52-week highs again outnumbered new 52-week lows on the NYSE, but new lows still solidly outnumbered new highs on the Nasdaq exchange. The market averages (M criteria) are in a confirmed uptrend. New buying efforts are to be carefully made under the fact-based investment system's strict criteria.
 PICTURED: The Nasdaq Composite Index is quietly consolidating after rebounding above its 50-day moving average (DMA) line.
U.S. stocks finished mostly higher on Wednesday in thin holiday trading. Positive seasonality trends associated with the final week of the year have buoyed sentiment as investors continue to assess the economic impact of the Omicron COVID-19 variant. Despite daily U.S. coronavirus cases hitting a record high, the latest strain appears milder than its predecessors, with a reduced risk of hospitalization.
Eight of 11 S&P 500 sectors closed in positive territory, with the more traditionally defensive groups, including Health Care, outperforming. Biogen (BIIB +9.46%) surged on reports that South Korea’s Samsung was engaging in talks to purchase the biotech company for over $40 billion. In other corporate news, shares of Tesla (TSLA -0.21%) edged lower despite CEO Elon Musk exercising the last round of his stock options expiring next year. Elsewhere, Victoria’s Secret (VSCO +12.19%) rose after announcing a $250 million accelerated stock buyback program.
Treasuries weakened, with the yield on the 10-year note backing up seven basis points (0.07%) to 1.55%, its highest level since before the Omicron variant was discovered in November. In commodities, WTI crude climbed 0.6% to $76.47/barrel after government data showed domestic crude stockpiles declined to the lowest level in three months. Also providing support to oil prices, a gauge of the U.S. dollar slipped 0.3%. |
 Kenneth J. Gruneisen started out as a licensed stockbroker in August 1987, a couple of months prior to the historic stock market crash that took the Dow Jones Industrial Average down -22.6% in a single day. He has published daily fact-based fundamental and technical analysis on high-ranked stocks online for two decades. Through FACTBASEDINVESTING.COM, Kenneth provides educational articles, news, market commentary, and other information regarding proven investment systems that work in good times and bad.
Comments contained in the body of this report are technical opinions only and are not necessarily those of Gruneisen Growth Corp. The material herein has been obtained from sources believed to be reliable and accurate, however, its accuracy and completeness cannot be guaranteed. Our firm, employees, and customers may effect transactions, including transactions contrary to any recommendation herein, or have positions in the securities mentioned herein or options with respect thereto. Any recommendation contained in this report may not be suitable for all investors and it is not to be deemed an offer or solicitation on our part with respect to the purchase or sale of any securities. |
|
 |
Tech Sector Rose and Retail Index Posted a Small Gain
Kenneth J. Gruneisen - Passed the CAN SLIM® Master's Exam
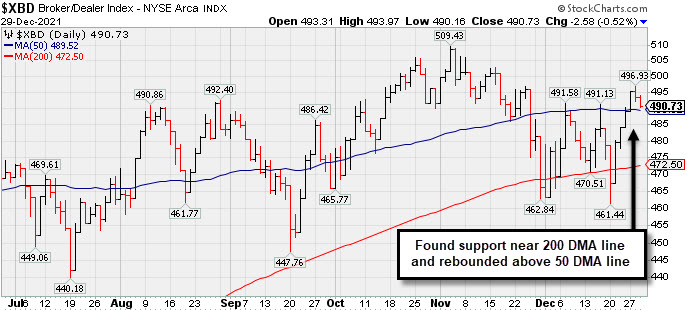
The Retail Index ($RLX +0.11%) eked out a tiny gain while the Bank Index ($BKX -0.01%) finished flat and the Broker/Dealer Index ($XBD -0.52%) edged lower. The tech sector had a slight positive bias as the Networking Index ($NWX +0.67%), Semiconductor Index ($SOX +0.18%), and Biotech Index ($BTK +0.27%) each posted a small gain. Commodity-linked groups had a negative bias as the Oil Services Index ($OSX -1.37%), Integrated Oil Index ($XOI -0.68%), and Gold & Silver Index ($XAU -0.45%) ended lower. PICTURED: The Broker/Dealer Index ($XBD -0.52%) recently found support near its 200-day moving average (DMA) line and rebounded above its 50 DMA line, helping its technical stance and outlook improve.
| Oil Services |
$OSX |
52.88 |
-0.73 |
-1.37% |
+19.28% |
| Integrated Oil |
$XOI |
1,185.57 |
-8.07 |
-0.68% |
+49.60% |
| Semiconductor |
$SOX |
3,999.35 |
+7.16 |
+0.18% |
+43.06% |
| Networking |
$NWX |
984.85 |
+6.59 |
+0.67% |
+37.33% |
| Broker/Dealer |
$XBD |
490.73 |
-2.58 |
-0.52% |
+29.96% |
| Retail |
$RLX |
4,245.92 |
+4.60 |
+0.11% |
+19.16% |
| Gold & Silver |
$XAU |
129.66 |
-0.59 |
-0.45% |
-10.08% |
| Bank |
$BKX |
132.77 |
-0.02 |
-0.01% |
+35.60% |
| Biotech |
$BTK |
5,557.53 |
+14.77 |
+0.27% |
-3.16% |
|
|
|
 |
Consolidating Above its 50-Day Moving Average Line
Kenneth J. Gruneisen - Passed the CAN SLIM® Master's Exam
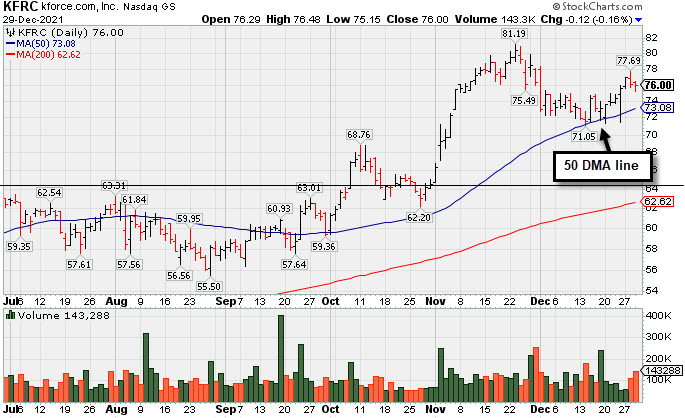
Kforce Inc (KFRC -$0.12 or -0.16% to $76.00) is consolidating above its 50-day moving average (DMA) line ($73.08) and prior low ($71.05 on 12/14/21) which define important near-term support levels to watch. Recently it reported Sep '21 quarterly earnings +8% on +10% sales revenues versus the year ago period, below the +25% minimum earnings guideline (C criteria), raising fundamental concerns. Its Earnings Per Share Rating is currently 89 and remains above the 80+ minimum guideline for buy candidates. Earnings rose in the 4 prior quarterly comparisons by more than the +25% minimum earnings guideline (C criteria). Annual earnings (A criteria) growth has been steady.
KFRC traded up as much as +36.9% since highlighted in yellow with pivot point cited based on its 6/02/21 high plus 10 cents in the 9/10/21 mid-day report (read here). It slumped but found support at its 50 DMA line since last shown in this FSU section in greater detail with an annotated graph in the FSU section on 11/19/21 under the headline, "Extended From Base and Latest Quarter Earnings Growth Sub Par".
KFRC hails from the Comml Svcs-Staffing group which is currently ranked 50th on the 197 Industry Groups list (L criteria). It has 21.4 million shares outstanding (S criteria) which can contribute to greater price volatility in the event of institutional buying or selling. The number of top-rated funds owning its shares rose from 370 in Sep '20 to 434 in Sep '21, a reassuring sign concerning the I criteria. Its current Up/Down Volume Ratio of 1.8 is an unbiased indication its shares have been under slight accumulation over the past 50 days. It has a Timeliness Rating of B and Sponsorship Rating of C.
|
|
|
Color Codes Explained :
Y - Better candidates highlighted by our
staff of experts.
G - Previously featured
in past reports as yellow but may no longer be buyable under the
guidelines.
***Last / Change / Volume data in this table is the closing quote data***
Symbol/Exchange
Company Name
Industry Group |
PRICE |
CHANGE
(%Change) |
Day High |
Volume
(% DAV)
(% 50 day avg vol) |
52 Wk Hi
% From Hi |
Featured
Date |
Price
Featured |
Pivot Featured |
|
Max Buy |
 BLDR
-
NYSE
BLDR
-
NYSE
Builders Firstsource Inc
Bldg-Constr Prds/Misc
|
$85.05
|
+0.59
0.70% |
$85.30
|
2,321,631
90.48% of 50 DAV
50 DAV is 2,566,000
|
$85.08
-0.04%
|
8/12/2021
|
$52.38
|
PP = $54.09
|
|
MB = $56.79
|
Most Recent Note - 12/27/2021 5:27:27 PM
G - Posted a 4th consecutive gain today with near average volume and hit another new all-time high. Very extended from any sound base. Reported Sep '21 quarterly earnings +308% on +140% sales revenues versus the year ago period. It is well above its 50 DMA line ($69) defines near-term support to watch.
>>> FEATURED STOCK ARTICLE : Perched at Record High After +52% Rally in 4 Months - 12/10/2021 |
View all notes |
Set NEW NOTE alert |
Company Profile |
SEC
News |
Chart |
Request a new note
C
A
S
I |
KFRC
-
NASDAQ
Kforce Inc
Comml Svcs-Staffing
|
$76.00
|
-0.12
-0.16% |
$76.48
|
143,441
129.23% of 50 DAV
50 DAV is 111,000
|
$81.47
-6.71%
|
9/10/2021
|
$59.53
|
PP = $64.48
|
|
MB = $67.70
|
 Most Recent Note - 12/29/2021 4:50:27 PM
G - Consolidating above its 50 DMA line ($73.27) and prior low ($71.05 on 12/14/21) which define important near-term support levels to watch. Recently reported Sep '21 quarterly earnings +8% on +10% sales revenues versus the year ago period, below the +25% minimum earnings guideline (C criteria), raising fundamental concerns. See the latest FSU analysis for more details and a new annotated graph.
>>> FEATURED STOCK ARTICLE : Consolidating Above its 50-Day Moving Average Line - 12/29/2021 |
View all notes |
Set NEW NOTE alert |
Company Profile |
SEC
News |
Chart |
Request a new note
C
A
S
I |
REGN
-
NASDAQ
Regeneron Pharmaceutical
DRUGS - Biotechnology
|
$647.28
|
+8.82
1.38% |
$649.00
|
410,602
52.17% of 50 DAV
50 DAV is 787,000
|
$686.62
-5.73%
|
12/13/2021
|
$647.95
|
PP = $686.72
|
|
MB = $721.06
|
Most Recent Note - 12/29/2021 3:47:19 PM
Y - Posting its 6th consecutive gain today with below average volume, yet recently rebounding above its 50 DMA line ($629) helping its technical stance and outlook improve. Color code was recently changed to yellow with new pivot point cited based on its 9/01/21 high plus 10 cents. Subsequent gains above the pivot point backed by at least +40% above average volume may trigger a technical buy signal. Its Relative Strength rating has slumped to 86, right at the 80+ minimum guideline for buy candidates.
>>> FEATURED STOCK ARTICLE : Consolidating Near All-Time High With Little Resistance Remaining - 12/13/2021 |
View all notes |
Set NEW NOTE alert |
Company Profile |
SEC
News |
Chart |
Request a new note
C
A
S
I |
LLY
-
NYSE
Eli Lilly & Co
Medical-Diversified
|
$278.42
|
+1.99
0.72% |
$279.36
|
1,097,177
34.60% of 50 DAV
50 DAV is 3,171,000
|
$283.91
-1.93%
|
12/16/2021
|
$279.28
|
PP = $275.97
|
|
MB = $289.77
|
Most Recent Note - 12/29/2021 3:58:53 PM
Y - Showed resilience after a pullback and volume totals have been cooling while it remains perched near its all-time high. Recent low ($260) defines initial support to watch above its 50 DMA line ($257.49)
>>> FEATURED STOCK ARTICLE : Eli Lilly & Co Powered to New Highs With Volume - 12/16/2021 |
View all notes |
Set NEW NOTE alert |
Company Profile |
SEC
News |
Chart |
Request a new note
C
A
S
I |
CAMT
-
NASDAQ
Camtek Ltd
ELECTRONICS - Scientific and Technical Instrum
|
$45.98
|
+1.01
2.25% |
$46.35
|
115,872
43.89% of 50 DAV
50 DAV is 264,000
|
$49.60
-7.30%
|
11/9/2021
|
$45.43
|
PP = $46.11
|
|
MB = $48.42
|
Most Recent Note - 12/29/2021 4:08:36 PM
G - Posted a gain today with light volume, consolidating above its 50 DMA line ($43.32). Faces little resistance due to overhead supply up to the $49 level. Fundamentals remain strong.
>>> FEATURED STOCK ARTICLE : Closed Above 50-Day Average After Big Gain With Light Volume - 12/15/2021 |
View all notes |
Set NEW NOTE alert |
Company Profile |
SEC
News |
Chart |
Request a new note
C
A
S
I |
Symbol/Exchange
Company Name
Industry Group |
PRICE |
CHANGE
(%Change) |
Day High |
Volume
(% DAV)
(% 50 day avg vol) |
52 Wk Hi
% From Hi |
Featured
Date |
Price
Featured |
Pivot Featured |
|
Max Buy |
AMD
-
NASDAQ
Advanced Micro Devices
ELECTRONICS - Semiconductor - Broad Line
|
$148.26
|
-4.89
-3.19% |
$154.34
|
51,104,576
87.92% of 50 DAV
50 DAV is 58,123,000
|
$164.46
-9.85%
|
10/27/2021
|
$124.91
|
PP = $122.59
|
|
MB = $128.72
|
Most Recent Note - 12/29/2021 4:06:28 PM
G - Pulled back today for a 2nd consecutive loss with below average volume. It has not formed a sound base of sufficient length but its 50 DMA line ($140.69) recently acted as support. Any violation may trigger a technical sell signal. Fundamentals remain strong after it reported Sep '21 quarterly earnings +78% on +54% sales revenues versus the year ago period.
>>> FEATURED STOCK ARTICLE : AMD Pulling Back After Considerable Rally - 12/1/2021 |
View all notes |
Set NEW NOTE alert |
Company Profile |
SEC
News |
Chart |
Request a new note
C
A
S
I |
UMC
-
NYSE
United Microelectrnc Adr
ELECTRONICS - Semiconductor - Integrated Cir
|
$11.70
|
+0.01
0.09% |
$11.78
|
3,177,734
40.62% of 50 DAV
50 DAV is 7,823,000
|
$12.68
-7.73%
|
12/1/2021
|
$12.60
|
PP = $12.72
|
|
MB = $13.36
|
Most Recent Note - 12/28/2021 6:18:43 PM
Y - Still perched within striking distance of its all-time high after recently retesting support near its 50 DMA line ($11.20). More damaging losses would raise concerns. A gain and solid close above the pivot point may help clinch a proper new (or add-on) technical buy signal. Reported Sep '21 quarterly earnings +100% on +30% sales revenues versus the year ago period.
>>> FEATURED STOCK ARTICLE : Rebound Above 50-Day Moving Average Showed Resilience - 11/30/2021 |
View all notes |
Set NEW NOTE alert |
Company Profile |
SEC
News |
Chart |
Request a new note
C
A
S
I |
ENTG
-
NASDAQ
Entegris Inc
ELECTRONICS - Semiconductor Equipment and Mate
|
$138.90
|
-0.61
-0.44% |
$140.83
|
658,325
55.70% of 50 DAV
50 DAV is 1,182,000
|
$158.00
-12.09%
|
8/4/2021
|
$125.33
|
PP = $126.51
|
|
MB = $132.84
|
Most Recent Note - 12/27/2021 5:20:01 PM
G - Posted a 4th consecutive gain today with below average volume after damaging volume-driven losses. A rebound above the 50 DMA line ($143.45) is needed for its outlook to improve. Fundamentals remain strong after it recently reported Sep '21 quarterly earnings +37% on +20% sales revenues versus the year ago period.
>>> FEATURED STOCK ARTICLE : Best Ever Close After Volume-Driven Gain - 11/29/2021 |
View all notes |
Set NEW NOTE alert |
Company Profile |
SEC
News |
Chart |
Request a new note
C
A
S
I |
DHR
-
NYSE
Danaher Corp
Medical-Diversified
|
$326.58
|
+3.35
1.04% |
$327.67
|
1,675,730
64.58% of 50 DAV
50 DAV is 2,595,000
|
$333.96
-2.21%
|
12/16/2021
|
$321.36
|
PP = $334.06
|
|
MB = $350.76
|
Most Recent Note - 12/29/2021 3:41:14 PM
Y - Volume totals have been cooling while consolidating well above its 50 DMA line ($312.51) and still perched within striking distance of its 52-week high. Highlighted in yellow with pivot point cited base on its 9/10/21 high plus 10 cents in the 12/16/21 mid-day report. Subsequent gains above the pivot point with at least +40% above average volume may trigger a technical buy signal. Fundamentals remain strong.
>>> FEATURED STOCK ARTICLE : Consolidating Near Prior Highs Above 50-Day Moving Average - 12/17/2021 |
View all notes |
Set NEW NOTE alert |
Company Profile |
SEC
News |
Chart |
Request a new note
C
A
S
I |
SKY
-
NYSE
Skyline Champion Corp
Bldg-Mobile/Mfg andamp; RV
|
$79.97
|
+0.73
0.92% |
$80.15
|
223,715
45.56% of 50 DAV
50 DAV is 491,000
|
$85.92
-6.93%
|
11/3/2021
|
$72.19
|
PP = $66.92
|
|
MB = $70.27
|
Most Recent Note - 12/27/2021 5:18:57 PM
G - It has not formed a sound new base after a streak of damaging losses. Below average volume was behind today's 4th consecutive gain as it rebounded further above the 50 DMA line ($74). Fundamentals remain strong.
>>> FEATURED STOCK ARTICLE : Pulling Back From All-Time High After Recent Rally - 12/14/2021 |
View all notes |
Set NEW NOTE alert |
Company Profile |
SEC
News |
Chart |
Request a new note
C
A
S
I |
Symbol/Exchange
Company Name
Industry Group |
PRICE |
CHANGE
(%Change) |
Day High |
Volume
(% DAV)
(% 50 day avg vol) |
52 Wk Hi
% From Hi |
Featured
Date |
Price
Featured |
Pivot Featured |
|
Max Buy |
DHI
-
NYSE
D R Horton Inc
MATERIALS and CONSTRUCTION - Residential Construction
|
$108.36
|
+1.41
1.32% |
$108.83
|
1,215,527
43.04% of 50 DAV
50 DAV is 2,824,000
|
$110.45
-1.89%
|
12/6/2021
|
$104.40
|
PP = $106.99
|
|
MB = $112.34
|
Most Recent Note - 12/27/2021 12:21:38 PM
Y - Volume totals have been cooling while hovering near its all-time high. Showed stalling action since highlighted in yellow with pivot point cited based on its 5/10/21 high plus 10 cents in the 12/06/21 mid-day report. Reported Sep '21 earnings +68% on +27% sales revenues versus the year-ago period, its 8th strong quarterly comparison above the +25% minimum guideline (C criteria). Annual earnings growth (A criteria) has been strong.
>>> FEATURED STOCK ARTICLE : Builder Built a Solid Base And Challenged Prior High - 12/6/2021 |
View all notes |
Set NEW NOTE alert |
Company Profile |
SEC
News |
Chart |
Request a new note
C
A
S
I |
TITN
-
NASDAQ
Titan Machinery Inc
SPECIALTY RETAIL
|
$33.79
|
+0.21
0.63% |
$34.16
|
176,715
100.41% of 50 DAV
50 DAV is 176,000
|
$38.58
-12.42%
|
11/23/2021
|
$36.22
|
PP = $35.34
|
|
MB = $37.11
|
Most Recent Note - 12/29/2021 3:53:11 PM
G - Posting a 6th consecutive gain today with near average volume. Found prompt support near its 50 DMA line ($31.95) but it has not formed a sound base and faces resistance due to overhead supply up to the $38 level. Reported Oct '21 quarterly earnings +81% on +26% sales revenues over the year ago period, its 4th strong quarterly comparison.
>>> FEATURED STOCK ARTICLE : Strong Close With Gain Backed by +467% Above Average Volume - 11/23/2021 |
View all notes |
Set NEW NOTE alert |
Company Profile |
SEC
News |
Chart |
Request a new note
C
A
S
I |
CLFD
-
NASDAQ
Clearfield Inc
TELECOMMUNICATIONS - Cables / Satalite Equipment
|
$84.09
|
+1.19
1.44% |
$86.17
|
165,200
113.93% of 50 DAV
50 DAV is 145,000
|
$85.72
-1.90%
|
12/16/2021
|
$72.76
|
PP = $72.10
|
|
MB = $75.71
|
Most Recent Note - 12/28/2021 12:13:25 PM
G - Reversed into the red after hitting yet another new all-time high with today's early gain, getting very extended beyond its "max buy" level. Prior high ($72) defines initial support to watch on pullbacks. Reported Sep '21 quarterly earnings +141% on +66% sales revenues above the year ago period.
>>> FEATURED STOCK ARTICLE : Perched Near High Extended From Any Sound Base - 11/22/2021 |
View all notes |
Set NEW NOTE alert |
Company Profile |
SEC
News |
Chart |
Request a new note
C
A
S
I |
ODFL
-
NASDAQ
Old Dominion Fght Line
TRANSPORTATION - Trucking
|
$360.81
|
+4.17
1.17% |
$361.67
|
262,565
42.90% of 50 DAV
50 DAV is 612,000
|
$373.58
-3.42%
|
12/7/2021
|
$365.61
|
PP = $364.17
|
|
MB = $382.38
|
Most Recent Note - 12/29/2021 4:01:37 PM
Y - Posted a 6th consecutive small gain today with light volume after finding prompt support near its 50 DMA line ($347.53). Faces very little near term resistance up to the $373 level..
>>> FEATURED STOCK ARTICLE : Perched at All Time High After Tight Consolidation Several Weeks - 12/7/2021 |
View all notes |
Set NEW NOTE alert |
Company Profile |
SEC
News |
Chart |
Request a new note
C
A
S
I |
POOL
-
NASDAQ
Pool Corp
WHOLESALE - Basic Materials Wholesale
|
$567.63
|
+6.42
1.14% |
$569.00
|
180,548
73.39% of 50 DAV
50 DAV is 246,000
|
$582.27
-2.51%
|
12/27/2021
|
$555.44
|
PP = $582.37
|
|
MB = $611.49
|
Most Recent Note - 12/28/2021 12:25:11 PM
Y - Color code was changed to yellow with new pivot point cited based on its 11/19/21 high plus 10 cents. Subsequent gains above the pivot point backed by at least +40% above average volume may trigger a new technical buy signal. Reported strong Sep '21 quarterly results and found support at its 50 DMA line ($539) during the recent consolidation. Showed resilience since dropped from the Featured Stocks list on 10/04/21.
>>> FEATURED STOCK ARTICLE : Forming New Base After Finding Prompt Support at 50 DMA - 12/27/2021 |
View all notes |
Set NEW NOTE alert |
Company Profile |
SEC
News |
Chart |
Request a new note
C
A
S
I |
Symbol/Exchange
Company Name
Industry Group |
PRICE |
CHANGE
(%Change) |
Day High |
Volume
(% DAV)
(% 50 day avg vol) |
52 Wk Hi
% From Hi |
Featured
Date |
Price
Featured |
Pivot Featured |
|
Max Buy |
SMPL
-
NASDAQ
Simply Good Foods Co
Food-Confectionery
|
$41.81
|
+0.46
1.11% |
$42.37
|
382,996
86.46% of 50 DAV
50 DAV is 443,000
|
$42.09
-0.67%
|
12/22/2021
|
$40.04
|
PP = $41.45
|
|
MB = $43.52
|
Most Recent Note - 12/29/2021 3:52:13 PM
Y - Inching into new high territory with today's 6th consecutive small gain lacking great volume conviction. Color code was recently changed to yellow with new pivot point cited based on its 11/08/21 high plus 10 cents. Gains above a stock's pivot point must be backed by at least +40% above average volume to trigger a proper technical buy signal. Its 50 DMA line ($38.74) defines important near-term support to watch on pullbacks.
>>> FEATURED STOCK ARTICLE : Formed New 5-Week Base and Perched Near Pivot Point - 12/22/2021 |
View all notes |
Set NEW NOTE alert |
Company Profile |
SEC
News |
Chart |
Request a new note
C
A
S
I |
WDAY
-
NYSE
Workday Inc Cl A
Computer Sftwr-Enterprse
|
$275.75
|
-0.05
-0.02% |
$276.12
|
757,369
47.77% of 50 DAV
50 DAV is 1,585,400
|
$307.81
-10.42%
|
9/7/2021
|
$275.69
|
PP = $282.87
|
|
MB = $297.01
|
Most Recent Note - 12/29/2021 4:03:53 PM
G - Its current Relative Strength Rating is 77, still the 80+ minimum guideline for buy candidates. Still lingering below its 50 DMA line ($282) which has acted as resistance. A rebound above the 50 DMA line is needed for its outlook to improve. Prior low ($258.22 on 12/06/21) and 200 DMA line ($254.85) define the next important support to watch. Reported Oct '21 quarterly earnings +28% on +20% sales revenues versus the year ago period. Fundamentals remain strong.
>>> FEATURED STOCK ARTICLE : Relative Strength Rating Fell While Sputtering Below 50 DMA Line - 12/23/2021 |
View all notes |
Set NEW NOTE alert |
Company Profile |
SEC
News |
Chart |
Request a new note
C
A
S
I |
TTD
-
NASDAQ
The Trade Desk Inc Cl A
Comml Svcs-Advertising
|
$92.57
|
-2.22
-2.34% |
$94.55
|
2,082,642
38.89% of 50 DAV
50 DAV is 5,355,000
|
$114.09
-18.86%
|
11/9/2021
|
$95.16
|
PP = $90.00
|
|
MB = $94.50
|
Most Recent Note - 12/29/2021 3:54:48 PM
G - Consolidating above the prior high ($90) and finding prompt support near its 50 DMA line ($91). Recent resilience has helped its outlook improve, but it faces resistance due to overhead supply up to the $114 level.
>>> FEATURED STOCK ARTICLE : Quietly Slumping Into Prior Base and Below 50-Day Moving Average - 12/20/2021 |
View all notes |
Set NEW NOTE alert |
Company Profile |
SEC
News |
Chart |
Request a new note
C
A
S
I |
MEDP
-
NASDAQ
Medpace Holdings Inc
Medical-Research Eqp/Svc
|
$220.47
|
+2.17
0.99% |
$221.23
|
77,725
44.41% of 50 DAV
50 DAV is 175,000
|
$231.00
-4.56%
|
9/10/2021
|
$196.32
|
PP = $196.22
|
|
MB = $206.03
|
Most Recent Note - 12/28/2021 6:14:57 PM
G - Pulled back today after rebounding near the prior high. Found support near its 50 DMA line ($213.30) recently, and prior highs in the $199 area also define important near-term support to watch. More damaging losses may trigger a worrisome technical sell signal. See the latest FSU analysis for more details and a new annotated graph. Recently noted repeatedly - "Sep '21 earnings rose +18% on +28% sales revenues versus the year ago period, below the +25% minimum earnings guideline (C criteria), raising fundamental concerns.
>>> FEATURED STOCK ARTICLE : Pulling Back After Rebounding Near High - 12/28/2021 |
View all notes |
Set NEW NOTE alert |
Company Profile |
SEC
News |
Chart |
Request a new note
C
A
S
I |
AVTR
-
NYSE
Avantor Inc
Medical-Research Eqp/Svc
|
$41.74
|
+0.40
0.97% |
$41.84
|
1,316,457
34.48% of 50 DAV
50 DAV is 3,818,000
|
$44.37
-5.93%
|
12/27/2021
|
$41.96
|
PP = $44.47
|
|
MB = $46.69
|
Most Recent Note - 12/27/2021 5:26:44 PM
Y - Color code is changed to yellow with new pivot point cited based on its 9/23/21 high plus 10 cents. Posted a 4th consecutive gain today with lighter volume. Consolidating above its 50 DMA line ($39.16) and it faces little overhead supply up to the $44 level. Subsequent gains above the pivot point backed by at least +40% above average volume may trigger a new technical buy signal. Prior lows in the high $36 area define important near-term support. Reported Sep '21 quarterly earnings +46% above the year ago period.
>>> FEATURED STOCK ARTICLE : Rebounding With Volume-Driven Gains - 12/21/2021 |
View all notes |
Set NEW NOTE alert |
Company Profile |
SEC
News |
Chart |
Request a new note
C
A
S
I |
Symbol/Exchange
Company Name
Industry Group |
PRICE |
CHANGE
(%Change) |
Day High |
Volume
(% DAV)
(% 50 day avg vol) |
52 Wk Hi
% From Hi |
Featured
Date |
Price
Featured |
Pivot Featured |
|
Max Buy |
|
|
|
THESE ARE NOT BUY RECOMMENDATIONS!
Comments contained in the body of this report are technical
opinions only. The material herein has been obtained
from sources believed to be reliable and accurate, however,
its accuracy and completeness cannot be guaranteed.
This site is not an investment advisor, hence it does
not endorse or recommend any securities or other investments.
Any recommendation contained in this report may not
be suitable for all investors and it is not to be deemed
an offer or solicitation on our part with respect to
the purchase or sale of any securities. All trademarks,
service marks and trade names appearing in this report
are the property of their respective owners, and are
likewise used for identification purposes only.
This report is a service available
only to active Paid Premium Members.
You may opt-out of receiving report notifications
at any time. Questions or comments may be submitted
by writing to Premium Membership Services 665 S.E. 10 Street, Suite 201 Deerfield Beach, FL 33441-5634 or by calling 1-800-965-8307
or 954-785-1121.
|
|
|