You are not logged in.
This means you
CAN ONLY VIEW reports that were published prior to Friday, April 18, 2025.
You
MUST UPGRADE YOUR MEMBERSHIP if you want to see any current reports.
AFTER MARKET UPDATE - TUESDAY, DECEMBER 28TH, 2021
Previous After Market Report Next After Market Report >>>
|
|
|
|
DOW |
+95.83 |
36,398.21 |
+0.26% |
|
Volume |
568,443,823 |
-8% |
|
Volume |
3,626,721,900 |
-2% |
|
NASDAQ |
-89.54 |
15,781.72 |
-0.56% |
|
Advancers |
1,529 |
47% |
|
Advancers |
1,610 |
35% |
|
S&P 500 |
-4.84 |
4,786.35 |
-0.10% |
|
Decliners |
1,721 |
53% |
|
Decliners |
3,006 |
65% |
|
Russell 2000 |
-14.95 |
2,246.51 |
-0.66% |
|
52 Wk Highs |
167 |
|
|
52 Wk Highs |
157 |
|
|
S&P 600 |
-4.29 |
1,403.00 |
-0.30% |
|
52 Wk Lows |
62 |
|
|
52 Wk Lows |
319 |
|
|
 |
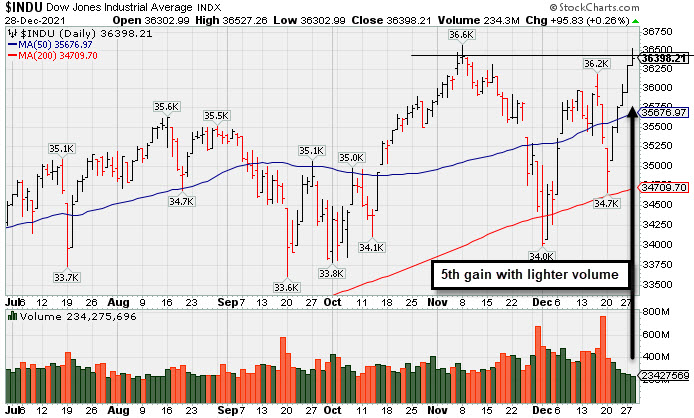
Major Indices Were Mixed With Lighter Volume Totals
Kenneth J. Gruneisen - Passed the CAN SLIM® Master's Exam
The Dow added 95 points, climbing for a fifth consecutive session. The S&P 500 reversed an earlier gain, slipping 0.1% on the heels of a four-day rally that sent the broad benchmark to its 69th record close of 2021. The Nasdaq Composite fell 0.6% as tech stocks wavered following Monday’s mega-cap stock led rally. The volume totals reported were lighter than the prior session on the NYSE and on the Nasdaq exchange. Decliners led advancers by almost 2-1 margin on the Nasdaq exchange while the mix was close to even on the NYSE. Leadership improved as there were 90 high-ranked companies from the Leaders List that hit new 52-week highs and were listed on the BreakOuts Page, versus the total of 77 on the prior session. New 52-week highs solidly outnumbered new 52-week lows on the NYSE, but new lows still outnumbered new highs on the Nasdaq exchange. The market averages (M criteria) are in a confirmed uptrend. New buying efforts are to be carefully made under the fact-based investment system's strict criteria.
 PICTURED: The Dow Jones Industrial Average posted a 5th consecutive gain with lighter volume as it rose near its all-time high.
U.S. stocks fluctuated on Tuesday as investors rotated away from tech and growth-related names and into value-oriented shares. Thin trading volumes exacerbated market fluctuations, with trading volume for the S&P 500 roughly 40% below a trailing 30-day average.
Investors remained cautiously optimistic amid positive seasonality trends associated with the final week of the year and upbeat COVID-19 headlines. The Centers for Disease Control (CDC) shortened their isolation guidelines to five days from 10 days for asymptomatic Americans who test positive for the coronavirus. Stocks benefitting from reopening activity outperformed. Travel-related stocks rebounded, with American Airlines Group Inc. (AAL +2.04%). Technology shares lagged, with chipmakers providing a headwind. Apple Inc. (AAPL -0.58%) edged lower but remains within striking distance of a $3 trillion market capitalization valuation. The stock price needs to breach $182.86 to reach that milestone.
Treasuries were mixed, with the yield on the 10-year note little changed at 1.48%, while the two-year note added five basis points (0.05%) to 0.75%. On the data front, the S&P CoreLogic Case-Shiller gauge of home prices in 20-U.S. cities jumped 18.4% year-over-year, moderating from September’s 19.1% annual figure. In commodities, WTI crude rose 0.5% to $75.94/barrel on the NYMEX, near a one-month high. |
 Kenneth J. Gruneisen started out as a licensed stockbroker in August 1987, a couple of months prior to the historic stock market crash that took the Dow Jones Industrial Average down -22.6% in a single day. He has published daily fact-based fundamental and technical analysis on high-ranked stocks online for two decades. Through FACTBASEDINVESTING.COM, Kenneth provides educational articles, news, market commentary, and other information regarding proven investment systems that work in good times and bad.
Comments contained in the body of this report are technical opinions only and are not necessarily those of Gruneisen Growth Corp. The material herein has been obtained from sources believed to be reliable and accurate, however, its accuracy and completeness cannot be guaranteed. Our firm, employees, and customers may effect transactions, including transactions contrary to any recommendation herein, or have positions in the securities mentioned herein or options with respect thereto. Any recommendation contained in this report may not be suitable for all investors and it is not to be deemed an offer or solicitation on our part with respect to the purchase or sale of any securities. |
|
 |
Retail Index Rose While Tech and Commodity-Linked Groups Fell
Kenneth J. Gruneisen - Passed the CAN SLIM® Master's Exam
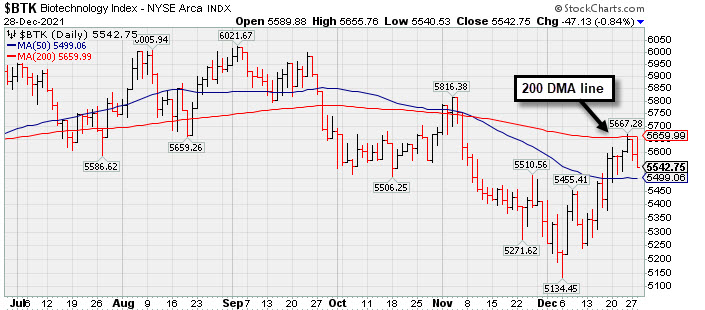
The Retail Index ($RLX +0.46%) posted a small gain while the Broker/Dealer Index ($XBD -0.41%) edged lower and the Bank Index ($BKX -0.03%) was unchanged. The tech sector had a negative bias as the Semiconductor Index ($SOX -1.17%) and Biotech Index ($BTK -0.84%) lost ground and the Networking Index ($NWX -0.02%) was unchanged. Commodity-linked groups had a negative bias as the Gold & Silver Index ($XAU -0.40%) and Oil Services Index ($OSX -0.60%) both fell and the Integrated Oil Index ($XOI -0.06%) finished flat. PICTURED: The Biotech Index ($BTK -0.84%) has recovered from the low in early December but remains below its 200-day moving average (DMA) line which acted as resistance on the prior rebound effort.
| Oil Services |
$OSX |
53.61 |
-0.32 |
-0.60% |
+20.94% |
| Integrated Oil |
$XOI |
1,193.64 |
-0.74 |
-0.06% |
+50.62% |
| Semiconductor |
$SOX |
3,992.19 |
-47.32 |
-1.17% |
+42.81% |
| Networking |
$NWX |
978.26 |
-0.20 |
-0.02% |
+36.42% |
| Broker/Dealer |
$XBD |
493.31 |
-2.02 |
-0.41% |
+30.64% |
| Retail |
$RLX |
4,241.32 |
+19.37 |
+0.46% |
+19.03% |
| Gold & Silver |
$XAU |
130.25 |
-0.52 |
-0.40% |
-9.67% |
| Bank |
$BKX |
132.79 |
-0.04 |
-0.03% |
+35.62% |
| Biotech |
$BTK |
5,542.75 |
-47.13 |
-0.84% |
-3.42% |
|
|
|
 |
Pulling Back After Rebounding Near High
Kenneth J. Gruneisen - Passed the CAN SLIM® Master's Exam
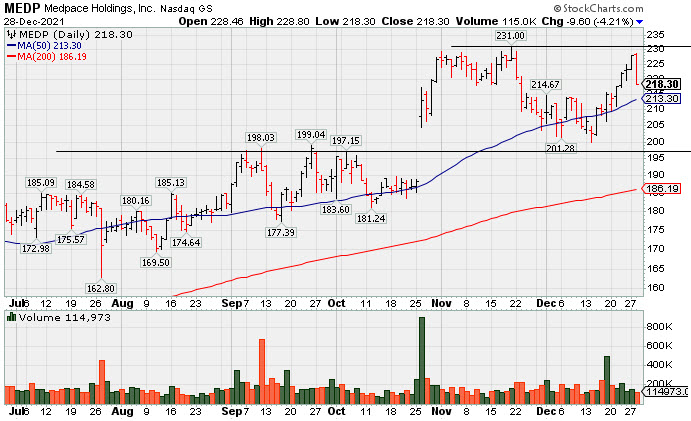
Medpace Holdings Inc (MEDP -$9.60 or -4.21% to $218.30) found support near its 50-day moving average (DMA) line ($213.30) recently. Prior highs in the $199 area also define important near-term support to watch. More damaging losses may trigger a worrisome technical sell signal. Recently it has been noted repeatedly - "Sep '21 earnings rose +18% on +28% sales revenues versus the year ago period, below the +25% minimum earnings guideline (C criteria), raising fundamental concerns." It still has a 96 Earnings Per Share Rating, putting it in the top 5% of all publicly traded companies. Through Jun '21 it had shown 4 strong quarterly earnings increases above the +25% minimum guideline (C criteria), helping it better match the winning models of the fact-based investment system. Annual earnings history has still been strong.
MEDP was highlighted in yellow with pivot point cited based on its 4/26/21 high plus 10 cents in the 9/10/21 mid-day report. It was last shown in this FSU section on 11/17/21 with an annotated graph under the headline, "Medpace Hovering at High With Volume Totals Cooling".
There is a small supply of only 35.9 million shares outstanding (S criteria) which can contribute to greater price volatility in the event of institutional buying or selling. The number of top-rated funds owning its shares rose from 188 in Dec '17 to 643 in Sep '21, a reassuring sign concerning the I criteria. Its current Up/Down Volume Ratio of 1.2 is an unbiased indication its shares have been under accumulation over the past 50 days. It has earned a Timeliness Rating of C and Sponsorship rating of C. It completed Secondary Offerings on 6/12/18, 5/04/18, and 12/01/17.
Charts courtesy of www.stockcharts.com |
|
|
Color Codes Explained :
Y - Better candidates highlighted by our
staff of experts.
G - Previously featured
in past reports as yellow but may no longer be buyable under the
guidelines.
***Last / Change / Volume data in this table is the closing quote data***
Symbol/Exchange
Company Name
Industry Group |
PRICE |
CHANGE
(%Change) |
Day High |
Volume
(% DAV)
(% 50 day avg vol) |
52 Wk Hi
% From Hi |
Featured
Date |
Price
Featured |
Pivot Featured |
|
Max Buy |
 BLDR
-
NYSE
BLDR
-
NYSE
Builders Firstsource Inc
Bldg-Constr Prds/Misc
|
$84.46
|
+0.15
0.18% |
$85.08
|
1,885,259
73.47% of 50 DAV
50 DAV is 2,566,000
|
$84.43
0.04%
|
8/12/2021
|
$52.38
|
PP = $54.09
|
|
MB = $56.79
|
Most Recent Note - 12/27/2021 5:27:27 PM
G - Posted a 4th consecutive gain today with near average volume and hit another new all-time high. Very extended from any sound base. Reported Sep '21 quarterly earnings +308% on +140% sales revenues versus the year ago period. It is well above its 50 DMA line ($69) defines near-term support to watch.
>>> FEATURED STOCK ARTICLE : Perched at Record High After +52% Rally in 4 Months - 12/10/2021 |
View all notes |
Set NEW NOTE alert |
Company Profile |
SEC
News |
Chart |
Request a new note
C
A
S
I |
KFRC
-
NASDAQ
Kforce Inc
Comml Svcs-Staffing
|
$76.12
|
-0.87
-1.13% |
$77.69
|
111,222
100.20% of 50 DAV
50 DAV is 111,000
|
$81.47
-6.57%
|
9/10/2021
|
$59.53
|
PP = $64.48
|
|
MB = $67.70
|
 Most Recent Note - 12/28/2021 6:17:00 PM
G - Pulled back today breaking a streak of 6 consecutive gains. Its 50 DMA line ($73) and prior low ($71.05 on 12/14/21) define important near-term support to watch. Recently reported Sep '21 quarterly earnings +8% on +10% sales revenues versus the year ago period, below the +25% minimum earnings guideline (C criteria), raising fundamental concerns.
>>> FEATURED STOCK ARTICLE : Extended From Base and Latest Quarter Earnings Growth Sub Par - 11/19/2021 |
View all notes |
Set NEW NOTE alert |
Company Profile |
SEC
News |
Chart |
Request a new note
C
A
S
I |
REGN
-
NASDAQ
Regeneron Pharmaceutical
DRUGS - Biotechnology
|
$638.46
|
+3.69
0.58% |
$639.50
|
327,753
41.12% of 50 DAV
50 DAV is 797,000
|
$686.62
-7.01%
|
12/13/2021
|
$647.95
|
PP = $686.72
|
|
MB = $721.06
|
Most Recent Note - 12/22/2021 5:20:53 PM
Y - Posted a gain today with below average volume, it halted its slide after recent volume-driven losses undercut its 50 DMA line ($622) raising concerns. Color code was recently changed to yellow with new pivot point cited based on its 9/01/21 high plus 10 cents. Subsequent gains above the pivot point backed by at least +40% above average volume may trigger a technical buy signal. Its Relative Strength rating has slumped to 80, right at the 80+ minimum guideline for buy candidates.
>>> FEATURED STOCK ARTICLE : Consolidating Near All-Time High With Little Resistance Remaining - 12/13/2021 |
View all notes |
Set NEW NOTE alert |
Company Profile |
SEC
News |
Chart |
Request a new note
C
A
S
I |
LLY
-
NYSE
Eli Lilly & Co
Medical-Diversified
|
$276.43
|
-1.98
-0.71% |
$279.40
|
1,033,874
32.29% of 50 DAV
50 DAV is 3,202,000
|
$283.91
-2.63%
|
12/16/2021
|
$279.28
|
PP = $275.97
|
|
MB = $289.77
|
Most Recent Note - 12/23/2021 5:35:38 PM
Y - Posted a quiet 3rd consecutive gain today, closing the week perched near its all-time high. Finished strong after highlighted in yellow in the 12/16/21 mid-day report with pivot point cited based on its 8/17/21 high plus 10 cents. This giant Medical - Diversified firm triggered a technical buy signal as it powered to new all-time highs with +78% above average volume behind its 5th consecutive gain after a choppy 17-week consolidation. Reported Sep '21 quarterly earnings +38% on +18% sales revenues versus the year ago period, and 3 of the past 4 quarterly comparisons were above the +25% minimum earnings guideline (C criteria). Annual earnings (A criteria) improved steadily since a downturn in FY '14.
>>> FEATURED STOCK ARTICLE : Eli Lilly & Co Powered to New Highs With Volume - 12/16/2021 |
View all notes |
Set NEW NOTE alert |
Company Profile |
SEC
News |
Chart |
Request a new note
C
A
S
I |
CAMT
-
NASDAQ
Camtek Ltd
ELECTRONICS - Scientific and Technical Instrum
|
$44.97
|
-0.44
-0.97% |
$46.00
|
136,000
51.71% of 50 DAV
50 DAV is 263,000
|
$49.60
-9.33%
|
11/9/2021
|
$45.43
|
PP = $46.11
|
|
MB = $48.42
|
Most Recent Note - 12/27/2021 5:16:01 PM
G - Posted a 4th consecutive quiet gain today, consolidating above its 50 DMA line ($43). Faces some resistance due to overhead supply up to the $49 level. Fundamentals remain strong.
>>> FEATURED STOCK ARTICLE : Closed Above 50-Day Average After Big Gain With Light Volume - 12/15/2021 |
View all notes |
Set NEW NOTE alert |
Company Profile |
SEC
News |
Chart |
Request a new note
C
A
S
I |
Symbol/Exchange
Company Name
Industry Group |
PRICE |
CHANGE
(%Change) |
Day High |
Volume
(% DAV)
(% 50 day avg vol) |
52 Wk Hi
% From Hi |
Featured
Date |
Price
Featured |
Pivot Featured |
|
Max Buy |
AMD
-
NASDAQ
Advanced Micro Devices
ELECTRONICS - Semiconductor - Broad Line
|
$153.15
|
-1.21
-0.78% |
$156.73
|
58,614,030
101.70% of 50 DAV
50 DAV is 57,633,000
|
$164.46
-6.88%
|
10/27/2021
|
$124.91
|
PP = $122.59
|
|
MB = $128.72
|
Most Recent Note - 12/28/2021 12:09:59 PM
G - Posted another big gain on the prior session with below average volume. It has not formed a sound base of sufficient length but rallied after its 50 DMA line ($140) recently acted as support. Any violation may trigger a technical sell signal. Fundamentals remain strong after it reported Sep '21 quarterly earnings +78% on +54% sales revenues versus the year ago period.
>>> FEATURED STOCK ARTICLE : AMD Pulling Back After Considerable Rally - 12/1/2021 |
View all notes |
Set NEW NOTE alert |
Company Profile |
SEC
News |
Chart |
Request a new note
C
A
S
I |
UMC
-
NYSE
United Microelectrnc Adr
ELECTRONICS - Semiconductor - Integrated Cir
|
$11.69
|
-0.12
-1.02% |
$11.88
|
3,501,118
44.34% of 50 DAV
50 DAV is 7,896,000
|
$12.68
-7.81%
|
12/1/2021
|
$12.60
|
PP = $12.72
|
|
MB = $13.36
|
Most Recent Note - 12/28/2021 6:18:43 PM
Y - Still perched within striking distance of its all-time high after recently retesting support near its 50 DMA line ($11.20). More damaging losses would raise concerns. A gain and solid close above the pivot point may help clinch a proper new (or add-on) technical buy signal. Reported Sep '21 quarterly earnings +100% on +30% sales revenues versus the year ago period.
>>> FEATURED STOCK ARTICLE : Rebound Above 50-Day Moving Average Showed Resilience - 11/30/2021 |
View all notes |
Set NEW NOTE alert |
Company Profile |
SEC
News |
Chart |
Request a new note
C
A
S
I |
ENTG
-
NASDAQ
Entegris Inc
ELECTRONICS - Semiconductor Equipment and Mate
|
$139.51
|
-1.43
-1.01% |
$142.22
|
807,310
67.96% of 50 DAV
50 DAV is 1,188,000
|
$158.00
-11.70%
|
8/4/2021
|
$125.33
|
PP = $126.51
|
|
MB = $132.84
|
Most Recent Note - 12/27/2021 5:20:01 PM
G - Posted a 4th consecutive gain today with below average volume after damaging volume-driven losses. A rebound above the 50 DMA line ($143.45) is needed for its outlook to improve. Fundamentals remain strong after it recently reported Sep '21 quarterly earnings +37% on +20% sales revenues versus the year ago period.
>>> FEATURED STOCK ARTICLE : Best Ever Close After Volume-Driven Gain - 11/29/2021 |
View all notes |
Set NEW NOTE alert |
Company Profile |
SEC
News |
Chart |
Request a new note
C
A
S
I |
DHR
-
NYSE
Danaher Corp
Medical-Diversified
|
$323.44
|
-3.97
-1.21% |
$328.59
|
1,234,195
46.93% of 50 DAV
50 DAV is 2,630,000
|
$333.96
-3.15%
|
12/16/2021
|
$321.36
|
PP = $334.06
|
|
MB = $350.76
|
Most Recent Note - 12/22/2021 5:24:03 PM
Y - Posted a gain today with below average volume, consolidating above its 50 DMA line and still perched within striking distance of its 52-week high. Highlighted in yellow with pivot point cited base on its 9/10/21 high plus 10 cents in the 12/16/21 mid-day report. Subsequent gains above the pivot point with at least +40% above average volume may trigger a technical buy signal. Fundamentals remain strong.
>>> FEATURED STOCK ARTICLE : Consolidating Near Prior Highs Above 50-Day Moving Average - 12/17/2021 |
View all notes |
Set NEW NOTE alert |
Company Profile |
SEC
News |
Chart |
Request a new note
C
A
S
I |
SKY
-
NYSE
Skyline Champion Corp
Bldg-Mobile/Mfg andamp; RV
|
$79.24
|
-0.36
-0.45% |
$80.28
|
280,182
57.06% of 50 DAV
50 DAV is 491,000
|
$85.92
-7.77%
|
11/3/2021
|
$72.19
|
PP = $66.92
|
|
MB = $70.27
|
Most Recent Note - 12/27/2021 5:18:57 PM
G - It has not formed a sound new base after a streak of damaging losses. Below average volume was behind today's 4th consecutive gain as it rebounded further above the 50 DMA line ($74). Fundamentals remain strong.
>>> FEATURED STOCK ARTICLE : Pulling Back From All-Time High After Recent Rally - 12/14/2021 |
View all notes |
Set NEW NOTE alert |
Company Profile |
SEC
News |
Chart |
Request a new note
C
A
S
I |
Symbol/Exchange
Company Name
Industry Group |
PRICE |
CHANGE
(%Change) |
Day High |
Volume
(% DAV)
(% 50 day avg vol) |
52 Wk Hi
% From Hi |
Featured
Date |
Price
Featured |
Pivot Featured |
|
Max Buy |
DHI
-
NYSE
D R Horton Inc
MATERIALS and CONSTRUCTION - Residential Construction
|
$106.95
|
+0.74
0.70% |
$107.80
|
1,524,282
53.65% of 50 DAV
50 DAV is 2,841,000
|
$110.45
-3.17%
|
12/6/2021
|
$104.40
|
PP = $106.99
|
|
MB = $112.34
|
Most Recent Note - 12/27/2021 12:21:38 PM
Y - Volume totals have been cooling while hovering near its all-time high. Showed stalling action since highlighted in yellow with pivot point cited based on its 5/10/21 high plus 10 cents in the 12/06/21 mid-day report. Reported Sep '21 earnings +68% on +27% sales revenues versus the year-ago period, its 8th strong quarterly comparison above the +25% minimum guideline (C criteria). Annual earnings growth (A criteria) has been strong.
>>> FEATURED STOCK ARTICLE : Builder Built a Solid Base And Challenged Prior High - 12/6/2021 |
View all notes |
Set NEW NOTE alert |
Company Profile |
SEC
News |
Chart |
Request a new note
C
A
S
I |
TITN
-
NASDAQ
Titan Machinery Inc
SPECIALTY RETAIL
|
$33.58
|
+0.30
0.90% |
$34.02
|
138,260
79.01% of 50 DAV
50 DAV is 175,000
|
$38.58
-12.96%
|
11/23/2021
|
$36.22
|
PP = $35.34
|
|
MB = $37.11
|
Most Recent Note - 12/27/2021 5:22:39 PM
G - Posted a 4th consecutive gain today with higher volume. Found prompt support near its 50 DMA line ($31.69) but it has not formed a sound base and faces resistance due to overhead supply up to the $38 level. Reported Oct '21 quarterly earnings +81% on +26% sales revenues over the year ago period, its 4th strong quarterly comparison.
>>> FEATURED STOCK ARTICLE : Strong Close With Gain Backed by +467% Above Average Volume - 11/23/2021 |
View all notes |
Set NEW NOTE alert |
Company Profile |
SEC
News |
Chart |
Request a new note
C
A
S
I |
CLFD
-
NASDAQ
Clearfield Inc
TELECOMMUNICATIONS - Cables / Satalite Equipment
|
$82.90
|
-1.21
-1.44% |
$85.72
|
237,099
168.16% of 50 DAV
50 DAV is 141,000
|
$84.43
-1.81%
|
12/16/2021
|
$72.76
|
PP = $72.10
|
|
MB = $75.71
|
Most Recent Note - 12/28/2021 12:13:25 PM
G - Reversed into the red after hitting yet another new all-time high with today's early gain, getting very extended beyond its "max buy" level. Prior high ($72) defines initial support to watch on pullbacks. Reported Sep '21 quarterly earnings +141% on +66% sales revenues above the year ago period.
>>> FEATURED STOCK ARTICLE : Perched Near High Extended From Any Sound Base - 11/22/2021 |
View all notes |
Set NEW NOTE alert |
Company Profile |
SEC
News |
Chart |
Request a new note
C
A
S
I |
ODFL
-
NASDAQ
Old Dominion Fght Line
TRANSPORTATION - Trucking
|
$356.64
|
+1.04
0.29% |
$358.51
|
370,635
60.07% of 50 DAV
50 DAV is 617,000
|
$373.58
-4.53%
|
12/7/2021
|
$365.61
|
PP = $364.17
|
|
MB = $382.38
|
Most Recent Note - 12/23/2021 5:37:35 PM
Y - Its color code is changed to yellow after a prompt rebound above the 50 DMA line ($344) this week helped its outlook improve. Still faces near term resistance up to the $373 level after several weeks of trading at higher levels.
>>> FEATURED STOCK ARTICLE : Perched at All Time High After Tight Consolidation Several Weeks - 12/7/2021 |
View all notes |
Set NEW NOTE alert |
Company Profile |
SEC
News |
Chart |
Request a new note
C
A
S
I |
POOL
-
NASDAQ
Pool Corp
WHOLESALE - Basic Materials Wholesale
|
$561.21
|
+0.30
0.05% |
$565.58
|
264,635
108.46% of 50 DAV
50 DAV is 244,000
|
$582.27
-3.62%
|
12/27/2021
|
$555.44
|
PP = $582.37
|
|
MB = $611.49
|
Most Recent Note - 12/28/2021 12:25:11 PM
Y - Color code was changed to yellow with new pivot point cited based on its 11/19/21 high plus 10 cents. Subsequent gains above the pivot point backed by at least +40% above average volume may trigger a new technical buy signal. Reported strong Sep '21 quarterly results and found support at its 50 DMA line ($539) during the recent consolidation. Showed resilience since dropped from the Featured Stocks list on 10/04/21.
>>> FEATURED STOCK ARTICLE : Forming New Base After Finding Prompt Support at 50 DMA - 12/27/2021 |
View all notes |
Set NEW NOTE alert |
Company Profile |
SEC
News |
Chart |
Request a new note
C
A
S
I |
Symbol/Exchange
Company Name
Industry Group |
PRICE |
CHANGE
(%Change) |
Day High |
Volume
(% DAV)
(% 50 day avg vol) |
52 Wk Hi
% From Hi |
Featured
Date |
Price
Featured |
Pivot Featured |
|
Max Buy |
SMPL
-
NASDAQ
Simply Good Foods Co
Food-Confectionery
|
$41.35
|
+0.13
0.32% |
$42.09
|
595,257
135.90% of 50 DAV
50 DAV is 438,000
|
$41.35
0.00%
|
12/22/2021
|
$40.04
|
PP = $41.45
|
|
MB = $43.52
|
Most Recent Note - 12/22/2021 4:58:47 PM
Y - Color code is changed to yellow with new pivot point cited based on its 11/08/21 high plus 10 cents. Consolidating above its 50 DMA line ($38.22). The prior low and 200 DMA line ($35.62) define the next important support. See he latest FSU analysis for more details and a new annotated graph.
>>> FEATURED STOCK ARTICLE : Formed New 5-Week Base and Perched Near Pivot Point - 12/22/2021 |
View all notes |
Set NEW NOTE alert |
Company Profile |
SEC
News |
Chart |
Request a new note
C
A
S
I |
WDAY
-
NYSE
Workday Inc Cl A
Computer Sftwr-Enterprse
|
$275.80
|
-3.55
-1.27% |
$280.73
|
859,253
53.67% of 50 DAV
50 DAV is 1,601,100
|
$307.81
-10.40%
|
9/7/2021
|
$275.69
|
PP = $282.87
|
|
MB = $297.01
|
Most Recent Note - 12/23/2021 5:30:18 PM
G - Its Relative Strength Rating has fallen to 73, below the 80+ minimum guideline for buy candidates while recently sputtering just below its 50 DMA line ($281.70). A rebound above the 50 DMA line is needed for its outlook to improve. Prior low ($258.22 on 12/06/21) and 200 DMA line ($254.52) define the next important support to watch. Reported Oct '21 quarterly earnings +28% on +20% sales revenues versus the year ago period. Fundamentals remain strong. See the latest FSU analysis for more details and a new annotated graph.
>>> FEATURED STOCK ARTICLE : Relative Strength Rating Fell While Sputtering Below 50 DMA Line - 12/23/2021 |
View all notes |
Set NEW NOTE alert |
Company Profile |
SEC
News |
Chart |
Request a new note
C
A
S
I |
TTD
-
NASDAQ
The Trade Desk Inc Cl A
Comml Svcs-Advertising
|
$94.79
|
-2.89
-2.96% |
$98.22
|
1,894,135
35.25% of 50 DAV
50 DAV is 5,374,000
|
$114.09
-16.92%
|
11/9/2021
|
$95.16
|
PP = $90.00
|
|
MB = $94.50
|
Most Recent Note - 12/23/2021 5:33:24 PM
G - Today's gain with below average volume helped it rebound further above the prior high ($90) after finding prompt support near its 50 DMA line ($90). Recent resilience has helped its outlook improve, but it faces overhead supply up to the $114 level.
>>> FEATURED STOCK ARTICLE : Quietly Slumping Into Prior Base and Below 50-Day Moving Average - 12/20/2021 |
View all notes |
Set NEW NOTE alert |
Company Profile |
SEC
News |
Chart |
Request a new note
C
A
S
I |
MEDP
-
NASDAQ
Medpace Holdings Inc
Medical-Research Eqp/Svc
|
$218.30
|
-9.60
-4.21% |
$228.80
|
114,973
65.70% of 50 DAV
50 DAV is 175,000
|
$231.00
-5.50%
|
9/10/2021
|
$196.32
|
PP = $196.22
|
|
MB = $206.03
|
Most Recent Note - 12/28/2021 6:14:57 PM
G - Pulled back today after rebounding near the prior high. Found support near its 50 DMA line ($213.30) recently, and prior highs in the $199 area also define important near-term support to watch. More damaging losses may trigger a worrisome technical sell signal. See the latest FSU analysis for more details and a new annotated graph. Recently noted repeatedly - "Sep '21 earnings rose +18% on +28% sales revenues versus the year ago period, below the +25% minimum earnings guideline (C criteria), raising fundamental concerns.
>>> FEATURED STOCK ARTICLE : Pulling Back After Rebounding Near High - 12/28/2021 |
View all notes |
Set NEW NOTE alert |
Company Profile |
SEC
News |
Chart |
Request a new note
C
A
S
I |
AVTR
-
NYSE
Avantor Inc
Medical-Research Eqp/Svc
|
$41.34
|
-0.62
-1.48% |
$42.11
|
2,048,771
53.49% of 50 DAV
50 DAV is 3,830,000
|
$44.37
-6.83%
|
12/27/2021
|
$41.96
|
PP = $44.47
|
|
MB = $46.69
|
Most Recent Note - 12/27/2021 5:26:44 PM
Y - Color code is changed to yellow with new pivot point cited based on its 9/23/21 high plus 10 cents. Posted a 4th consecutive gain today with lighter volume. Consolidating above its 50 DMA line ($39.16) and it faces little overhead supply up to the $44 level. Subsequent gains above the pivot point backed by at least +40% above average volume may trigger a new technical buy signal. Prior lows in the high $36 area define important near-term support. Reported Sep '21 quarterly earnings +46% above the year ago period.
>>> FEATURED STOCK ARTICLE : Rebounding With Volume-Driven Gains - 12/21/2021 |
View all notes |
Set NEW NOTE alert |
Company Profile |
SEC
News |
Chart |
Request a new note
C
A
S
I |
Symbol/Exchange
Company Name
Industry Group |
PRICE |
CHANGE
(%Change) |
Day High |
Volume
(% DAV)
(% 50 day avg vol) |
52 Wk Hi
% From Hi |
Featured
Date |
Price
Featured |
Pivot Featured |
|
Max Buy |
|
|
|
THESE ARE NOT BUY RECOMMENDATIONS!
Comments contained in the body of this report are technical
opinions only. The material herein has been obtained
from sources believed to be reliable and accurate, however,
its accuracy and completeness cannot be guaranteed.
This site is not an investment advisor, hence it does
not endorse or recommend any securities or other investments.
Any recommendation contained in this report may not
be suitable for all investors and it is not to be deemed
an offer or solicitation on our part with respect to
the purchase or sale of any securities. All trademarks,
service marks and trade names appearing in this report
are the property of their respective owners, and are
likewise used for identification purposes only.
This report is a service available
only to active Paid Premium Members.
You may opt-out of receiving report notifications
at any time. Questions or comments may be submitted
by writing to Premium Membership Services 665 S.E. 10 Street, Suite 201 Deerfield Beach, FL 33441-5634 or by calling 1-800-965-8307
or 954-785-1121.
|
|
|