***Last / Change / Volume data in this table is the closing quote data***
Symbol/Exchange
Company Name
Industry Group |
PRICE |
CHANGE
(%Change) |
Day High |
Volume
(% DAV)
(% 50 day avg vol) |
52 Wk Hi
% From Hi |
Featured
Date |
Price
Featured |
Pivot Featured |
|
Max Buy |
 BLDR
-
NYSE
BLDR
-
NYSE
Builders Firstsource Inc
Bldg-Constr Prds/Misc
|
$84.05
|
-1.00
-1.18% |
$85.77
|
1,571,548
60.98% of 50 DAV
50 DAV is 2,577,000
|
$85.30
-1.47%
|
8/12/2021
|
$52.38
|
PP = $54.09
|
|
MB = $56.79
|
Most Recent Note - 12/27/2021 5:27:27 PM
G - Posted a 4th consecutive gain today with near average volume and hit another new all-time high. Very extended from any sound base. Reported Sep '21 quarterly earnings +308% on +140% sales revenues versus the year ago period. It is well above its 50 DMA line ($69) defines near-term support to watch.
>>> FEATURED STOCK ARTICLE : Perched at Record High After +52% Rally in 4 Months - 12/10/2021 |
View all notes |
Set NEW NOTE alert |
Company Profile |
SEC
News |
Chart |
Request a new note
C
A
S
I |
KFRC
-
NASDAQ
Kforce Inc
Comml Svcs-Staffing
|
$74.79
|
-1.21
-1.59% |
$76.57
|
66,516
58.86% of 50 DAV
50 DAV is 113,000
|
$81.47
-8.20%
|
9/10/2021
|
$59.53
|
PP = $64.48
|
|
MB = $67.70
|
Most Recent Note - 12/29/2021 4:50:27 PM
G - Consolidating above its 50 DMA line ($73.27) and prior low ($71.05 on 12/14/21) which define important near-term support levels to watch. Recently reported Sep '21 quarterly earnings +8% on +10% sales revenues versus the year ago period, below the +25% minimum earnings guideline (C criteria), raising fundamental concerns. See the latest FSU analysis for more details and a new annotated graph.
>>> FEATURED STOCK ARTICLE : Consolidating Above its 50-Day Moving Average Line - 12/29/2021 |
View all notes |
Set NEW NOTE alert |
Company Profile |
SEC
News |
Chart |
Request a new note
C
A
S
I |
REGN
-
NASDAQ
Regeneron Pharmaceutical
DRUGS - Biotechnology
|
$642.51
|
-4.77
-0.74% |
$651.28
|
295,616
38.34% of 50 DAV
50 DAV is 771,000
|
$686.62
-6.42%
|
12/13/2021
|
$647.95
|
PP = $686.72
|
|
MB = $721.06
|
Most Recent Note - 12/29/2021 3:47:19 PM
Y - Posting its 6th consecutive gain today with below average volume, yet recently rebounding above its 50 DMA line ($629) helping its technical stance and outlook improve. Color code was recently changed to yellow with new pivot point cited based on its 9/01/21 high plus 10 cents. Subsequent gains above the pivot point backed by at least +40% above average volume may trigger a technical buy signal. Its Relative Strength rating has slumped to 86, right at the 80+ minimum guideline for buy candidates.
>>> FEATURED STOCK ARTICLE : Consolidating Near All-Time High With Little Resistance Remaining - 12/13/2021 |
View all notes |
Set NEW NOTE alert |
Company Profile |
SEC
News |
Chart |
Request a new note
C
A
S
I |
LLY
-
NYSE
Eli Lilly & Co
Medical-Diversified
|
$277.34
|
-1.08
-0.39% |
$280.65
|
990,871
31.54% of 50 DAV
50 DAV is 3,142,000
|
$283.91
-2.31%
|
12/16/2021
|
$279.28
|
PP = $275.97
|
|
MB = $289.77
|
Most Recent Note - 12/29/2021 3:58:53 PM
Y - Showed resilience after a pullback and volume totals have been cooling while it remains perched near its all-time high. Recent low ($260) defines initial support to watch above its 50 DMA line ($257.49)
>>> FEATURED STOCK ARTICLE : Eli Lilly & Co Powered to New Highs With Volume - 12/16/2021 |
View all notes |
Set NEW NOTE alert |
Company Profile |
SEC
News |
Chart |
Request a new note
C
A
S
I |
CAMT
-
NASDAQ
Camtek Ltd
ELECTRONICS - Scientific and Technical Instrum
|
$45.69
|
-0.29
-0.63% |
$46.65
|
85,675
32.45% of 50 DAV
50 DAV is 264,000
|
$49.60
-7.88%
|
11/9/2021
|
$45.43
|
PP = $46.11
|
|
MB = $48.42
|
Most Recent Note - 12/29/2021 4:08:36 PM
G - Posted a gain today with light volume, consolidating above its 50 DMA line ($43.32). Faces little resistance due to overhead supply up to the $49 level. Fundamentals remain strong.
>>> FEATURED STOCK ARTICLE : Closed Above 50-Day Average After Big Gain With Light Volume - 12/15/2021 |
View all notes |
Set NEW NOTE alert |
Company Profile |
SEC
News |
Chart |
Request a new note
C
A
S
I |
Symbol/Exchange
Company Name
Industry Group |
PRICE |
CHANGE
(%Change) |
Day High |
Volume
(% DAV)
(% 50 day avg vol) |
52 Wk Hi
% From Hi |
Featured
Date |
Price
Featured |
Pivot Featured |
|
Max Buy |
AMD
-
NASDAQ
Advanced Micro Devices
ELECTRONICS - Semiconductor - Broad Line
|
$145.15
|
-3.11
-2.10% |
$148.85
|
43,654,385
75.01% of 50 DAV
50 DAV is 58,198,000
|
$164.46
-11.74%
|
10/27/2021
|
$124.91
|
PP = $122.59
|
|
MB = $128.72
|
 Most Recent Note - 12/30/2021 5:08:44 PM
G - Pulled back today for a 3rd consecutive loss with below average volume. It has not formed a sound base of sufficient length but its 50 DMA line ($141.27) recently acted as support. Any violation may trigger a technical sell signal. Fundamentals remain strong after it reported Sep '21 quarterly earnings +78% on +54% sales revenues versus the year ago period.
>>> FEATURED STOCK ARTICLE : AMD Pulling Back After Considerable Rally - 12/1/2021 |
View all notes |
Set NEW NOTE alert |
Company Profile |
SEC
News |
Chart |
Request a new note
C
A
S
I |
UMC
-
NYSE
United Microelectrnc Adr
ELECTRONICS - Semiconductor - Integrated Cir
|
$11.64
|
-0.06
-0.51% |
$11.81
|
3,113,997
40.15% of 50 DAV
50 DAV is 7,756,000
|
$12.68
-8.20%
|
12/1/2021
|
$12.60
|
PP = $12.72
|
|
MB = $13.36
|
Most Recent Note - 12/28/2021 6:18:43 PM
Y - Still perched within striking distance of its all-time high after recently retesting support near its 50 DMA line ($11.20). More damaging losses would raise concerns. A gain and solid close above the pivot point may help clinch a proper new (or add-on) technical buy signal. Reported Sep '21 quarterly earnings +100% on +30% sales revenues versus the year ago period.
>>> FEATURED STOCK ARTICLE : Rebound Above 50-Day Moving Average Showed Resilience - 11/30/2021 |
View all notes |
Set NEW NOTE alert |
Company Profile |
SEC
News |
Chart |
Request a new note
C
A
S
I |
ENTG
-
NASDAQ
Entegris Inc
ELECTRONICS - Semiconductor Equipment and Mate
|
$138.24
|
-0.66
-0.48% |
$140.54
|
466,102
39.50% of 50 DAV
50 DAV is 1,180,000
|
$158.00
-12.51%
|
8/4/2021
|
$125.33
|
PP = $126.51
|
|
MB = $132.84
|
Most Recent Note - 12/27/2021 5:20:01 PM
G - Posted a 4th consecutive gain today with below average volume after damaging volume-driven losses. A rebound above the 50 DMA line ($143.45) is needed for its outlook to improve. Fundamentals remain strong after it recently reported Sep '21 quarterly earnings +37% on +20% sales revenues versus the year ago period.
>>> FEATURED STOCK ARTICLE : Best Ever Close After Volume-Driven Gain - 11/29/2021 |
View all notes |
Set NEW NOTE alert |
Company Profile |
SEC
News |
Chart |
Request a new note
C
A
S
I |
DHR
-
NYSE
Danaher Corp
Medical-Diversified
|
$328.55
|
+1.97
0.60% |
$330.46
|
913,397
35.13% of 50 DAV
50 DAV is 2,600,000
|
$333.96
-1.62%
|
12/16/2021
|
$321.36
|
PP = $334.06
|
|
MB = $350.76
|
Most Recent Note - 12/29/2021 3:41:14 PM
Y - Volume totals have been cooling while consolidating well above its 50 DMA line ($312.51) and still perched within striking distance of its 52-week high. Highlighted in yellow with pivot point cited base on its 9/10/21 high plus 10 cents in the 12/16/21 mid-day report. Subsequent gains above the pivot point with at least +40% above average volume may trigger a technical buy signal. Fundamentals remain strong.
>>> FEATURED STOCK ARTICLE : Consolidating Near Prior Highs Above 50-Day Moving Average - 12/17/2021 |
View all notes |
Set NEW NOTE alert |
Company Profile |
SEC
News |
Chart |
Request a new note
C
A
S
I |
SKY
-
NYSE
Skyline Champion Corp
Bldg-Mobile/Mfg andamp; RV
|
$78.22
|
-1.75
-2.19% |
$80.98
|
330,115
67.23% of 50 DAV
50 DAV is 491,000
|
$85.92
-8.96%
|
11/3/2021
|
$72.19
|
PP = $66.92
|
|
MB = $70.27
|
Most Recent Note - 12/30/2021 5:06:47 PM
G - It has not formed a sound new base but promptly rebounded above the 50 DMA line ($74.92). Fundamentals remain strong.
>>> FEATURED STOCK ARTICLE : Pulling Back From All-Time High After Recent Rally - 12/14/2021 |
View all notes |
Set NEW NOTE alert |
Company Profile |
SEC
News |
Chart |
Request a new note
C
A
S
I |
Symbol/Exchange
Company Name
Industry Group |
PRICE |
CHANGE
(%Change) |
Day High |
Volume
(% DAV)
(% 50 day avg vol) |
52 Wk Hi
% From Hi |
Featured
Date |
Price
Featured |
Pivot Featured |
|
Max Buy |
DHI
-
NYSE
D R Horton Inc
MATERIALS and CONSTRUCTION - Residential Construction
|
$107.51
|
-0.85
-0.78% |
$108.88
|
1,023,630
36.44% of 50 DAV
50 DAV is 2,809,000
|
$110.45
-2.66%
|
12/6/2021
|
$104.40
|
PP = $106.99
|
|
MB = $112.34
|
Most Recent Note - 12/27/2021 12:21:38 PM
Y - Volume totals have been cooling while hovering near its all-time high. Showed stalling action since highlighted in yellow with pivot point cited based on its 5/10/21 high plus 10 cents in the 12/06/21 mid-day report. Reported Sep '21 earnings +68% on +27% sales revenues versus the year-ago period, its 8th strong quarterly comparison above the +25% minimum guideline (C criteria). Annual earnings growth (A criteria) has been strong.
>>> FEATURED STOCK ARTICLE : Builder Built a Solid Base And Challenged Prior High - 12/6/2021 |
View all notes |
Set NEW NOTE alert |
Company Profile |
SEC
News |
Chart |
Request a new note
C
A
S
I |
TITN
-
NASDAQ
Titan Machinery Inc
SPECIALTY RETAIL
|
$33.72
|
-0.07
-0.21% |
$34.44
|
77,062
43.29% of 50 DAV
50 DAV is 178,000
|
$38.58
-12.60%
|
11/23/2021
|
$36.22
|
PP = $35.34
|
|
MB = $37.11
|
Most Recent Note - 12/29/2021 3:53:11 PM
G - Posting a 6th consecutive gain today with near average volume. Found prompt support near its 50 DMA line ($31.95) but it has not formed a sound base and faces resistance due to overhead supply up to the $38 level. Reported Oct '21 quarterly earnings +81% on +26% sales revenues over the year ago period, its 4th strong quarterly comparison.
>>> FEATURED STOCK ARTICLE : Strong Close With Gain Backed by +467% Above Average Volume - 11/23/2021 |
View all notes |
Set NEW NOTE alert |
Company Profile |
SEC
News |
Chart |
Request a new note
C
A
S
I |
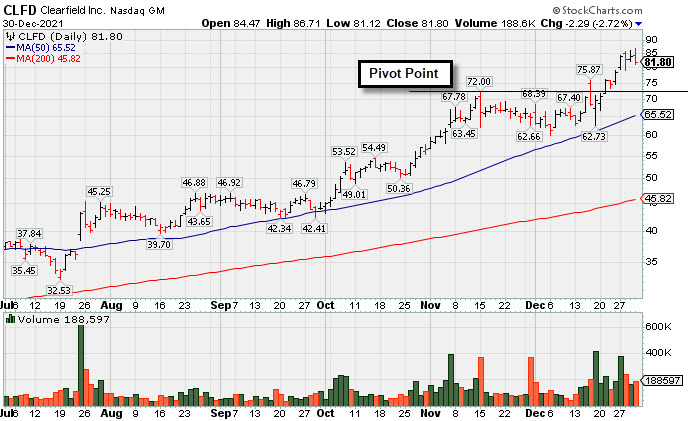
CLFD
-
NASDAQ
Clearfield Inc
TELECOMMUNICATIONS - Cables / Satalite Equipment
|
$81.80
|
-2.29
-2.72% |
$86.71
|
188,597
128.30% of 50 DAV
50 DAV is 147,000
|
$86.17
-5.07%
|
12/16/2021
|
$72.76
|
PP = $72.10
|
|
MB = $75.71
|
Most Recent Note - 12/30/2021 5:03:20 PM
G - Reversed into the red after hitting a new all-time high with today's early gain, getting very extended beyond its "max buy" level. Prior high ($72) defines initial support to watch on pullbacks. Reported Sep '21 quarterly earnings +141% on +66% sales revenues above the year ago period. See the latest FSU analysis for more details and an annotated graph.
>>> FEATURED STOCK ARTICLE : Negative Reversal After Hitting a New All Time High - 12/30/2021 |
View all notes |
Set NEW NOTE alert |
Company Profile |
SEC
News |
Chart |
Request a new note
C
A
S
I |
ODFL
-
NASDAQ
Old Dominion Fght Line
TRANSPORTATION - Trucking
|
$356.27
|
-4.54
-1.26% |
$362.92
|
241,862
39.71% of 50 DAV
50 DAV is 609,000
|
$373.58
-4.63%
|
12/7/2021
|
$365.61
|
PP = $364.17
|
|
MB = $382.38
|
Most Recent Note - 12/29/2021 4:01:37 PM
Y - Posted a 6th consecutive small gain today with light volume after finding prompt support near its 50 DMA line ($347.53). Faces very little near term resistance up to the $373 level..
>>> FEATURED STOCK ARTICLE : Perched at All Time High After Tight Consolidation Several Weeks - 12/7/2021 |
View all notes |
Set NEW NOTE alert |
Company Profile |
SEC
News |
Chart |
Request a new note
C
A
S
I |
POOL
-
NASDAQ
Pool Corp
WHOLESALE - Basic Materials Wholesale
|
$560.81
|
-6.82
-1.20% |
$569.46
|
205,140
83.39% of 50 DAV
50 DAV is 246,000
|
$582.27
-3.69%
|
12/27/2021
|
$555.44
|
PP = $582.37
|
|
MB = $611.49
|
Most Recent Note - 12/28/2021 12:25:11 PM
Y - Color code was changed to yellow with new pivot point cited based on its 11/19/21 high plus 10 cents. Subsequent gains above the pivot point backed by at least +40% above average volume may trigger a new technical buy signal. Reported strong Sep '21 quarterly results and found support at its 50 DMA line ($539) during the recent consolidation. Showed resilience since dropped from the Featured Stocks list on 10/04/21.
>>> FEATURED STOCK ARTICLE : Forming New Base After Finding Prompt Support at 50 DMA - 12/27/2021 |
View all notes |
Set NEW NOTE alert |
Company Profile |
SEC
News |
Chart |
Request a new note
C
A
S
I |
Symbol/Exchange
Company Name
Industry Group |
PRICE |
CHANGE
(%Change) |
Day High |
Volume
(% DAV)
(% 50 day avg vol) |
52 Wk Hi
% From Hi |
Featured
Date |
Price
Featured |
Pivot Featured |
|
Max Buy |
SMPL
-
NASDAQ
Simply Good Foods Co
Food-Confectionery
|
$41.28
|
-0.53
-1.27% |
$41.99
|
187,779
41.91% of 50 DAV
50 DAV is 448,000
|
$42.37
-2.57%
|
12/22/2021
|
$40.04
|
PP = $41.45
|
|
MB = $43.52
|
Most Recent Note - 12/29/2021 3:52:13 PM
Y - Inching into new high territory with today's 6th consecutive small gain lacking great volume conviction. Color code was recently changed to yellow with new pivot point cited based on its 11/08/21 high plus 10 cents. Gains above a stock's pivot point must be backed by at least +40% above average volume to trigger a proper technical buy signal. Its 50 DMA line ($38.74) defines important near-term support to watch on pullbacks.
>>> FEATURED STOCK ARTICLE : Formed New 5-Week Base and Perched Near Pivot Point - 12/22/2021 |
View all notes |
Set NEW NOTE alert |
Company Profile |
SEC
News |
Chart |
Request a new note
C
A
S
I |
WDAY
-
NYSE
Workday Inc Cl A
Computer Sftwr-Enterprse
|
$276.50
|
+0.75
0.27% |
$279.57
|
886,945
56.01% of 50 DAV
50 DAV is 1,583,600
|
$307.81
-10.17%
|
9/7/2021
|
$275.69
|
PP = $282.87
|
|
MB = $297.01
|
Most Recent Note - 12/29/2021 4:03:53 PM
G - Its current Relative Strength Rating is 77, still the 80+ minimum guideline for buy candidates. Still lingering below its 50 DMA line ($282) which has acted as resistance. A rebound above the 50 DMA line is needed for its outlook to improve. Prior low ($258.22 on 12/06/21) and 200 DMA line ($254.85) define the next important support to watch. Reported Oct '21 quarterly earnings +28% on +20% sales revenues versus the year ago period. Fundamentals remain strong.
>>> FEATURED STOCK ARTICLE : Relative Strength Rating Fell While Sputtering Below 50 DMA Line - 12/23/2021 |
View all notes |
Set NEW NOTE alert |
Company Profile |
SEC
News |
Chart |
Request a new note
C
A
S
I |
TTD
-
NASDAQ
The Trade Desk Inc Cl A
Comml Svcs-Advertising
|
$94.27
|
+1.70
1.84% |
$95.55
|
2,085,402
39.10% of 50 DAV
50 DAV is 5,334,000
|
$114.09
-17.37%
|
11/9/2021
|
$95.16
|
PP = $90.00
|
|
MB = $94.50
|
Most Recent Note - 12/29/2021 3:54:48 PM
G - Consolidating above the prior high ($90) and finding prompt support near its 50 DMA line ($91). Recent resilience has helped its outlook improve, but it faces resistance due to overhead supply up to the $114 level.
>>> FEATURED STOCK ARTICLE : Quietly Slumping Into Prior Base and Below 50-Day Moving Average - 12/20/2021 |
View all notes |
Set NEW NOTE alert |
Company Profile |
SEC
News |
Chart |
Request a new note
C
A
S
I |
MEDP
-
NASDAQ
Medpace Holdings Inc
Medical-Research Eqp/Svc
|
$219.08
|
-1.39
-0.63% |
$222.14
|
84,937
48.81% of 50 DAV
50 DAV is 174,000
|
$231.00
-5.16%
|
9/10/2021
|
$196.32
|
PP = $196.22
|
|
MB = $206.03
|
Most Recent Note - 12/28/2021 6:14:57 PM
G - Pulled back today after rebounding near the prior high. Found support near its 50 DMA line ($213.30) recently, and prior highs in the $199 area also define important near-term support to watch. More damaging losses may trigger a worrisome technical sell signal. See the latest FSU analysis for more details and a new annotated graph. Recently noted repeatedly - "Sep '21 earnings rose +18% on +28% sales revenues versus the year ago period, below the +25% minimum earnings guideline (C criteria), raising fundamental concerns.
>>> FEATURED STOCK ARTICLE : Pulling Back After Rebounding Near High - 12/28/2021 |
View all notes |
Set NEW NOTE alert |
Company Profile |
SEC
News |
Chart |
Request a new note
C
A
S
I |
AVTR
-
NYSE
Avantor Inc
Medical-Research Eqp/Svc
|
$42.01
|
+0.27
0.65% |
$42.42
|
1,798,086
47.27% of 50 DAV
50 DAV is 3,804,000
|
$44.37
-5.32%
|
12/27/2021
|
$41.96
|
PP = $44.47
|
|
MB = $46.69
|
Most Recent Note - 12/27/2021 5:26:44 PM
Y - Color code is changed to yellow with new pivot point cited based on its 9/23/21 high plus 10 cents. Posted a 4th consecutive gain today with lighter volume. Consolidating above its 50 DMA line ($39.16) and it faces little overhead supply up to the $44 level. Subsequent gains above the pivot point backed by at least +40% above average volume may trigger a new technical buy signal. Prior lows in the high $36 area define important near-term support. Reported Sep '21 quarterly earnings +46% above the year ago period.
>>> FEATURED STOCK ARTICLE : Rebounding With Volume-Driven Gains - 12/21/2021 |
View all notes |
Set NEW NOTE alert |
Company Profile |
SEC
News |
Chart |
Request a new note
C
A
S
I |
Symbol/Exchange
Company Name
Industry Group |
PRICE |
CHANGE
(%Change) |
Day High |
Volume
(% DAV)
(% 50 day avg vol) |
52 Wk Hi
% From Hi |
Featured
Date |
Price
Featured |
Pivot Featured |
|
Max Buy |