You are not logged in.
This means you
CAN ONLY VIEW reports that were published prior to Monday, March 31, 2025.
You
MUST UPGRADE YOUR MEMBERSHIP if you want to see any current reports.
AFTER MARKET UPDATE - THURSDAY, DECEMBER 23RD, 2021
Previous After Market Report Next After Market Report >>>
|
|
|
|
DOW |
+261.19 |
35,753.89 |
+0.74% |
|
Volume |
715,352,954 |
-26% |
|
Volume |
4,016,742,500 |
-11% |
|
NASDAQ |
+180.81 |
15,521.89 |
+1.18% |
|
Advancers |
2,448 |
74% |
|
Advancers |
2,787 |
60% |
|
S&P 500 |
+47.33 |
4,696.56 |
+1.02% |
|
Decliners |
840 |
26% |
|
Decliners |
1,819 |
39% |
|
Russell 2000 |
+18.96 |
2,221.90 |
+0.86% |
|
52 Wk Highs |
59 |
|
|
52 Wk Highs |
58 |
|
|
S&P 600 |
+15.08 |
1,378.93 |
+1.11% |
|
52 Wk Lows |
56 |
|
|
52 Wk Lows |
137 |
|
|
 |
Major Indices Quietly Rose Ahead of Holiday Break
Kenneth J. Gruneisen - Passed the CAN SLIM® Master's Exam
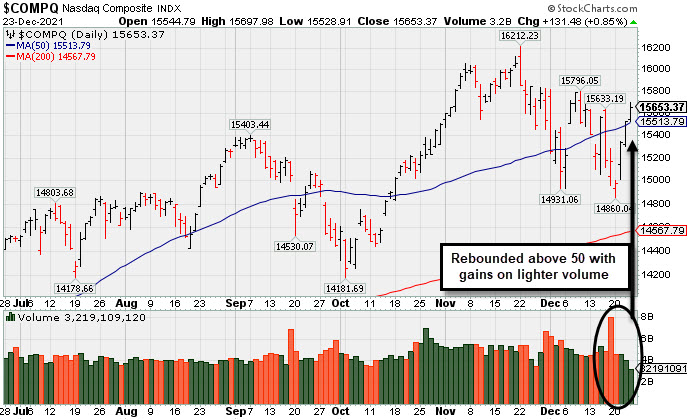
The S&P 500 closed at a fresh record high. The broad benchmark added 0.6%, capping a weekly gain of 2.3%. The Dow rose 196 points, bringing the blue chip index 1.7% higher on the week. The Nasdaq Composite advanced 0.9%, ending the holiday-shortened week with a 3.2% rally. The volume totals reported were lighter than the prior session on the NYSE and on the Nasdaq exchange. Breadth was clearly positive as advancers led decliners by almost a 3-1 margin on the NYSE and by a 3-2 margin on the Nasdaq exchange. Leadership improved as there were 40 high-ranked companies from the Leaders List that hit new 52-week highs and were listed on the BreakOuts Page, versus the total of 27 on the prior session. New 52-week highs just outnumbered new 52-week lows on the NYSE, but new lows still outnumbered new highs on the Nasdaq exchange. The market averages (M criteria) are in an uptrend under pressure. New buying efforts are to be carefully made under the fact-based investment system's strict criteria.
 PICTURED: The Nasdaq Composite Index posted a 3rd consecutive gain with even lighter volume and rebounded above its 50-day moving average on Thursday. The weak action of its prior losses did not undercut its prior low, technically keeping the latest brief rally alive. No rally is sustainable without a healthy crop of stocks leading the way and hitting new 52-week highs, so the latest expansion in new highs and technical improvements are reassuring signs.
U.S. stocks climbed for a third consecutive session on Thursday, with risk sentiment buoyed as preliminary data from several studies showed the rapidly spreading Omicron coronavirus variant is less likely to lead to hospitalization. Additionally, Novavax Inc. (NVAX -3.30%) became the latest COVID-19 vaccine maker to report the efficacy of its inoculation against the new strain. Treasuries declined amid the perceived risk on mood, with the yield on the 10-year note jumping four basis points (0.04%) to 1.49%. Nine of 11 S&P 500 sectors finished in positive territory, with Real Estate and Utilities the only laggards. In commodities, WTI crude rose 1.5% to $73.88/barrel, to cap a 4.2% weekly gain.
Investors also assessed a deluge of economic data ahead of the holiday break. An update showed personal spending advanced 0.6% in November, in-line with expectations and easing from the prior reading (+1.4%). The core PCE deflator (the Federal Reserve’s preferred proxy for inflation) surged a more-than-anticipated 4.7% year-over-year in November, accelerating from October’s upwardly revised 4.2% annual pace. Separately, initial jobless claims came in at 205,000 in the latest week, unchanged from the prior period. Meanwhile, the University of Michigan’s final December reading of consumer sentiment improved to 70.6, confirming a rebound from November’s decade low figure of 67.4. |
 Kenneth J. Gruneisen started out as a licensed stockbroker in August 1987, a couple of months prior to the historic stock market crash that took the Dow Jones Industrial Average down -22.6% in a single day. He has published daily fact-based fundamental and technical analysis on high-ranked stocks online for two decades. Through FACTBASEDINVESTING.COM, Kenneth provides educational articles, news, market commentary, and other information regarding proven investment systems that work in good times and bad.
Comments contained in the body of this report are technical opinions only and are not necessarily those of Gruneisen Growth Corp. The material herein has been obtained from sources believed to be reliable and accurate, however, its accuracy and completeness cannot be guaranteed. Our firm, employees, and customers may effect transactions, including transactions contrary to any recommendation herein, or have positions in the securities mentioned herein or options with respect thereto. Any recommendation contained in this report may not be suitable for all investors and it is not to be deemed an offer or solicitation on our part with respect to the purchase or sale of any securities. |
|
 |
Financial, Tech, and Gold & Silver Indexes Rose
Kenneth J. Gruneisen - Passed the CAN SLIM® Master's Exam
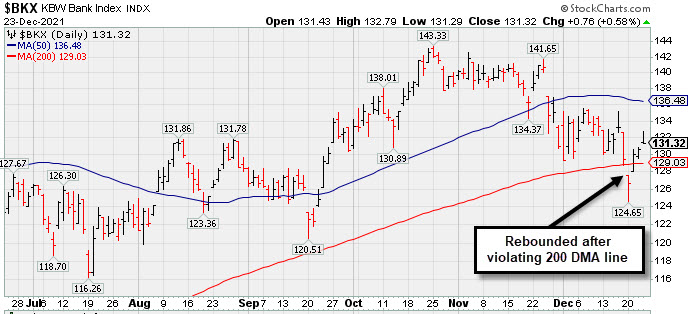
The Broker/Dealer Index ($XBD +0.99%) and Bank Index ($BKX +0.58%) both posted modest gains and the Retail Index ($RLX +0.20%) inched higher. The tech sector had a positive bias as the Semiconductor Index ($SOX +1.04%), Networking Index ($NWX +1.12%), and ) Biotech Index ($BTK +0.82%) posted unanimous gains. The Gold & Silver Index ($XAU +0.78%) posted a solid gain while the Oil Services Index ($OSX -0.07%) and Integrated Oil Index ($XOI +0.17%) both were little changed.PICTURED: The Bank Index ($BKX +0.58%) promptly rebounded above its 200-day moving average (DMA) line but remains well below its 50 DMA line.
| Oil Services |
$OSX |
53.18 |
-0.04 |
-0.07% |
+19.95% |
| Integrated Oil |
$XOI |
1,166.89 |
+1.96 |
+0.17% |
+47.25% |
| Semiconductor |
$SOX |
3,932.39 |
+40.47 |
+1.04% |
+40.67% |
| Networking |
$NWX |
955.99 |
+10.56 |
+1.12% |
+33.31% |
| Broker/Dealer |
$XBD |
488.93 |
+4.81 |
+0.99% |
+29.48% |
| Retail |
$RLX |
4,211.45 |
+8.27 |
+0.20% |
+18.19% |
| Gold & Silver |
$XAU |
130.61 |
+1.01 |
+0.78% |
-9.42% |
| Bank |
$BKX |
131.32 |
+0.76 |
+0.58% |
+34.13% |
| Biotech |
$BTK |
5,649.54 |
+46.15 |
+0.82% |
-1.56% |
|
|
|
 |
Relative Strength Rating Fell While Sputtering Below 50 DMA Line
Kenneth J. Gruneisen - Passed the CAN SLIM® Master's Exam
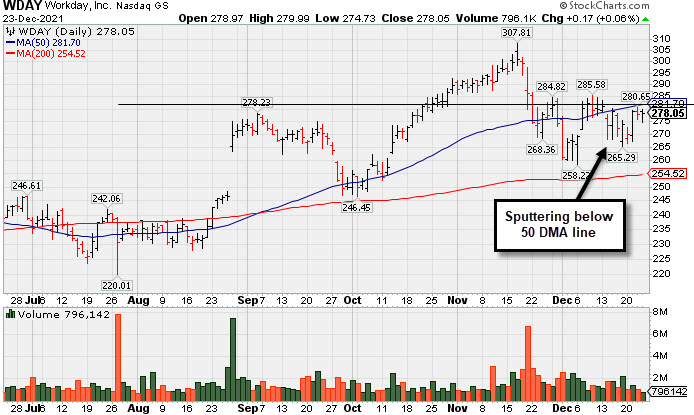
Workday Inc Cl A (WDAY +$0.17 or +0.06% to $278.05) has seen its Relative Strength Rating slump to 73, below the 80+ minimum guideline for buy candidates while recently sputtering just below its 50-day moving average (DMA) line ($281.70). A rebound above the 50 DMA line and improvement in that RS rank is needed for its outlook to improve. The prior low ($258.22 on 12/06/21) and 200 DMA line ($253.70) define the next important support to watch.
It has a 93 Earnings Per Share Rating as fundamentals remain strong. WDAY reported Oct '21 quarterly earnings +28% on +20% sales revenues versus the year ago period, its 6th consecutive quarterly comparison well above the +25% minimum guideline (C criteria). Its annual earnings (A criteria) history has also been strong and steady. It has a Timeliness Rating of C and Sponsorship Rating of B.
WDAY was highlighted in yellow with pivot point cited based on its 2/16/21 high plus 10 cents in the 9/07/21 mid-day report (read here). It was shown in detail with an annotated graph on 11/16/21 under the headline, "Getting Extended From Previously Noted Base". WDAY hails from the Computer Software-Enterprise group which is ranked 115th on the 197 Industry Groups list (L criteria). There are 191.1 million shares in the public float (S criteria). The number of top-rated funds owning its shares rose from 1,560 in Sep '20 to 1,833 in Sep '21, a reassuring sign concerning the I criteria. Its current Up/Down Volume Ratio of 1.2 is an unbiased indication its shares have been under slight accumulation over the past 50 days. |
|
|
Color Codes Explained :
Y - Better candidates highlighted by our
staff of experts.
G - Previously featured
in past reports as yellow but may no longer be buyable under the
guidelines.
***Last / Change / Volume data in this table is the closing quote data***
Symbol/Exchange
Company Name
Industry Group |
PRICE |
CHANGE
(%Change) |
Day High |
Volume
(% DAV)
(% 50 day avg vol) |
52 Wk Hi
% From Hi |
Featured
Date |
Price
Featured |
Pivot Featured |
|
Max Buy |
 BLDR
-
NYSE
BLDR
-
NYSE
Builders Firstsource Inc
Bldg-Constr Prds/Misc
|
$82.15
|
+1.09
1.34% |
$82.90
|
2,382,800
94.00% of 50 DAV
50 DAV is 2,535,000
|
$81.43
0.88%
|
8/12/2021
|
$52.38
|
PP = $54.09
|
|
MB = $56.79
|
Most Recent Note - 12/22/2021 5:12:05 PM
G - Posted a 2nd consecutive gain today with near average volume and hit a new all-time high. Very extended from any sound base. Reported Sep '21 quarterly earnings +308% on +140% sales revenues versus the year ago period. It is well above its 50 DMA line ($67.95) defines near-term support to watch.
>>> FEATURED STOCK ARTICLE : Perched at Record High After +52% Rally in 4 Months - 12/10/2021 |
View all notes |
Set NEW NOTE alert |
Company Profile |
SEC
News |
Chart |
Request a new note
C
A
S
I |
KFRC
-
NASDAQ
Kforce Inc
Comml Svcs-Staffing
|
$75.58
|
+1.19
1.60% |
$75.99
|
54,823
48.95% of 50 DAV
50 DAV is 112,000
|
$81.47
-7.23%
|
9/10/2021
|
$59.53
|
PP = $64.48
|
|
MB = $67.70
|
Most Recent Note - 12/21/2021 6:06:19 PM
G - Prior low ($71.05 on 12/14/21) defines important near-term support after finding prompt support at its 50 DMA line ($72.25). Recently reported Sep '21 quarterly earnings +8% on +10% sales revenues versus the year ago period, below the +25% minimum earnings guideline (C criteria), raising fundamental concerns.
>>> FEATURED STOCK ARTICLE : Extended From Base and Latest Quarter Earnings Growth Sub Par - 11/19/2021 |
View all notes |
Set NEW NOTE alert |
Company Profile |
SEC
News |
Chart |
Request a new note
C
A
S
I |
REGN
-
NASDAQ
Regeneron Pharmaceutical
DRUGS - Biotechnology
|
$625.38
|
+7.90
1.28% |
$627.22
|
397,855
48.79% of 50 DAV
50 DAV is 815,400
|
$686.62
-8.92%
|
12/13/2021
|
$647.95
|
PP = $686.72
|
|
MB = $721.06
|
Most Recent Note - 12/22/2021 5:20:53 PM
Y - Posted a gain today with below average volume, it halted its slide after recent volume-driven losses undercut its 50 DMA line ($622) raising concerns. Color code was recently changed to yellow with new pivot point cited based on its 9/01/21 high plus 10 cents. Subsequent gains above the pivot point backed by at least +40% above average volume may trigger a technical buy signal. Its Relative Strength rating has slumped to 80, right at the 80+ minimum guideline for buy candidates.
>>> FEATURED STOCK ARTICLE : Consolidating Near All-Time High With Little Resistance Remaining - 12/13/2021 |
View all notes |
Set NEW NOTE alert |
Company Profile |
SEC
News |
Chart |
Request a new note
C
A
S
I |
LLY
-
NYSE
Eli Lilly & Co
Medical-Diversified
|
$273.10
|
+6.60
2.48% |
$275.27
|
2,612,513
81.79% of 50 DAV
50 DAV is 3,194,000
|
$283.91
-3.81%
|
12/16/2021
|
$279.28
|
PP = $275.97
|
|
MB = $289.77
|
 Most Recent Note - 12/23/2021 5:35:38 PM
Y - Posted a quiet 3rd consecutive gain today, closing the week perched near its all-time high. Finished strong after highlighted in yellow in the 12/16/21 mid-day report with pivot point cited based on its 8/17/21 high plus 10 cents. This giant Medical - Diversified firm triggered a technical buy signal as it powered to new all-time highs with +78% above average volume behind its 5th consecutive gain after a choppy 17-week consolidation. Reported Sep '21 quarterly earnings +38% on +18% sales revenues versus the year ago period, and 3 of the past 4 quarterly comparisons were above the +25% minimum earnings guideline (C criteria). Annual earnings (A criteria) improved steadily since a downturn in FY '14.
>>> FEATURED STOCK ARTICLE : Eli Lilly & Co Powered to New Highs With Volume - 12/16/2021 |
View all notes |
Set NEW NOTE alert |
Company Profile |
SEC
News |
Chart |
Request a new note
C
A
S
I |
CAMT
-
NASDAQ
Camtek Ltd
ELECTRONICS - Scientific and Technical Instrum
|
$43.80
|
+0.78
1.81% |
$43.97
|
84,825
32.50% of 50 DAV
50 DAV is 261,000
|
$49.60
-11.69%
|
11/9/2021
|
$45.43
|
PP = $46.11
|
|
MB = $48.42
|
Most Recent Note - 12/22/2021 5:13:37 PM
G - Posted a quiet gain today closing just above its 50 DMA line ($42.81). Faces some resistance due to overhead supply up to the $49 level. Fundamentals remain strong.
>>> FEATURED STOCK ARTICLE : Closed Above 50-Day Average After Big Gain With Light Volume - 12/15/2021 |
View all notes |
Set NEW NOTE alert |
Company Profile |
SEC
News |
Chart |
Request a new note
C
A
S
I |
Symbol/Exchange
Company Name
Industry Group |
PRICE |
CHANGE
(%Change) |
Day High |
Volume
(% DAV)
(% 50 day avg vol) |
52 Wk Hi
% From Hi |
Featured
Date |
Price
Featured |
Pivot Featured |
|
Max Buy |
AMD
-
NASDAQ
Advanced Micro Devices
ELECTRONICS - Semiconductor - Broad Line
|
$146.14
|
+2.26
1.57% |
$149.02
|
48,461,925
84.07% of 50 DAV
50 DAV is 57,645,000
|
$164.46
-11.14%
|
10/27/2021
|
$124.91
|
PP = $122.59
|
|
MB = $128.72
|
Most Recent Note - 12/21/2021 5:57:32 PM
G - Posted a big gain today with average volume as it rallied off of Its 50 DMA line ($136.87). The prior low ($130.60 on 12/14/21) defines the next important near term support where a violations may trigger a more worrisome technical sell signal. Fundamentals remain strong after it reported Sep '21 quarterly earnings +78% on +54% sales revenues versus the year ago period.
>>> FEATURED STOCK ARTICLE : AMD Pulling Back After Considerable Rally - 12/1/2021 |
View all notes |
Set NEW NOTE alert |
Company Profile |
SEC
News |
Chart |
Request a new note
C
A
S
I |
UMC
-
NYSE
United Microelectrnc Adr
ELECTRONICS - Semiconductor - Integrated Cir
|
$11.58
|
-0.05
-0.43% |
$11.67
|
3,459,470
43.27% of 50 DAV
50 DAV is 7,995,000
|
$12.68
-8.68%
|
12/1/2021
|
$12.60
|
PP = $12.72
|
|
MB = $13.36
|
Most Recent Note - 12/21/2021 6:02:20 PM
Y - Posted a gain today with lighter volume. Recently retesting support near its 50 DMA line ($11.09). More damaging losses would raise concerns. A gain and solid close above the pivot point may help clinch a proper new (or add-on) technical buy signal. Reported Sep '21 quarterly earnings +100% on +30% sales revenues versus the year ago period.
>>> FEATURED STOCK ARTICLE : Rebound Above 50-Day Moving Average Showed Resilience - 11/30/2021 |
View all notes |
Set NEW NOTE alert |
Company Profile |
SEC
News |
Chart |
Request a new note
C
A
S
I |
ENTG
-
NASDAQ
Entegris Inc
ELECTRONICS - Semiconductor Equipment and Mate
|
$136.78
|
+3.31
2.48% |
$137.48
|
866,313
73.11% of 50 DAV
50 DAV is 1,185,000
|
$158.00
-13.43%
|
8/4/2021
|
$125.33
|
PP = $126.51
|
|
MB = $132.84
|
Most Recent Note - 12/23/2021 5:34:19 PM
G - Posted a 3rd consecutive gain today with lighter volume after damaging volume-driven losses. A rebound above the 50 DMA line ($143) is needed for its outlook to improve. Fundamentals remain strong after it recently reported Sep '21 quarterly earnings +37% on +20% sales revenues versus the year ago period.
>>> FEATURED STOCK ARTICLE : Best Ever Close After Volume-Driven Gain - 11/29/2021 |
View all notes |
Set NEW NOTE alert |
Company Profile |
SEC
News |
Chart |
Request a new note
C
A
S
I |
DHR
-
NYSE
Danaher Corp
Medical-Diversified
|
$320.79
|
+1.11
0.35% |
$322.48
|
1,209,288
44.85% of 50 DAV
50 DAV is 2,696,000
|
$333.96
-3.94%
|
12/16/2021
|
$321.36
|
PP = $334.06
|
|
MB = $350.76
|
Most Recent Note - 12/22/2021 5:24:03 PM
Y - Posted a gain today with below average volume, consolidating above its 50 DMA line and still perched within striking distance of its 52-week high. Highlighted in yellow with pivot point cited base on its 9/10/21 high plus 10 cents in the 12/16/21 mid-day report. Subsequent gains above the pivot point with at least +40% above average volume may trigger a technical buy signal. Fundamentals remain strong.
>>> FEATURED STOCK ARTICLE : Consolidating Near Prior Highs Above 50-Day Moving Average - 12/17/2021 |
View all notes |
Set NEW NOTE alert |
Company Profile |
SEC
News |
Chart |
Request a new note
C
A
S
I |
SKY
-
NYSE
Skyline Champion Corp
Bldg-Mobile/Mfg andamp; RV
|
$76.21
|
+0.51
0.67% |
$76.64
|
398,432
82.49% of 50 DAV
50 DAV is 483,000
|
$85.92
-11.30%
|
11/3/2021
|
$72.19
|
PP = $66.92
|
|
MB = $70.27
|
Most Recent Note - 12/22/2021 5:09:04 PM
G - Lighter volume was behind today's 2nd gain as it rebounded further above the 50 DMA line ($73.25) helping its outlook improve after 6 consecutive damaging volume-driven losses. The next important near-term support to watch is prior highs in the $66 area. Fundamentals remain strong.
>>> FEATURED STOCK ARTICLE : Pulling Back From All-Time High After Recent Rally - 12/14/2021 |
View all notes |
Set NEW NOTE alert |
Company Profile |
SEC
News |
Chart |
Request a new note
C
A
S
I |
Symbol/Exchange
Company Name
Industry Group |
PRICE |
CHANGE
(%Change) |
Day High |
Volume
(% DAV)
(% 50 day avg vol) |
52 Wk Hi
% From Hi |
Featured
Date |
Price
Featured |
Pivot Featured |
|
Max Buy |
DHI
-
NYSE
D R Horton Inc
MATERIALS and CONSTRUCTION - Residential Construction
|
$104.92
|
-0.66
-0.63% |
$106.21
|
2,660,594
95.29% of 50 DAV
50 DAV is 2,792,000
|
$110.45
-5.01%
|
12/6/2021
|
$104.40
|
PP = $106.99
|
|
MB = $112.34
|
Most Recent Note - 12/22/2021 5:15:49 PM
Y - Posted a 2nd consecutive gain with below average volume. Showed stalling action since highlighted in yellow with pivot point cited based on its 5/10/21 high plus 10 cents in the 12/06/21 mid-day report. Reported Sep '21 earnings +68% on +27% sales revenues versus the year-ago period, its 8th strong quarterly comparison above the +25% minimum guideline (C criteria). Annual earnings growth (A criteria) has been strong.
>>> FEATURED STOCK ARTICLE : Builder Built a Solid Base And Challenged Prior High - 12/6/2021 |
View all notes |
Set NEW NOTE alert |
Company Profile |
SEC
News |
Chart |
Request a new note
C
A
S
I |
TITN
-
NASDAQ
Titan Machinery Inc
SPECIALTY RETAIL
|
$32.18
|
+0.38
1.19% |
$32.49
|
95,921
55.77% of 50 DAV
50 DAV is 172,000
|
$38.58
-16.59%
|
11/23/2021
|
$36.22
|
PP = $35.34
|
|
MB = $37.11
|
Most Recent Note - 12/23/2021 5:32:26 PM
G - Prompt rebound above the 50 DMA line ($31.57) helped its outlook improve. Faces resistance due to overhead supply up to the $38 level. Reported Oct '21 quarterly earnings +81% on +26% sales revenues over the year ago period, its 4th strong quarterly comparison.
>>> FEATURED STOCK ARTICLE : Strong Close With Gain Backed by +467% Above Average Volume - 11/23/2021 |
View all notes |
Set NEW NOTE alert |
Company Profile |
SEC
News |
Chart |
Request a new note
C
A
S
I |
CLFD
-
NASDAQ
Clearfield Inc
TELECOMMUNICATIONS - Cables / Satalite Equipment
|
$78.54
|
+3.80
5.08% |
$79.25
|
188,534
141.75% of 50 DAV
50 DAV is 133,000
|
$76.07
3.25%
|
12/16/2021
|
$72.76
|
PP = $72.10
|
|
MB = $75.71
|
Most Recent Note - 12/23/2021 12:18:04 PM
Y - Hitting another new all-time high with today's early gain, getting extended beyond its "max buy" level. New pivot point cited was based on its 11/15/21 high plus 10 cents. Recently formed a "square box" base as it found support well above its 50 DMA line ($63.10) when consolidating. A gain and close above the pivot point on 12/21/21 backed by +72% above average volume triggered a new (or add-on) technical buy signal. Reported Sep '21 quarterly earnings +141% on +66% sales revenues above the year ago period.
>>> FEATURED STOCK ARTICLE : Perched Near High Extended From Any Sound Base - 11/22/2021 |
View all notes |
Set NEW NOTE alert |
Company Profile |
SEC
News |
Chart |
Request a new note
C
A
S
I |
ODFL
-
NASDAQ
Old Dominion Fght Line
TRANSPORTATION - Trucking
|
$348.31
|
+4.28
1.24% |
$349.34
|
392,864
63.16% of 50 DAV
50 DAV is 622,000
|
$373.58
-6.76%
|
12/7/2021
|
$365.61
|
PP = $364.17
|
|
MB = $382.38
|
Most Recent Note - 12/23/2021 5:37:35 PM
Y - Its color code is changed to yellow after a prompt rebound above the 50 DMA line ($344) this week helped its outlook improve. Still faces near term resistance up to the $373 level after several weeks of trading at higher levels.
>>> FEATURED STOCK ARTICLE : Perched at All Time High After Tight Consolidation Several Weeks - 12/7/2021 |
View all notes |
Set NEW NOTE alert |
Company Profile |
SEC
News |
Chart |
Request a new note
C
A
S
I |
SMPL
-
NASDAQ
Simply Good Foods Co
Food-Confectionery
|
$40.77
|
+0.73
1.82% |
$40.91
|
479,600
111.02% of 50 DAV
50 DAV is 432,000
|
$41.35
-1.40%
|
12/22/2021
|
$40.04
|
PP = $41.45
|
|
MB = $43.52
|
Most Recent Note - 12/22/2021 4:58:47 PM
Y - Color code is changed to yellow with new pivot point cited based on its 11/08/21 high plus 10 cents. Consolidating above its 50 DMA line ($38.22). The prior low and 200 DMA line ($35.62) define the next important support. See he latest FSU analysis for more details and a new annotated graph.
>>> FEATURED STOCK ARTICLE : Formed New 5-Week Base and Perched Near Pivot Point - 12/22/2021 |
View all notes |
Set NEW NOTE alert |
Company Profile |
SEC
News |
Chart |
Request a new note
C
A
S
I |
Symbol/Exchange
Company Name
Industry Group |
PRICE |
CHANGE
(%Change) |
Day High |
Volume
(% DAV)
(% 50 day avg vol) |
52 Wk Hi
% From Hi |
Featured
Date |
Price
Featured |
Pivot Featured |
|
Max Buy |
WDAY
-
NYSE
Workday Inc Cl A
Computer Sftwr-Enterprse
|
$278.05
|
+0.17
0.06% |
$279.99
|
794,669
48.42% of 50 DAV
50 DAV is 1,641,300
|
$307.81
-9.67%
|
9/7/2021
|
$275.69
|
PP = $282.87
|
|
MB = $297.01
|
Most Recent Note - 12/23/2021 5:30:18 PM
G - Its Relative Strength Rating has fallen to 73, below the 80+ minimum guideline for buy candidates while recently sputtering just below its 50 DMA line ($281.70). A rebound above the 50 DMA line is needed for its outlook to improve. Prior low ($258.22 on 12/06/21) and 200 DMA line ($254.52) define the next important support to watch. Reported Oct '21 quarterly earnings +28% on +20% sales revenues versus the year ago period. Fundamentals remain strong. See the latest FSU analysis for more details and a new annotated graph.
>>> FEATURED STOCK ARTICLE : Relative Strength Rating Fell While Sputtering Below 50 DMA Line - 12/23/2021 |
View all notes |
Set NEW NOTE alert |
Company Profile |
SEC
News |
Chart |
Request a new note
C
A
S
I |
TTD
-
NASDAQ
The Trade Desk Inc Cl A
Comml Svcs-Advertising
|
$96.05
|
+2.56
2.74% |
$96.62
|
3,072,815
56.71% of 50 DAV
50 DAV is 5,418,000
|
$114.09
-15.81%
|
11/9/2021
|
$95.16
|
PP = $90.00
|
|
MB = $94.50
|
Most Recent Note - 12/23/2021 5:33:24 PM
G - Today's gain with below average volume helped it rebound further above the prior high ($90) after finding prompt support near its 50 DMA line ($90). Recent resilience has helped its outlook improve, but it faces overhead supply up to the $114 level.
>>> FEATURED STOCK ARTICLE : Quietly Slumping Into Prior Base and Below 50-Day Moving Average - 12/20/2021 |
View all notes |
Set NEW NOTE alert |
Company Profile |
SEC
News |
Chart |
Request a new note
C
A
S
I |
MEDP
-
NASDAQ
Medpace Holdings Inc
Medical-Research Eqp/Svc
|
$223.37
|
+1.59
0.72% |
$224.85
|
134,511
78.20% of 50 DAV
50 DAV is 172,000
|
$231.00
-3.30%
|
9/10/2021
|
$196.32
|
PP = $196.22
|
|
MB = $206.03
|
Most Recent Note - 12/21/2021 6:11:26 PM
G - Found support near its 50 DMA line ($210) recently, and prior highs in the $199 area also define important near-term support to watch. More damaging losses may trigger a worrisome technical sell signal. Recently noted repeatedly - "Sep '21 earnings rose +18% on +28% sales revenues versus the year ago period, below the +25% minimum earnings guideline (C criteria), raising fundamental concerns.
>>> FEATURED STOCK ARTICLE : Medpace Hovering at High With Volume Totals Cooling - 11/17/2021 |
View all notes |
Set NEW NOTE alert |
Company Profile |
SEC
News |
Chart |
Request a new note
C
A
S
I |
AVTR
-
NYSE
Avantor Inc
Medical-Research Eqp/Svc
|
$41.25
|
+0.15
0.36% |
$41.46
|
2,357,516
59.99% of 50 DAV
50 DAV is 3,930,000
|
$44.37
-7.03%
|
6/10/2021
|
$32.94
|
PP = $34.09
|
|
MB = $35.79
|
Most Recent Note - 12/21/2021 5:55:21 PM
G - Posted a 3rd solid volume-driven gain in the span of 5 session, rebounding further above its 50 DMA line ($39) helping its technical stance improve. Faces overhead supply up to the $44 level. Prior lows in the high $36 area define important near-term support. Reported Sep '21 quarterly earnings +46% above the year ago period. Completed a Secondary Offering on 9/13/21. See the latest FSU analysis for more details and a new annotated graph.
>>> FEATURED STOCK ARTICLE : Rebounding With Volume-Driven Gains - 12/21/2021 |
View all notes |
Set NEW NOTE alert |
Company Profile |
SEC
News |
Chart |
Request a new note
C
A
S
I |
|
|
|
THESE ARE NOT BUY RECOMMENDATIONS!
Comments contained in the body of this report are technical
opinions only. The material herein has been obtained
from sources believed to be reliable and accurate, however,
its accuracy and completeness cannot be guaranteed.
This site is not an investment advisor, hence it does
not endorse or recommend any securities or other investments.
Any recommendation contained in this report may not
be suitable for all investors and it is not to be deemed
an offer or solicitation on our part with respect to
the purchase or sale of any securities. All trademarks,
service marks and trade names appearing in this report
are the property of their respective owners, and are
likewise used for identification purposes only.
This report is a service available
only to active Paid Premium Members.
You may opt-out of receiving report notifications
at any time. Questions or comments may be submitted
by writing to Premium Membership Services 665 S.E. 10 Street, Suite 201 Deerfield Beach, FL 33441-5634 or by calling 1-800-965-8307
or 954-785-1121.
|
|
|