You are not logged in.
This means you
CAN ONLY VIEW reports that were published prior to Thursday, March 20, 2025.
You
MUST UPGRADE YOUR MEMBERSHIP if you want to see any current reports.
AFTER MARKET UPDATE - FRIDAY, DECEMBER 8TH, 2017
Previous After Market Report Next After Market Report >>>
|
|
|
|
DOW |
+117.68 |
24,329.16 |
+0.49% |
|
Volume |
740,334,470 |
-10% |
|
Volume |
1,811,627,558 |
-7% |
|
NASDAQ |
+27.24 |
6,840.08 |
+0.40% |
|
Advancers |
1,766 |
61% |
|
Advancers |
1,401 |
54% |
|
S&P 500 |
+14.52 |
2,651.50 |
+0.55% |
|
Decliners |
1,150 |
39% |
|
Decliners |
1,202 |
46% |
|
Russell 2000 |
+1.26 |
1,521.72 |
+0.08% |
|
52 Wk Highs |
107 |
|
|
52 Wk Highs |
97 |
|
|
S&P 600 |
-0.42 |
928.11 |
-0.05% |
|
52 Wk Lows |
27 |
|
|
52 Wk Lows |
45 |
|
|
 |
Indices Rose Friday Yet Ended the Week Mixed
Kenneth J. Gruneisen - Passed the CAN SLIM® Master's Exam
For the week, the Dow gained 0.4%, the S&P added more than 0.3% and the Nasdaq fell 0.1%. Stocks finished higher Friday. The Dow gained 117 points to 24329 while the S&P 500 advanced 14 points to 2651. The Nasdaq Composite climbed 27 points to 6840. Volume totals reported were lighter than the prior session totals on the NYSE and on the Nasdaq exchange. Breadth was positive as advancers led decliners by a 3-2 margin on the NYSE and by a 7-6 margin on the Nasdaq exchange. There were 44 high-ranked companies from the Leaders List that made new 52-week highs and were listed on the BreakOuts Page, versus the total of 31 on the prior session. New 52-week highs outnumbered new 52-week lows on the NYSE and on the Nasdaq exchange. The Featured Stocks Page provides the latest analysis on noteworthy high-ranked leaders. Charts used courtesy of www.stockcharts.com
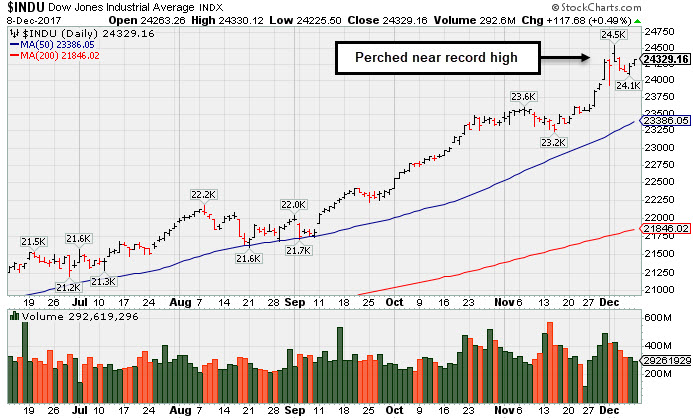 PICTURED: The Dow Jones Industrial Average is perched near its record high.
The major averages (M criteria) are in a confirmed uptrend. Investors should only consider stocks meeting all key criteria of the fact-based investment system as they trigger technical buy signals.
U.S. equities closed out the week on a positive note as Friday’s jobs report exceeded expectations. On the data front, nonfarm payrolls increased by 228,000 in November above projections of a 195,000 addition. The unemployment rate remained unchanged at a 17-year low of 4.1%. A preliminary reading from the University of Michigan revealed consumer sentiment cooled for the second consecutive month in December. Monetary policy will be in focus next week as the Fed is expected to raise its key benchmark rate for the third time in 2017.
Ten of 11 S&P 500 sectors finished higher. Healthcare shares led the advance as Alexion Pharmaceuticals (ALXN +7.19%) and Celgene Corp (CELG +3.27%) rose. Telecom stocks outperformed as AT&T (T +1.55%) and Verizon (VZ +1.33%) rose. The Energy sector provided a tailwind to the market as Schlumberger (SLB +2.37%) rose in sympathy with oil prices. Beverage maker Coca-Cola (KO -1.03%) underperformed as shares fell.
Treasuries were little changed. The yield on the benchmark 10-year note finished up one basis point to 2.38%. In commodities, NYMEX WTI crude added 1.2% to $57.35. COMEX gold lost 0.3% to $1249.70 amid a stronger dollar.
|
 Kenneth J. Gruneisen started out as a licensed stockbroker in August 1987, a couple of months prior to the historic stock market crash that took the Dow Jones Industrial Average down -22.6% in a single day. He has published daily fact-based fundamental and technical analysis on high-ranked stocks online for two decades. Through FACTBASEDINVESTING.COM, Kenneth provides educational articles, news, market commentary, and other information regarding proven investment systems that work in good times and bad.
Comments contained in the body of this report are technical opinions only and are not necessarily those of Gruneisen Growth Corp. The material herein has been obtained from sources believed to be reliable and accurate, however, its accuracy and completeness cannot be guaranteed. Our firm, employees, and customers may effect transactions, including transactions contrary to any recommendation herein, or have positions in the securities mentioned herein or options with respect thereto. Any recommendation contained in this report may not be suitable for all investors and it is not to be deemed an offer or solicitation on our part with respect to the purchase or sale of any securities. |
|
 |
Financial, Retail, Biotech, and Commodity-Linked Groups Rose
Kenneth J. Gruneisen - Passed the CAN SLIM® Master's Exam
The Broker/Dealer Index ($XBD +0.77%), Bank Index ($BKX +0.66%), and the Retail Index ($RLX +0.78%) ended unanimously higher on Friday. The tech sector had a positive bias as the Biotechnology Index ($BTK +1.22%) and the Networking Index ($NWX +0.28%) rose, but the Semiconductor Index ($SOX -0.50%) edged lower. Commodity-linked groups had a positive bias as the Gold & Silver Index ($XAU +0.62%), Oil Services Index ($OSX +1.09%) and the Integrated Oil Index ($XOI +0.94%) finished higher. Charts courtesy www.stockcharts.com
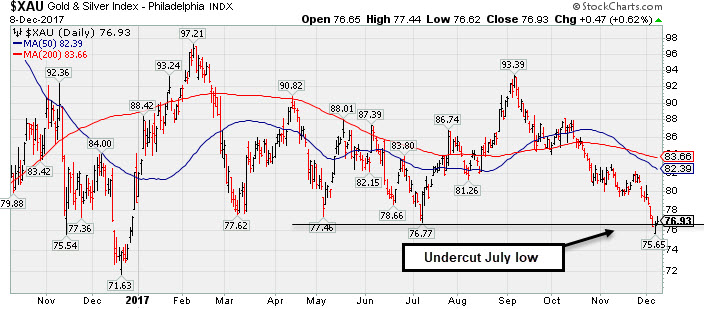 PICTURED: The Gold & Silver Index ($XAU +0.62%) undercut its July low.
| Oil Services |
$OSX |
134.10 |
+1.45 |
+1.09% |
-27.04% |
| Integrated Oil |
$XOI |
1,271.31 |
+11.90 |
+0.94% |
+0.26% |
| Semiconductor |
$SOX |
1,238.24 |
-6.28 |
-0.50% |
+36.60% |
| Networking |
$NWX |
487.85 |
+1.34 |
+0.28% |
+9.36% |
| Broker/Dealer |
$XBD |
263.62 |
+2.03 |
+0.77% |
+28.42% |
| Retail |
$RLX |
1,698.41 |
+13.11 |
+0.78% |
+26.47% |
| Gold & Silver |
$XAU |
76.93 |
+0.47 |
+0.61% |
-2.45% |
| Bank |
$BKX |
106.66 |
+0.70 |
+0.66% |
+16.20% |
| Biotech |
$BTK |
4,232.75 |
+50.98 |
+1.22% |
+37.65% |
|
|
|
 |
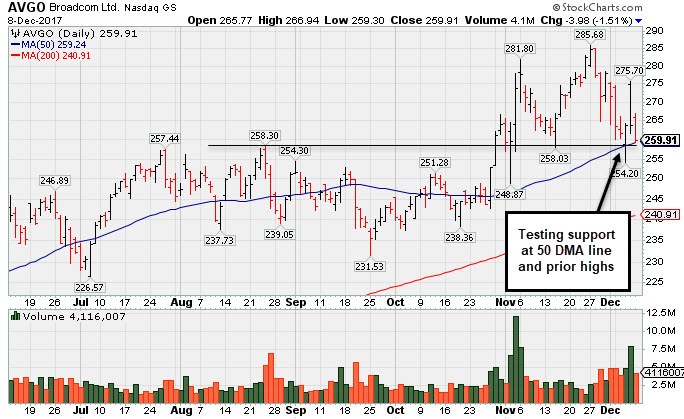
Testing Support at Prior Highs and 50-Day Average
Kenneth J. Gruneisen - Passed the CAN SLIM® Master's Exam
Broadcom Limited (AVGO -$3.98 or -1.51% to $259.91) is testing support near prior highs in the $259 area and its 50-day moving average (DMA) line ($259.91). More damaging losses would raise greater concerns.
Recently it reported earnings +32% on +17% sales revenues for the Oct '17 quarter, its 6th consecutive quarterly earnings increase above the +25% minimum guideline (C criteria). Earnings rose by +29%, +38%, +51%, +46%, and +42%, respectively, in the Jul ,Oct '16, Jan, Apr, and Jul '17 quarterly comparisons versus the year ago periods. Sales revenues rose +119%, +125%, +134%, +18% and +18% during that time span. Its annual earnings (A criteria) history has been strong.
Its current Accumulation/Distribution Rating is C, meanwhile, it has a Timeliness Rating of A and Sponsorship Rating of B. Recently made bids to acquire Qualcomm Inc (QCOM).
This Singapore-based Electronics - Semiconductor firm was last shown in this FSU section on 11/13/17 under the headline, "Consolidating Near Record High Following Volume-Driven Gains ". Other leadership in the Semiconductor group has been a reassuring sign concerning the L criteria. The number of top-rated funds owning its shares rose from 2,095 in Sep '16 to 2,387 in Sep '17, a reassuring sign concerning the I criteria. Its current Up//Down Volume ratio of 1.6 is an unbiased indication its shares have been under accumulation over the past 50 days.
|
|
|
Color Codes Explained :
Y - Better candidates highlighted by our
staff of experts.
G - Previously featured
in past reports as yellow but may no longer be buyable under the
guidelines.
***Last / Change / Volume data in this table is the closing quote data***
Symbol/Exchange
Company Name
Industry Group |
PRICE |
CHANGE
(%Change) |
Day High |
Volume
(% DAV)
(% 50 day avg vol) |
52 Wk Hi
% From Hi |
Featured
Date |
Price
Featured |
Pivot Featured |
|
Max Buy |
THO
-
NYSE
Thor Industries Inc
AUTOMOTIVE - Recreational Vehicles
|
$151.10
|
-0.39
-0.26% |
$151.87
|
422,843
56.45% of 50 DAV
50 DAV is 749,000
|
$156.86
-3.67%
|
8/14/2017
|
$106.67
|
PP = $110.01
|
|
MB = $115.51
|
Most Recent Note - 12/7/2017 5:12:00 PM
G - Hovering near its all-time high, very extended from any sound base. Its 50 DMA line ($134.54) and recent low ($127.29 on 11/08/17) define near-term support to watch. Reported earnings +63% on +31% sales revenues for the Oct '17 quarter, continuing its strong earnings track record. See the latest FSU analysis for more details and a new annotated graph.
>>> FEATURED STOCK ARTICLE : Very Extended From Prior Base and Hovering Near Record High - 12/7/2017 |
View all notes |
Set NEW NOTE alert |
Company Profile |
SEC
News |
Chart |
Request a new note
C
A
S
I |
PFBC
-
NASDAQ
Preferred Bank Los Angls
BANKING - Regional - Pacific Banks
|
$62.78
|
-0.97
-1.52% |
$64.60
|
54,000
68.35% of 50 DAV
50 DAV is 79,000
|
$66.58
-5.71%
|
10/10/2017
|
$59.38
|
PP = $59.08
|
|
MB = $62.03
|
Most Recent Note - 12/5/2017 5:18:09 PM
G - Pulled back today after challenging its prior high with a gap up and volume-driven gain. Found prompt support at its 50 DMA line ($60.37) during its recent consolidation. See the latest FSU analysis for more details and a new annotated graph.
>>> FEATURED STOCK ARTICLE : Challenged High After Finding Support at 50 Day Moving Average - 12/5/2017 |
View all notes |
Set NEW NOTE alert |
Company Profile |
SEC
News |
Chart |
Request a new note
C
A
S
I |
AVGO
-
NASDAQ
Avago Technologies Ltd
ELECTRONICS - Semiconductor - Broad Line
|
$259.91
|
-3.98
-1.51% |
$266.94
|
4,115,905
129.48% of 50 DAV
50 DAV is 3,178,700
|
$285.68
-9.02%
|
10/30/2017
|
$261.19
|
PP = $259.46
|
|
MB = $272.43
|
 Most Recent Note - 12/8/2017 5:04:14 PM
G - Testing support near prior highs in the $259 area and its 50 DMA line. More damaging losses would raise greater concerns. Fundamentals remain strong. See the latest FSU analysis for more details and a new annotated graph.
>>> FEATURED STOCK ARTICLE : Testing Support at Prior Highs and 50-Day Average - 12/8/2017 |
View all notes |
Set NEW NOTE alert |
Company Profile |
SEC
News |
Chart |
Request a new note
C
A
S
I |
YY
-
NASDAQ
YY Inc Ads
INTERNET - Internet Service Providers
|
$105.85
|
-3.76
-3.43% |
$113.67
|
1,556,452
100.09% of 50 DAV
50 DAV is 1,555,000
|
$123.48
-14.28%
|
9/25/2017
|
$80.26
|
PP = $83.10
|
|
MB = $87.26
|
Most Recent Note - 12/7/2017 5:14:38 PM
G - Posted a solid gain today with higher volume. During the recent consolidation it found support above its prior high ($97.59 on 10/16/17) and above its 50 DMA line ($96.48). It is extended from any sound base. Fundamentals remain strong.
>>> FEATURED STOCK ARTICLE : Chinese Social Media Firm Reported Earnings - 11/14/2017 |
View all notes |
Set NEW NOTE alert |
Company Profile |
SEC
News |
Chart |
Request a new note
C
A
S
I |
HTHT
-
NASDAQ
China Lodging Group Ads
LEISURE - Lodging
|
$123.44
|
+4.41
3.70% |
$124.54
|
1,071,864
204.16% of 50 DAV
50 DAV is 525,000
|
$142.80
-13.56%
|
9/29/2016
|
$46.12
|
PP = $47.82
|
|
MB = $50.21
|
Most Recent Note - 12/7/2017 5:21:56 PM
G - Posted a 6th consecutive gain today with higher volume. A rebound above its 50 DMA line ($124.71) still is needed for its outlook to improve. Fundamentals remain strong.
>>> FEATURED STOCK ARTICLE : Weak Technical Action Raises Concerns Despite Strong Fundamentals - 11/29/2017 |
View all notes |
Set NEW NOTE alert |
Company Profile |
SEC
News |
Chart |
Request a new note
C
A
S
I |
Symbol/Exchange
Company Name
Industry Group |
PRICE |
CHANGE
(%Change) |
Day High |
Volume
(% DAV)
(% 50 day avg vol) |
52 Wk Hi
% From Hi |
Featured
Date |
Price
Featured |
Pivot Featured |
|
Max Buy |
PATK
-
NASDAQ
Patrick Industries Inc
Bldg-Mobile/Mfg and RV
|
$98.75
|
+1.05
1.07% |
$99.75
|
67,990
80.94% of 50 DAV
50 DAV is 84,000
|
$102.95
-4.08%
|
10/26/2017
|
$90.90
|
PP = $87.90
|
|
MB = $92.30
|
Most Recent Note - 12/5/2017 11:23:22 AM
G - Perched near its all-time high, extended from its prior base. Its 50 DMA line ($89.03) defines important near-term support to watch. Fundamentals remain strong.
>>> FEATURED STOCK ARTICLE : Best Ever Close After Pullback Found Support Near Prior High - 11/21/2017 |
View all notes |
Set NEW NOTE alert |
Company Profile |
SEC
News |
Chart |
Request a new note
C
A
S
I |
ESNT
-
NYSE
Essent Group Ltd
Finance-MrtgandRel Svc
|
$46.56
|
+0.84
1.84% |
$46.61
|
841,897
90.14% of 50 DAV
50 DAV is 934,000
|
$46.15
0.89%
|
10/9/2017
|
$39.75
|
PP = $41.54
|
|
MB = $43.62
|
Most Recent Note - 12/4/2017 5:47:39 PM
G - Gapped up and quietly hit a new high today. Its 50 DMA line ($42.55) and recent low ($39.79 on 11/03/17) define important near-term support to watch on pullbacks. Fundamentals remain strong.
>>> FEATURED STOCK ARTICLE : Recent Consolidation Was Not a Sufficient Length New Base - 11/20/2017 |
View all notes |
Set NEW NOTE alert |
Company Profile |
SEC
News |
Chart |
Request a new note
C
A
S
I |
FIVE
-
NASDAQ
Five Below Inc
Retail-DiscountandVariety
|
$67.12
|
+0.12
0.18% |
$67.53
|
981,701
101.84% of 50 DAV
50 DAV is 964,000
|
$67.10
0.03%
|
10/6/2017
|
$57.13
|
PP = $54.23
|
|
MB = $56.94
|
Most Recent Note - 12/6/2017 5:51:41 PM
G - Hit yet another new all-time high today with an additional volume-driven gain, getting very extended from its prior base. Its 50 DMA line ($57.61) and prior highs in the $57-58 area define near-term support to watch. Reported earnings +80% on +29% sales revenues for the Oct '17 quarter, continuing its strong earnings track record.
>>> FEATURED STOCK ARTICLE : Getting Extended From Prior Base With Earnings News Due - 11/24/2017 |
View all notes |
Set NEW NOTE alert |
Company Profile |
SEC
News |
Chart |
Request a new note
C
A
S
I |
OLED
-
NASDAQ
Universal Display Corp
Elec-Misc Products
|
$172.70
|
+5.35
3.20% |
$184.80
|
1,948,221
215.27% of 50 DAV
50 DAV is 905,000
|
$192.75
-10.40%
|
8/31/2017
|
$128.22
|
PP = $127.78
|
|
MB = $134.17
|
Most Recent Note - 12/8/2017 1:20:17 PM
G - Gapped up today, rallying on news of a new supply agreement. It has not formed a sound base pattern. Its 50 DMA line ($154.83) and prior high in the $145 area define important near-term support to watch on pullbacks.
>>> FEATURED STOCK ARTICLE : Electronic Products Firm Perched at Record High - 11/17/2017 |
View all notes |
Set NEW NOTE alert |
Company Profile |
SEC
News |
Chart |
Request a new note
C
A
S
I |
ANET
-
NYSE
Arista Networks Inc
TELECOMMUNICATIONS - Communication Equipment
|
$222.79
|
+2.93
1.33% |
$228.97
|
769,678
95.38% of 50 DAV
50 DAV is 807,000
|
$245.65
-9.31%
|
10/27/2017
|
$195.65
|
PP = $196.37
|
|
MB = $206.19
|
Most Recent Note - 12/7/2017 5:23:51 PM
G - Posted a 3rd consecutive gain today with higher volume. The 50 DMA line ($207.70) defines important near-term support above prior highs in the $196 area. Violations may trigger technical sell signals. See the latest FSU analysis for more details and an annotated graph.
>>> FEATURED STOCK ARTICLE : Halted Volume-Driven Pullback at 50-Day Moving Average Line - 12/6/2017 |
View all notes |
Set NEW NOTE alert |
Company Profile |
SEC
News |
Chart |
Request a new note
C
A
S
I |
Symbol/Exchange
Company Name
Industry Group |
PRICE |
CHANGE
(%Change) |
Day High |
Volume
(% DAV)
(% 50 day avg vol) |
52 Wk Hi
% From Hi |
Featured
Date |
Price
Featured |
Pivot Featured |
|
Max Buy |
GRUB
-
NYSE
Grubhub Inc
COMPUTER SOFTWARE and SERVICES - Technical and System Software
|
$68.22
|
-0.72
-1.04% |
$70.15
|
1,112,576
77.91% of 50 DAV
50 DAV is 1,428,000
|
$69.82
-2.29%
|
6/21/2017
|
$47.33
|
PP = $46.94
|
|
MB = $49.29
|
Most Recent Note - 12/5/2017 11:21:47 AM
G - Still very extended from any sound base after wedging higher with gains lacking great volume conviction. Its 50 DMA line ($58.91) and prior highs near $57 define support to watch on pullbacks. Reported Sep '17 quarterly earnings +22% on +32% sales revenues. The 2 latest quarters were below the +25% minimum earnings guideline (C criteria), raising fundamental concerns with regard to the fact-based investment system.
>>> FEATURED STOCK ARTICLE : Extended From Prior Highs After Gains on Light Volume - 11/22/2017 |
View all notes |
Set NEW NOTE alert |
Company Profile |
SEC
News |
Chart |
Request a new note
C
A
S
I |
IBP
-
NYSE
Installed Building Prod
DIVERSIFIED SERVICES - Business/Management Services
|
$72.00
|
-0.65
-0.89% |
$73.75
|
204,534
108.79% of 50 DAV
50 DAV is 188,000
|
$79.40
-9.32%
|
9/19/2017
|
$59.15
|
PP = $60.10
|
|
MB = $63.11
|
Most Recent Note - 12/6/2017 5:49:38 PM
G - Pulling back from its all-time high after getting very extended from any sound base. The prior high ($70.25 on 11/01/17) and its 50 DMA line ($67.67) define important near-term support to watch. Subsequent losses leading to violations may trigger technical sell signals.
>>> FEATURED STOCK ARTICLE : Extended From Any Sound Base After Impressive Rebound and Rally - 12/1/2017 |
View all notes |
Set NEW NOTE alert |
Company Profile |
SEC
News |
Chart |
Request a new note
C
A
S
I |
HQY
-
NASDAQ
"HealthEquity, Inc"
COMPUTER SOFTWARE and SERVICES - Healthcare Information Service
|
$45.72
|
-2.16
-4.51% |
$48.18
|
783,234
181.51% of 50 DAV
50 DAV is 431,500
|
$55.31
-17.34%
|
11/6/2017
|
$54.63
|
PP = $52.87
|
|
MB = $55.51
|
Most Recent Note - 12/8/2017 5:06:18 PM
Sank back below its 200 DMA line with today's volume-driven loss. It will be dropped from the Featured Stocks list tonight. A rebound above the 50 DMA line ($50.33) is still needed for its outlook to improve. Its Relative Strength rating of 44 is now well below the 80+ minimum guideline for buy candidates. Reported earnings +70% on +31% sales revenues for the Oct '17 quarter.
>>> FEATURED STOCK ARTICLE : Sank Below 50-Day Moving Average With Loss on Higher Volume - 12/4/2017 |
View all notes |
Set NEW NOTE alert |
Company Profile |
SEC
News |
Chart |
Request a new note
C
A
S
I |
OLLI
-
NASDAQ
Ollie's Bargain Outlet
Retail-DiscountandVariety
|
$49.90
|
+1.15
2.36% |
$50.00
|
718,435
150.93% of 50 DAV
50 DAV is 476,000
|
$51.53
-3.15%
|
11/21/2017
|
$46.78
|
PP = $47.00
|
|
MB = $49.35
|
Most Recent Note - 12/7/2017 12:30:25 PM
G - Pulling back from its all-time high today after a streak of 8 consecutive gains. Color code was changed to green after rallying above its "max buy" level. Its 50 DMA line ($45.83) and prior lows in the $42 area define important near-term support. Fundamentals remain strong.
>>> FEATURED STOCK ARTICLE : Recently Stalled After Reaching a New High - 11/27/2017 |
View all notes |
Set NEW NOTE alert |
Company Profile |
SEC
News |
Chart |
Request a new note
C
A
S
I |
HLI
-
NYSE
Houlihan Lokey Inc Cl A
Finance-Invest Bnk/Bkrs
|
$44.79
|
+0.53
1.20% |
$44.85
|
86,311
35.23% of 50 DAV
50 DAV is 245,000
|
$45.14
-0.77%
|
9/18/2017
|
$37.04
|
PP = $39.78
|
|
MB = $41.77
|
Most Recent Note - 12/4/2017 5:50:06 PM
G - Posted a quiet gain today for a best-ever close. Perched at its all-time high, extended from any sound base. Its 50 DMA line and prior lows define near-term support in the $41 area. On 10/26/17 it priced a Secondary Offering. Fundamentals remain strong.
>>> FEATURED STOCK ARTICLE : Holding Ground Near Record High - 11/16/2017 |
View all notes |
Set NEW NOTE alert |
Company Profile |
SEC
News |
Chart |
Request a new note
C
A
S
I |
Symbol/Exchange
Company Name
Industry Group |
PRICE |
CHANGE
(%Change) |
Day High |
Volume
(% DAV)
(% 50 day avg vol) |
52 Wk Hi
% From Hi |
Featured
Date |
Price
Featured |
Pivot Featured |
|
Max Buy |
|
|
|
THESE ARE NOT BUY RECOMMENDATIONS!
Comments contained in the body of this report are technical
opinions only. The material herein has been obtained
from sources believed to be reliable and accurate, however,
its accuracy and completeness cannot be guaranteed.
This site is not an investment advisor, hence it does
not endorse or recommend any securities or other investments.
Any recommendation contained in this report may not
be suitable for all investors and it is not to be deemed
an offer or solicitation on our part with respect to
the purchase or sale of any securities. All trademarks,
service marks and trade names appearing in this report
are the property of their respective owners, and are
likewise used for identification purposes only.
This report is a service available
only to active Paid Premium Members.
You may opt-out of receiving report notifications
at any time. Questions or comments may be submitted
by writing to Premium Membership Services 665 S.E. 10 Street, Suite 201 Deerfield Beach, FL 33441-5634 or by calling 1-800-965-8307
or 954-785-1121.
|
|
|