You are not logged in.
This means you
CAN ONLY VIEW reports that were published prior to Thursday, March 20, 2025.
You
MUST UPGRADE YOUR MEMBERSHIP if you want to see any current reports.
AFTER MARKET UPDATE - THURSDAY, DECEMBER 7TH, 2017
Previous After Market Report Next After Market Report >>>
|
|
|
|
DOW |
+70.57 |
24,211.48 |
+0.29% |
|
Volume |
823,674,570 |
+3% |
|
Volume |
1,947,928,250 |
+4% |
|
NASDAQ |
+36.46 |
6,812.84 |
+0.54% |
|
Advancers |
1,824 |
63% |
|
Advancers |
1,440 |
59% |
|
S&P 500 |
+7.71 |
2,636.98 |
+0.29% |
|
Decliners |
1,075 |
37% |
|
Decliners |
1,007 |
41% |
|
Russell 2000 |
+11.59 |
1,520.47 |
+0.77% |
|
52 Wk Highs |
77 |
|
|
52 Wk Highs |
74 |
|
|
S&P 600 |
+5.19 |
928.53 |
+0.56% |
|
52 Wk Lows |
48 |
|
|
52 Wk Lows |
63 |
|
|
 |
Indices Rose With an Increase in Volume and More Leadership
Kenneth J. Gruneisen - Passed the CAN SLIM® Master's Exam
Stocks moved higher Thursday. The Dow finished up 70 points to 24211 while the S&P 500 gained 7 points to 2636. The Nasdaq Composite added 36 points to 6812. Volume totals reported were higher than the prior session totals on the NYSE and on the Nasdaq exchange. Breadth was positive as advancers led decliners by a 9-5 margin on the NYSE and by a 7-5 margin on the Nasdaq exchange. There were 31 high-ranked companies from the Leaders List that made new 52-week highs and were listed on the BreakOuts Page, versus the total of 15 on the prior session. New 52-week highs outnumbered new 52-week lows on the NYSE and on the Nasdaq exchange. The Featured Stocks Page provides the latest analysis on noteworthy high-ranked leaders. Charts used courtesy of www.stockcharts.com
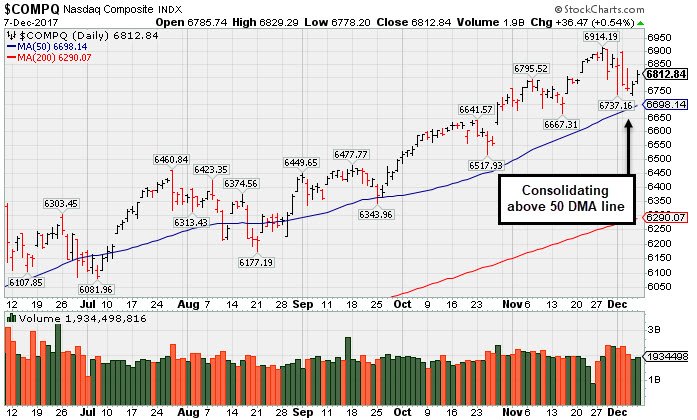 PICTURED: The Nasdaq Composite Index is consolidating above its 50-day moving average (DMA) line.
The major averages (M criteria) are in a confirmed uptrend. Investors should only consider stocks meeting all key criteria of the fact-based investment system as they trigger technical buy signals.
The S&P 500 snapped its four-day losing streak as Technology and Industrial shares paced gains. In tax reform news, there were no meaningful updates today as GOP lawmakers are beginning the process of reconciling the key differences between their two bills. On the economic front, a release this morning revealed initial jobless claims were 236,000, slightly below expectations of 240,000. An additional report today showed consumer credit unexpectedly increased in October to $20.5 billion from a revised $19.2 billion in September.
Nine of 11 S&P 500 sectors ended higher. Industrials outperformed as Boeing (BA +1.33%) and Caterpillar (CAT +1.82%) rose on positive analyst commentary. Tech shares climbed for the third consecutive day as Facebook (FB +2.32%) and Google parent Alphabet (GOOG +1.25%) both rose. Consumer Staples lagged as Coca-Cola (KO -1.44%) and PepsiCo (PEP -1.83%) both fell. In earnings news, Lululemon (LULU +6.43%) rose after the athletic apparel company reported earnings above consensus expectations.
Treasuries finished lower along the curve as the yield on the 10-year note increased three basis points to 2.36%. In commodities, NYMEX WTI crude added 1.2% to $56.63. COMEX gold fell 1.4% to $1248.90, a four-month low amid a stronger dollar. |
 Kenneth J. Gruneisen started out as a licensed stockbroker in August 1987, a couple of months prior to the historic stock market crash that took the Dow Jones Industrial Average down -22.6% in a single day. He has published daily fact-based fundamental and technical analysis on high-ranked stocks online for two decades. Through FACTBASEDINVESTING.COM, Kenneth provides educational articles, news, market commentary, and other information regarding proven investment systems that work in good times and bad.
Comments contained in the body of this report are technical opinions only and are not necessarily those of Gruneisen Growth Corp. The material herein has been obtained from sources believed to be reliable and accurate, however, its accuracy and completeness cannot be guaranteed. Our firm, employees, and customers may effect transactions, including transactions contrary to any recommendation herein, or have positions in the securities mentioned herein or options with respect thereto. Any recommendation contained in this report may not be suitable for all investors and it is not to be deemed an offer or solicitation on our part with respect to the purchase or sale of any securities. |
|
 |
Retail, Financial, Tech, and Energy-Linked Groups Rose
Kenneth J. Gruneisen - Passed the CAN SLIM® Master's Exam
The Broker/Dealer Index ($XBD +1.10%), Bank Index ($BKX +0.58%), and the Retail Index ($RLX +0.50%) ended unanimously higher on Thursday. The tech sector had a positive bias as the Biotechnology Index ($BTK +1.69%), Semiconductor Index ($SOX +0.99%), and the Networking Index ($NWX +0.55%) rose. Commodity-linked groups were on the quiet side as the Gold & Silver Index ($XAU +0.05%) finished flat while the Oil Services Index ($OSX +0.41%) and the Integrated Oil Index ($XOI +0.23%) both edged higher. Charts courtesy www.stockcharts.com
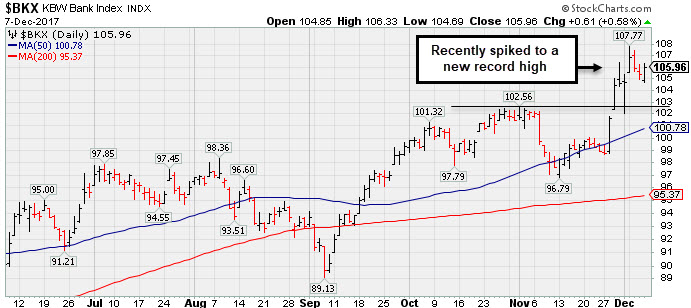 PICTURED: The Bank Index ($BKX +0.58%) is consolidating after spiking to a new record high.
| Oil Services |
$OSX |
132.65 |
+0.54 |
+0.41% |
-27.83% |
| Integrated Oil |
$XOI |
1,259.41 |
+2.93 |
+0.23% |
-0.68% |
| Semiconductor |
$SOX |
1,244.52 |
+12.26 |
+0.99% |
+37.29% |
| Networking |
$NWX |
486.51 |
+2.68 |
+0.55% |
+9.06% |
| Broker/Dealer |
$XBD |
261.60 |
+2.85 |
+1.10% |
+27.43% |
| Retail |
$RLX |
1,685.30 |
+8.46 |
+0.50% |
+25.49% |
| Gold & Silver |
$XAU |
76.46 |
+0.04 |
+0.05% |
-3.04% |
| Bank |
$BKX |
105.96 |
+0.61 |
+0.58% |
+15.44% |
| Biotech |
$BTK |
4,181.77 |
+69.43 |
+1.69% |
+35.99% |
|
|
|
 |
Very Extended From Prior Base and Hovering Near Record High
Kenneth J. Gruneisen - Passed the CAN SLIM® Master's Exam
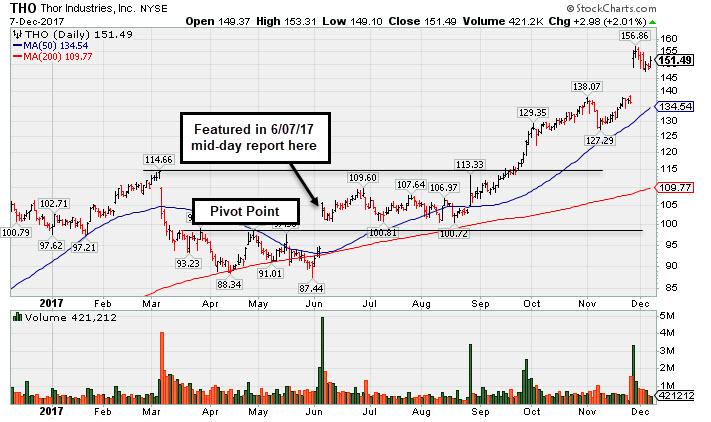
Thor Industries Inc (THO +$2.98 or +2.01% to $151.49) remains perched near its all-time high, very extended from any sound base. Its 50-day moving average (DMA) line ($134.54) and recent low ($127.29 on 11/08/17) define near-term support to watch.
Fundamentals remain strong. Recently it reported earnings +63% on +31% sales revenues for the Oct '17 quarter, continuing its strong earnings track record. The past 5 quarters were above the +25% minimum earnings guideline (C criteria) of the fact-based investment system. Its annual earnings history (A criteria) has been good. Return on Equity is reported at 26%, well above the 17% minimum guideline.
THO was last shown in this FSU section on 11/10/17 with an annotated graph under the headline, " Encountered Distributional Pressure After Getting Extended From Base". The Building - Mobile/Mfg & RV firm was highlighted in yellow with pivot point cited based on its 4/27/17 high in the 6/07/17 mid-day report (read here). It had gapped up on 6/06/17, clearing a "double bottom" base while rebounding toward prior highs.
It has earned a current Timeliness rating of A and a Sponsorship rating of B. The number of top-rated funds owning its shares rose from 489 in Mar '16 to 607 in Sep '17. Its current Up/Down Volume Ratio of 1.7 is an unbiased indication its shares have been under accumulation over the past 50 days (I criteria). Its small supply of only 49.5 million shares (S criteria) in the public float can contribute to greater volatility in the event of institutional buying or selling. |
|
|
Color Codes Explained :
Y - Better candidates highlighted by our
staff of experts.
G - Previously featured
in past reports as yellow but may no longer be buyable under the
guidelines.
***Last / Change / Volume data in this table is the closing quote data***
Symbol/Exchange
Company Name
Industry Group |
PRICE |
CHANGE
(%Change) |
Day High |
Volume
(% DAV)
(% 50 day avg vol) |
52 Wk Hi
% From Hi |
Featured
Date |
Price
Featured |
Pivot Featured |
|
Max Buy |
THO
-
NYSE
Thor Industries Inc
AUTOMOTIVE - Recreational Vehicles
|
$151.49
|
+2.98
2.01% |
$153.31
|
421,312
54.15% of 50 DAV
50 DAV is 778,000
|
$156.86
-3.42%
|
8/14/2017
|
$106.67
|
PP = $110.01
|
|
MB = $115.51
|
 Most Recent Note - 12/7/2017 5:12:00 PM
G - Hovering near its all-time high, very extended from any sound base. Its 50 DMA line ($134.54) and recent low ($127.29 on 11/08/17) define near-term support to watch. Reported earnings +63% on +31% sales revenues for the Oct '17 quarter, continuing its strong earnings track record. See the latest FSU analysis for more details and a new annotated graph.
>>> FEATURED STOCK ARTICLE : Very Extended From Prior Base and Hovering Near Record High - 12/7/2017 |
View all notes |
Set NEW NOTE alert |
Company Profile |
SEC
News |
Chart |
Request a new note
C
A
S
I |
PFBC
-
NASDAQ
Preferred Bank Los Angls
BANKING - Regional - Pacific Banks
|
$63.75
|
+0.25
0.39% |
$64.67
|
42,294
51.58% of 50 DAV
50 DAV is 82,000
|
$66.58
-4.25%
|
10/10/2017
|
$59.38
|
PP = $59.08
|
|
MB = $62.03
|
Most Recent Note - 12/5/2017 5:18:09 PM
G - Pulled back today after challenging its prior high with a gap up and volume-driven gain. Found prompt support at its 50 DMA line ($60.37) during its recent consolidation. See the latest FSU analysis for more details and a new annotated graph.
>>> FEATURED STOCK ARTICLE : Challenged High After Finding Support at 50 Day Moving Average - 12/5/2017 |
View all notes |
Set NEW NOTE alert |
Company Profile |
SEC
News |
Chart |
Request a new note
C
A
S
I |
AVGO
-
NASDAQ
Broadcom Limited
ELECTRONICS - Semiconductor - Broad Line
|
$263.89
|
+0.00
0.00% |
$275.70
|
7,769,157
252.82% of 50 DAV
50 DAV is 3,073,000
|
$285.68
-7.63%
|
10/30/2017
|
$261.19
|
PP = $259.46
|
|
MB = $272.43
|
Most Recent Note - 12/7/2017 12:09:14 PM
G - Found prompt support near prior highs in the $259 area and its 50 DMA line ($258.95). More damaging losses would raise greater concerns. Reported earnings +32% on +17% sales revenues for the Oct '17 quarter. Recently made bids to acquire Qualcomm Inc (QCOM).
>>> FEATURED STOCK ARTICLE : Consolidating Near Record High Following Volume-Driven Gains - 11/13/2017 |
View all notes |
Set NEW NOTE alert |
Company Profile |
SEC
News |
Chart |
Request a new note
C
A
S
I |
YY
-
NASDAQ
YY Inc Ads
INTERNET - Internet Service Providers
|
$109.61
|
+8.65
8.57% |
$110.23
|
2,280,221
145.79% of 50 DAV
50 DAV is 1,564,000
|
$123.48
-11.23%
|
9/25/2017
|
$80.26
|
PP = $83.10
|
|
MB = $87.26
|
Most Recent Note - 12/7/2017 5:14:38 PM
G - Posted a solid gain today with higher volume. During the recent consolidation it found support above its prior high ($97.59 on 10/16/17) and above its 50 DMA line ($96.48). It is extended from any sound base. Fundamentals remain strong.
>>> FEATURED STOCK ARTICLE : Chinese Social Media Firm Reported Earnings - 11/14/2017 |
View all notes |
Set NEW NOTE alert |
Company Profile |
SEC
News |
Chart |
Request a new note
C
A
S
I |
HTHT
-
NASDAQ
China Lodging Group Ads
LEISURE - Lodging
|
$119.03
|
+4.69
4.10% |
$119.16
|
813,584
157.98% of 50 DAV
50 DAV is 515,000
|
$142.80
-16.65%
|
9/29/2016
|
$46.12
|
PP = $47.82
|
|
MB = $50.21
|
Most Recent Note - 12/7/2017 5:21:56 PM
G - Posted a 6th consecutive gain today with higher volume. A rebound above its 50 DMA line ($124.71) still is needed for its outlook to improve. Fundamentals remain strong.
>>> FEATURED STOCK ARTICLE : Weak Technical Action Raises Concerns Despite Strong Fundamentals - 11/29/2017 |
View all notes |
Set NEW NOTE alert |
Company Profile |
SEC
News |
Chart |
Request a new note
C
A
S
I |
Symbol/Exchange
Company Name
Industry Group |
PRICE |
CHANGE
(%Change) |
Day High |
Volume
(% DAV)
(% 50 day avg vol) |
52 Wk Hi
% From Hi |
Featured
Date |
Price
Featured |
Pivot Featured |
|
Max Buy |
PATK
-
NASDAQ
Patrick Industries Inc
Bldg-Mobile/Mfg and RV
|
$97.70
|
+0.40
0.41% |
$99.00
|
55,268
64.27% of 50 DAV
50 DAV is 86,000
|
$102.95
-5.10%
|
10/26/2017
|
$90.90
|
PP = $87.90
|
|
MB = $92.30
|
Most Recent Note - 12/5/2017 11:23:22 AM
G - Perched near its all-time high, extended from its prior base. Its 50 DMA line ($89.03) defines important near-term support to watch. Fundamentals remain strong.
>>> FEATURED STOCK ARTICLE : Best Ever Close After Pullback Found Support Near Prior High - 11/21/2017 |
View all notes |
Set NEW NOTE alert |
Company Profile |
SEC
News |
Chart |
Request a new note
C
A
S
I |
ESNT
-
NYSE
Essent Group Ltd
Finance-MrtgandRel Svc
|
$45.72
|
+0.17
0.37% |
$46.15
|
896,061
95.94% of 50 DAV
50 DAV is 934,000
|
$46.15
-0.93%
|
10/9/2017
|
$39.75
|
PP = $41.54
|
|
MB = $43.62
|
Most Recent Note - 12/4/2017 5:47:39 PM
G - Gapped up and quietly hit a new high today. Its 50 DMA line ($42.55) and recent low ($39.79 on 11/03/17) define important near-term support to watch on pullbacks. Fundamentals remain strong.
>>> FEATURED STOCK ARTICLE : Recent Consolidation Was Not a Sufficient Length New Base - 11/20/2017 |
View all notes |
Set NEW NOTE alert |
Company Profile |
SEC
News |
Chart |
Request a new note
C
A
S
I |
FIVE
-
NASDAQ
Five Below Inc
Retail-DiscountandVariety
|
$67.00
|
+1.47
2.24% |
$67.10
|
1,342,755
140.75% of 50 DAV
50 DAV is 954,000
|
$66.00
1.52%
|
10/6/2017
|
$57.13
|
PP = $54.23
|
|
MB = $56.94
|
Most Recent Note - 12/6/2017 5:51:41 PM
G - Hit yet another new all-time high today with an additional volume-driven gain, getting very extended from its prior base. Its 50 DMA line ($57.61) and prior highs in the $57-58 area define near-term support to watch. Reported earnings +80% on +29% sales revenues for the Oct '17 quarter, continuing its strong earnings track record.
>>> FEATURED STOCK ARTICLE : Getting Extended From Prior Base With Earnings News Due - 11/24/2017 |
View all notes |
Set NEW NOTE alert |
Company Profile |
SEC
News |
Chart |
Request a new note
C
A
S
I |
OLED
-
NASDAQ
Universal Display Corp
Elec-Misc Products
|
$167.35
|
+3.30
2.01% |
$169.90
|
676,983
74.56% of 50 DAV
50 DAV is 908,000
|
$192.75
-13.18%
|
8/31/2017
|
$128.22
|
PP = $127.78
|
|
MB = $134.17
|
Most Recent Note - 12/6/2017 12:27:20 PM
G - Streak of losses marked by above average volume has been noted as indicative of distributional pressure. Still very extended from any sound base pattern. Its 50 DMA line ($153.03) and prior high in the $145 area define important near-term support to watch on pullbacks.
>>> FEATURED STOCK ARTICLE : Electronic Products Firm Perched at Record High - 11/17/2017 |
View all notes |
Set NEW NOTE alert |
Company Profile |
SEC
News |
Chart |
Request a new note
C
A
S
I |
ANET
-
NYSE
Arista Networks Inc
TELECOMMUNICATIONS - Communication Equipment
|
$219.86
|
+7.00
3.29% |
$221.25
|
901,541
112.55% of 50 DAV
50 DAV is 801,000
|
$245.65
-10.50%
|
10/27/2017
|
$195.65
|
PP = $196.37
|
|
MB = $206.19
|
Most Recent Note - 12/7/2017 5:23:51 PM
G - Posted a 3rd consecutive gain today with higher volume. The 50 DMA line ($207.70) defines important near-term support above prior highs in the $196 area. Violations may trigger technical sell signals. See the latest FSU analysis for more details and an annotated graph.
>>> FEATURED STOCK ARTICLE : Halted Volume-Driven Pullback at 50-Day Moving Average Line - 12/6/2017 |
View all notes |
Set NEW NOTE alert |
Company Profile |
SEC
News |
Chart |
Request a new note
C
A
S
I |
Symbol/Exchange
Company Name
Industry Group |
PRICE |
CHANGE
(%Change) |
Day High |
Volume
(% DAV)
(% 50 day avg vol) |
52 Wk Hi
% From Hi |
Featured
Date |
Price
Featured |
Pivot Featured |
|
Max Buy |
GRUB
-
NYSE
Grubhub Inc
COMPUTER SOFTWARE and SERVICES - Technical and System Software
|
$68.94
|
+0.52
0.76% |
$69.55
|
607,652
41.96% of 50 DAV
50 DAV is 1,448,000
|
$69.82
-1.26%
|
6/21/2017
|
$47.33
|
PP = $46.94
|
|
MB = $49.29
|
Most Recent Note - 12/5/2017 11:21:47 AM
G - Still very extended from any sound base after wedging higher with gains lacking great volume conviction. Its 50 DMA line ($58.91) and prior highs near $57 define support to watch on pullbacks. Reported Sep '17 quarterly earnings +22% on +32% sales revenues. The 2 latest quarters were below the +25% minimum earnings guideline (C criteria), raising fundamental concerns with regard to the fact-based investment system.
>>> FEATURED STOCK ARTICLE : Extended From Prior Highs After Gains on Light Volume - 11/22/2017 |
View all notes |
Set NEW NOTE alert |
Company Profile |
SEC
News |
Chart |
Request a new note
C
A
S
I |
IBP
-
NYSE
Installed Building Prod
DIVERSIFIED SERVICES - Business/Management Services
|
$72.65
|
-1.60
-2.15% |
$74.50
|
347,099
182.68% of 50 DAV
50 DAV is 190,000
|
$79.40
-8.50%
|
9/19/2017
|
$59.15
|
PP = $60.10
|
|
MB = $63.11
|
Most Recent Note - 12/6/2017 5:49:38 PM
G - Pulling back from its all-time high after getting very extended from any sound base. The prior high ($70.25 on 11/01/17) and its 50 DMA line ($67.67) define important near-term support to watch. Subsequent losses leading to violations may trigger technical sell signals.
>>> FEATURED STOCK ARTICLE : Extended From Any Sound Base After Impressive Rebound and Rally - 12/1/2017 |
View all notes |
Set NEW NOTE alert |
Company Profile |
SEC
News |
Chart |
Request a new note
C
A
S
I |
HQY
-
NASDAQ
"HealthEquity, Inc"
COMPUTER SOFTWARE and SERVICES - Healthcare Information Service
|
$47.88
|
+1.88
4.08% |
$48.25
|
1,075,107
253.98% of 50 DAV
50 DAV is 423,300
|
$55.31
-13.43%
|
11/6/2017
|
$54.63
|
PP = $52.87
|
|
MB = $55.51
|
Most Recent Note - 12/7/2017 5:20:35 PM
G - Rebounded above its 200 DMA line with today's big volume-driven gain. A rebound above the 50 DMA line ($50.41) is still needed for its outlook to improve. Its Relative Strength rating of 42 is now well below the 80+ minimum guideline for buy candidates, however, it is only -13.4% off its all-time high. Reported earnings +70% on +31% sales revenues for the Oct '17 quarter.
>>> FEATURED STOCK ARTICLE : Sank Below 50-Day Moving Average With Loss on Higher Volume - 12/4/2017 |
View all notes |
Set NEW NOTE alert |
Company Profile |
SEC
News |
Chart |
Request a new note
C
A
S
I |
OLLI
-
NASDAQ
Ollie's Bargain Outlet
Retail-DiscountandVariety
|
$48.75
|
-2.25
-4.41% |
$50.60
|
1,380,167
300.04% of 50 DAV
50 DAV is 460,000
|
$51.53
-5.39%
|
11/21/2017
|
$46.78
|
PP = $47.00
|
|
MB = $49.35
|
Most Recent Note - 12/7/2017 12:30:25 PM
G - Pulling back from its all-time high today after a streak of 8 consecutive gains. Color code was changed to green after rallying above its "max buy" level. Its 50 DMA line ($45.83) and prior lows in the $42 area define important near-term support. Fundamentals remain strong.
>>> FEATURED STOCK ARTICLE : Recently Stalled After Reaching a New High - 11/27/2017 |
View all notes |
Set NEW NOTE alert |
Company Profile |
SEC
News |
Chart |
Request a new note
C
A
S
I |
HLI
-
NYSE
Houlihan Lokey Inc Cl A
Finance-Invest Bnk/Bkrs
|
$44.26
|
+0.35
0.80% |
$44.40
|
95,094
38.50% of 50 DAV
50 DAV is 247,000
|
$45.14
-1.95%
|
9/18/2017
|
$37.04
|
PP = $39.78
|
|
MB = $41.77
|
Most Recent Note - 12/4/2017 5:50:06 PM
G - Posted a quiet gain today for a best-ever close. Perched at its all-time high, extended from any sound base. Its 50 DMA line and prior lows define near-term support in the $41 area. On 10/26/17 it priced a Secondary Offering. Fundamentals remain strong.
>>> FEATURED STOCK ARTICLE : Holding Ground Near Record High - 11/16/2017 |
View all notes |
Set NEW NOTE alert |
Company Profile |
SEC
News |
Chart |
Request a new note
C
A
S
I |
Symbol/Exchange
Company Name
Industry Group |
PRICE |
CHANGE
(%Change) |
Day High |
Volume
(% DAV)
(% 50 day avg vol) |
52 Wk Hi
% From Hi |
Featured
Date |
Price
Featured |
Pivot Featured |
|
Max Buy |
|
|
|
THESE ARE NOT BUY RECOMMENDATIONS!
Comments contained in the body of this report are technical
opinions only. The material herein has been obtained
from sources believed to be reliable and accurate, however,
its accuracy and completeness cannot be guaranteed.
This site is not an investment advisor, hence it does
not endorse or recommend any securities or other investments.
Any recommendation contained in this report may not
be suitable for all investors and it is not to be deemed
an offer or solicitation on our part with respect to
the purchase or sale of any securities. All trademarks,
service marks and trade names appearing in this report
are the property of their respective owners, and are
likewise used for identification purposes only.
This report is a service available
only to active Paid Premium Members.
You may opt-out of receiving report notifications
at any time. Questions or comments may be submitted
by writing to Premium Membership Services 665 S.E. 10 Street, Suite 201 Deerfield Beach, FL 33441-5634 or by calling 1-800-965-8307
or 954-785-1121.
|
|
|