You are not logged in.
This means you
CAN ONLY VIEW reports that were published prior to Thursday, March 20, 2025.
You
MUST UPGRADE YOUR MEMBERSHIP if you want to see any current reports.
AFTER MARKET UPDATE - WEDNESDAY, DECEMBER 6TH, 2017
Previous After Market Report Next After Market Report >>>
|
|
|
|
DOW |
-39.73 |
24,140.91 |
-0.16% |
|
Volume |
801,017,090 |
-10% |
|
Volume |
1,873,723,233 |
-10% |
|
NASDAQ |
+14.17 |
6,776.38 |
+0.21% |
|
Advancers |
1,245 |
43% |
|
Advancers |
850 |
33% |
|
S&P 500 |
-0.30 |
2,629.27 |
-0.01% |
|
Decliners |
1,676 |
57% |
|
Decliners |
1,703 |
67% |
|
Russell 2000 |
-7.88 |
1,508.88 |
-0.52% |
|
52 Wk Highs |
55 |
|
|
52 Wk Highs |
42 |
|
|
S&P 600 |
-4.74 |
923.34 |
-0.51% |
|
52 Wk Lows |
46 |
|
|
52 Wk Lows |
77 |
|
|
 |
Leadership Thins as Major Indices Have Another Mixed Session
Kenneth J. Gruneisen - Passed the CAN SLIM® Master's Exam
The major indices ended mixed on Wednesday. Volume totals reported were lighter than the prior session totals on the NYSE and on the Nasdaq exchange. Breadth was negative as decliners led advancers by a 4-3 margin on the NYSE and by a 2-1 margin on the Nasdaq exchange. There were only 15 high-ranked companies from the Leaders List that made new 52-week highs and were listed on the BreakOuts Page, versus the total of 31 on the prior session. New 52-week highs totals contracted yet still outnumbered new 52-week lows on the NYSE, but new lows outnumbered new highs on the Nasdaq exchange. The Featured Stocks Page provides the latest analysis on noteworthy high-ranked leaders. Charts used courtesy of www.stockcharts.com
 PICTURED: The S&P 500 Index remains perched near its record high after 4 consecutive small losses.
The major averages (M criteria) are in a confirmed uptrend. Investors should only consider stocks meeting all key criteria of the fact-based investment system as they trigger technical buy signals.
The technology sector opened relatively flat, but strengthened throughout the session as heavyweights like Facebook (FB +1.87%), Alphabet (GOOG +1.32%), and Microsoft (MSFT +1.46%) rose.
Energy shares were weak as the price of crude oil fell to its lowest level in more than two weeks. West Texas Intermediate crude futures tumbled -2.9% to $55.95 per barrel. The Department of Energy reported that U.S. crude stockpiles decreased by 5.6 million barrels last week, while the consensus estimate expected a draw of 2.5 million barrels. ConocoPhillips (COP -1.66%) fell.
DaVita (DVA +13.57%) jumped after agreeing to sell its DaVita Medical Group unit to UnitedHealth's (UNH -0.07%) Optum for approximately $4.9 billion in cash. Vera Bradly (VRA +27.66%) surged after reporting above-consensus earnings and issuing upbeat profit guidance for the holiday season.
|
 Kenneth J. Gruneisen started out as a licensed stockbroker in August 1987, a couple of months prior to the historic stock market crash that took the Dow Jones Industrial Average down -22.6% in a single day. He has published daily fact-based fundamental and technical analysis on high-ranked stocks online for two decades. Through FACTBASEDINVESTING.COM, Kenneth provides educational articles, news, market commentary, and other information regarding proven investment systems that work in good times and bad.
Comments contained in the body of this report are technical opinions only and are not necessarily those of Gruneisen Growth Corp. The material herein has been obtained from sources believed to be reliable and accurate, however, its accuracy and completeness cannot be guaranteed. Our firm, employees, and customers may effect transactions, including transactions contrary to any recommendation herein, or have positions in the securities mentioned herein or options with respect thereto. Any recommendation contained in this report may not be suitable for all investors and it is not to be deemed an offer or solicitation on our part with respect to the purchase or sale of any securities. |
|
 |
Financial, Retail, Biotech, and Commodity-Linked Groups Fell
Kenneth J. Gruneisen - Passed the CAN SLIM® Master's Exam
The Bank Index ($BKX -0.50%) and the Broker/Dealer Index ($XBD -0.68%) and the Retail Index ($RLX -0.74%) ended unanimously lower on Wednesday. The Semiconductor Index ($SOX +0.31%) gained a little bit of ground, meanwhile the Networking Index ($NWX -0.16%) fell modestly and the Biotechnology Index ($BTK -0.76%) slumped. Commodity-linked groups also had a negative bias as the Gold & Silver Index ($XAU -1.41%), Oil Services Index ($OSX -2.76%), and the Integrated Oil Index ($XOI -1.35%) ended unanimously lower. Charts courtesy www.stockcharts.com
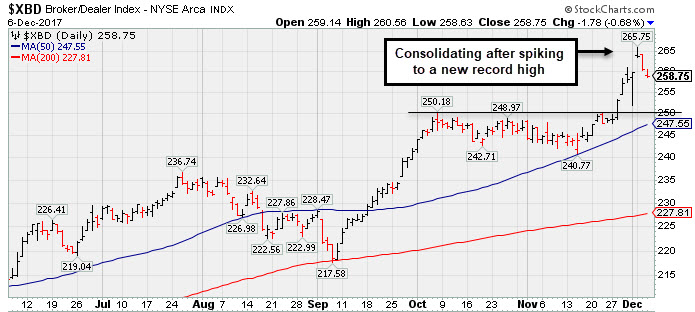 PICTURED: The Broker/Dealer Index ($XBD -0.68%) is consolidating after spiking to a new record high.
| Oil Services |
$OSX |
132.11 |
-3.74 |
-2.75% |
-28.12% |
| Integrated Oil |
$XOI |
1,256.48 |
-17.26 |
-1.35% |
-0.91% |
| Semiconductor |
$SOX |
1,232.26 |
+3.75 |
+0.31% |
+35.94% |
| Networking |
$NWX |
483.83 |
-0.79 |
-0.16% |
+8.46% |
| Broker/Dealer |
$XBD |
258.75 |
-1.78 |
-0.68% |
+26.05% |
| Retail |
$RLX |
1,676.84 |
-12.50 |
-0.74% |
+24.86% |
| Gold & Silver |
$XAU |
76.42 |
-1.09 |
-1.41% |
-3.09% |
| Bank |
$BKX |
105.35 |
-0.53 |
-0.50% |
+14.77% |
| Biotech |
$BTK |
4,112.34 |
-31.55 |
-0.76% |
+33.73% |
|
|
|
 |
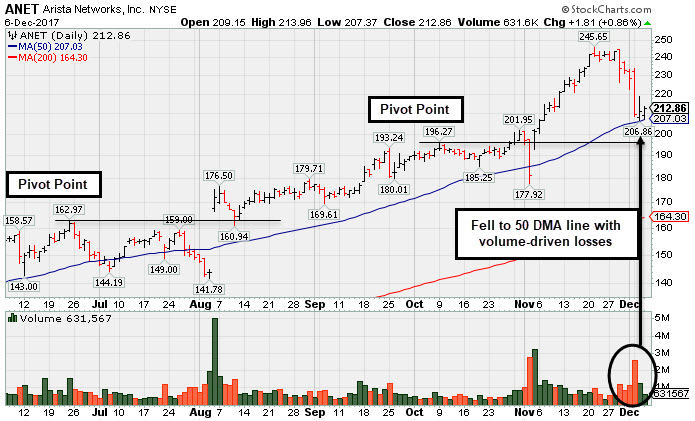
Halted Volume-Driven Pullback at 50-Day Moving Average Line
Kenneth J. Gruneisen - Passed the CAN SLIM® Master's Exam
Arista Networks Inc (ANET +$1.81 or +0.86% to $212.86) pulled back from its high with 4 consecutive losses marked by high volume after getting very extended from the previously noted base. It halted its slide at the 50-day moving average (DMA) line ($207.03). That important short-term average and prior highs in the $196 area define support to watch. Subsequent losses leading to damaging violations may trigger technical sell signals.
Fundamentals remain very strong, as ANET reported earnings +95% on +51% sales revenues for the Sep '17 quarter. It has shown strong and steady increases in quarterly sales revenues while earnings have routinely been well above the +25% minimum guideline (C criteria). Its annual earnings (A criteria) growth has been strong, however, its history is limited since its $43 IPO in June of 2014.
ANET traded up as much as +161.8% since first highlighted at $93.80 in yellow with pivot point cited based on its 2015 high plus 10 cents in the 11/21/16 mid-day report (read here). It was last shown in this FSU section on 11/09/17 with an annotated graph under the headline, "Perched at Record High Following Volume-Driven Gains".
The number of top-rated funds owning its shares rose from 360 in Dec '15 to 687 Sep '17, a reassuring sign concerning the I criteria. Its current Up/Down Volume Ratio of 1.3 is an unbiased indication its shares have been under accumulation over the past 50 days. The high-ranked Computer - Networking firm has a Timeliness Rating of A and a Sponsorship Rating of B. Its small supply of 45.3 million shares (S criteria) in the public float may contribute to greater volatility in the event of institutional buying or selling.
|
|
|
Color Codes Explained :
Y - Better candidates highlighted by our
staff of experts.
G - Previously featured
in past reports as yellow but may no longer be buyable under the
guidelines.
***Last / Change / Volume data in this table is the closing quote data***
Symbol/Exchange
Company Name
Industry Group |
PRICE |
CHANGE
(%Change) |
Day High |
Volume
(% DAV)
(% 50 day avg vol) |
52 Wk Hi
% From Hi |
Featured
Date |
Price
Featured |
Pivot Featured |
|
Max Buy |
THO
-
NYSE
Thor Industries Inc
AUTOMOTIVE - Recreational Vehicles
|
$148.51
|
-1.45
-0.97% |
$150.62
|
484,333
61.94% of 50 DAV
50 DAV is 782,000
|
$156.86
-5.32%
|
8/14/2017
|
$106.67
|
PP = $110.01
|
|
MB = $115.51
|
Most Recent Note - 12/4/2017 5:57:23 PM
G - Pulled back for a 3rd consecutive loss on average volume, retreating from its all-time high. It is extended from its prior base. Its 50 DMA line ($132.75) and recent low ($127.29 on 11/08/17) define near-term support to watch. Reported earnings +63% on +31% sales revenues for the Oct '17 quarter, continuing its strong earnings track record.
>>> FEATURED STOCK ARTICLE : Encountered Distributional Pressure After Getting Extended From Base - 11/10/2017 |
View all notes |
Set NEW NOTE alert |
Company Profile |
SEC
News |
Chart |
Request a new note
C
A
S
I |
PFBC
-
NASDAQ
Preferred Bank Los Angls
BANKING - Regional - Pacific Banks
|
$63.50
|
-0.90
-1.40% |
$64.25
|
46,504
56.03% of 50 DAV
50 DAV is 83,000
|
$66.58
-4.63%
|
10/10/2017
|
$59.38
|
PP = $59.08
|
|
MB = $62.03
|
Most Recent Note - 12/5/2017 5:18:09 PM
G - Pulled back today after challenging its prior high with a gap up and volume-driven gain. Found prompt support at its 50 DMA line ($60.37) during its recent consolidation. See the latest FSU analysis for more details and a new annotated graph.
>>> FEATURED STOCK ARTICLE : Challenged High After Finding Support at 50 Day Moving Average - 12/5/2017 |
View all notes |
Set NEW NOTE alert |
Company Profile |
SEC
News |
Chart |
Request a new note
C
A
S
I |
AVGO
-
NASDAQ
Avago Technologies Ltd
ELECTRONICS - Semiconductor - Broad Line
|
$263.72
|
+2.07
0.79% |
$264.42
|
4,218,765
138.16% of 50 DAV
50 DAV is 3,053,600
|
$285.68
-7.69%
|
10/30/2017
|
$261.19
|
PP = $259.46
|
|
MB = $272.43
|
Most Recent Note - 12/4/2017 5:46:12 PM
G - Fell with above average volume for a 3rd time in the span of 4 sessions. Prior highs in the $259 area and its 50 DMA line ($257.38) define near-term support to watch. Due to report earnings on Wednesday, December 6, 2017 after the close of the market. Volume and volatility often increase near earnings news. Recently made bids to acquire Qualcomm Inc (QCOM).
>>> FEATURED STOCK ARTICLE : Consolidating Near Record High Following Volume-Driven Gains - 11/13/2017 |
View all notes |
Set NEW NOTE alert |
Company Profile |
SEC
News |
Chart |
Request a new note
C
A
S
I |
YY
-
NASDAQ
YY Inc Ads
INTERNET - Internet Service Providers
|
$100.96
|
+0.28
0.28% |
$101.79
|
1,164,673
72.30% of 50 DAV
50 DAV is 1,611,000
|
$123.48
-18.24%
|
9/25/2017
|
$80.26
|
PP = $83.10
|
|
MB = $87.26
|
Most Recent Note - 12/5/2017 5:27:17 PM
G - Consolidating above its prior high ($97.59 on 10/16/17) which defines near-term support along with its 50 DMA line ($95.66). Abruptly retreated from its all-time high after getting very extended from any sound base. Fundamentals remain strong.
>>> FEATURED STOCK ARTICLE : Chinese Social Media Firm Reported Earnings - 11/14/2017 |
View all notes |
Set NEW NOTE alert |
Company Profile |
SEC
News |
Chart |
Request a new note
C
A
S
I |
HTHT
-
NASDAQ
China Lodging Group Ads
LEISURE - Lodging
|
$114.34
|
+3.62
3.27% |
$115.84
|
709,301
139.08% of 50 DAV
50 DAV is 510,000
|
$142.80
-19.93%
|
9/29/2016
|
$46.12
|
PP = $47.82
|
|
MB = $50.21
|
Most Recent Note - 12/5/2017 5:25:26 PM
G - Holding its ground for the past 4 sessions after damaging volume-driven losses triggered technical sell signals. A rebound above its 50 DMA line ($124.88) is needed for its outlook to improve. Fundamentals remain strong.
>>> FEATURED STOCK ARTICLE : Weak Technical Action Raises Concerns Despite Strong Fundamentals - 11/29/2017 |
View all notes |
Set NEW NOTE alert |
Company Profile |
SEC
News |
Chart |
Request a new note
C
A
S
I |
Symbol/Exchange
Company Name
Industry Group |
PRICE |
CHANGE
(%Change) |
Day High |
Volume
(% DAV)
(% 50 day avg vol) |
52 Wk Hi
% From Hi |
Featured
Date |
Price
Featured |
Pivot Featured |
|
Max Buy |
PATK
-
NASDAQ
Patrick Industries Inc
Bldg-Mobile/Mfg and RV
|
$97.30
|
-0.30
-0.31% |
$98.05
|
63,030
73.29% of 50 DAV
50 DAV is 86,000
|
$102.95
-5.49%
|
10/26/2017
|
$90.90
|
PP = $87.90
|
|
MB = $92.30
|
Most Recent Note - 12/5/2017 11:23:22 AM
G - Perched near its all-time high, extended from its prior base. Its 50 DMA line ($89.03) defines important near-term support to watch. Fundamentals remain strong.
>>> FEATURED STOCK ARTICLE : Best Ever Close After Pullback Found Support Near Prior High - 11/21/2017 |
View all notes |
Set NEW NOTE alert |
Company Profile |
SEC
News |
Chart |
Request a new note
C
A
S
I |
ESNT
-
NYSE
Essent Group Ltd
Finance-MrtgandRel Svc
|
$45.55
|
+0.01
0.02% |
$45.80
|
465,107
49.32% of 50 DAV
50 DAV is 943,000
|
$46.15
-1.30%
|
10/9/2017
|
$39.75
|
PP = $41.54
|
|
MB = $43.62
|
Most Recent Note - 12/4/2017 5:47:39 PM
G - Gapped up and quietly hit a new high today. Its 50 DMA line ($42.55) and recent low ($39.79 on 11/03/17) define important near-term support to watch on pullbacks. Fundamentals remain strong.
>>> FEATURED STOCK ARTICLE : Recent Consolidation Was Not a Sufficient Length New Base - 11/20/2017 |
View all notes |
Set NEW NOTE alert |
Company Profile |
SEC
News |
Chart |
Request a new note
C
A
S
I |
FIVE
-
NASDAQ
Five Below Inc
Retail-DiscountandVariety
|
$65.53
|
+1.39
2.17% |
$66.00
|
1,347,122
142.85% of 50 DAV
50 DAV is 943,000
|
$65.49
0.06%
|
10/6/2017
|
$57.13
|
PP = $54.23
|
|
MB = $56.94
|
 Most Recent Note - 12/6/2017 5:51:41 PM
G - Hit yet another new all-time high today with an additional volume-driven gain, getting very extended from its prior base. Its 50 DMA line ($57.61) and prior highs in the $57-58 area define near-term support to watch. Reported earnings +80% on +29% sales revenues for the Oct '17 quarter, continuing its strong earnings track record.
>>> FEATURED STOCK ARTICLE : Getting Extended From Prior Base With Earnings News Due - 11/24/2017 |
View all notes |
Set NEW NOTE alert |
Company Profile |
SEC
News |
Chart |
Request a new note
C
A
S
I |
OLED
-
NASDAQ
Universal Display Corp
Elec-Misc Products
|
$164.05
|
-1.95
-1.17% |
$166.40
|
1,234,996
136.31% of 50 DAV
50 DAV is 906,000
|
$192.75
-14.89%
|
8/31/2017
|
$128.22
|
PP = $127.78
|
|
MB = $134.17
|
Most Recent Note - 12/6/2017 12:27:20 PM
G - Streak of losses marked by above average volume has been noted as indicative of distributional pressure. Still very extended from any sound base pattern. Its 50 DMA line ($153.03) and prior high in the $145 area define important near-term support to watch on pullbacks.
>>> FEATURED STOCK ARTICLE : Electronic Products Firm Perched at Record High - 11/17/2017 |
View all notes |
Set NEW NOTE alert |
Company Profile |
SEC
News |
Chart |
Request a new note
C
A
S
I |
ANET
-
NYSE
Arista Networks Inc
TELECOMMUNICATIONS - Communication Equipment
|
$212.86
|
+1.81
0.86% |
$213.96
|
627,817
78.38% of 50 DAV
50 DAV is 801,000
|
$245.65
-13.35%
|
10/27/2017
|
$195.65
|
PP = $196.37
|
|
MB = $206.19
|
Most Recent Note - 12/6/2017 5:46:07 PM
G - Halted its slide near its 50 DMA line after 4 consecutive losses marked by higher volume. The 50 DMA line ($207.03) and prior highs in the $196 area define important near-term support levels to watch. Violations may trigger technical sell signals. See the latest FSU analysis for more details and a new annotated graph.
>>> FEATURED STOCK ARTICLE : Halted Volume-Driven Pullback at 50-Day Moving Average Line - 12/6/2017 |
View all notes |
Set NEW NOTE alert |
Company Profile |
SEC
News |
Chart |
Request a new note
C
A
S
I |
Symbol/Exchange
Company Name
Industry Group |
PRICE |
CHANGE
(%Change) |
Day High |
Volume
(% DAV)
(% 50 day avg vol) |
52 Wk Hi
% From Hi |
Featured
Date |
Price
Featured |
Pivot Featured |
|
Max Buy |
GRUB
-
NYSE
Grubhub Inc
COMPUTER SOFTWARE and SERVICES - Technical and System Software
|
$68.42
|
+0.84
1.24% |
$68.84
|
646,519
43.83% of 50 DAV
50 DAV is 1,475,000
|
$69.82
-2.01%
|
6/21/2017
|
$47.33
|
PP = $46.94
|
|
MB = $49.29
|
Most Recent Note - 12/5/2017 11:21:47 AM
G - Still very extended from any sound base after wedging higher with gains lacking great volume conviction. Its 50 DMA line ($58.91) and prior highs near $57 define support to watch on pullbacks. Reported Sep '17 quarterly earnings +22% on +32% sales revenues. The 2 latest quarters were below the +25% minimum earnings guideline (C criteria), raising fundamental concerns with regard to the fact-based investment system.
>>> FEATURED STOCK ARTICLE : Extended From Prior Highs After Gains on Light Volume - 11/22/2017 |
View all notes |
Set NEW NOTE alert |
Company Profile |
SEC
News |
Chart |
Request a new note
C
A
S
I |
IBP
-
NYSE
Installed Building Prod
DIVERSIFIED SERVICES - Business/Management Services
|
$74.25
|
-0.10
-0.13% |
$75.75
|
135,940
70.80% of 50 DAV
50 DAV is 192,000
|
$79.40
-6.49%
|
9/19/2017
|
$59.15
|
PP = $60.10
|
|
MB = $63.11
|
Most Recent Note - 12/6/2017 5:49:38 PM
G - Pulling back from its all-time high after getting very extended from any sound base. The prior high ($70.25 on 11/01/17) and its 50 DMA line ($67.67) define important near-term support to watch. Subsequent losses leading to violations may trigger technical sell signals.
>>> FEATURED STOCK ARTICLE : Extended From Any Sound Base After Impressive Rebound and Rally - 12/1/2017 |
View all notes |
Set NEW NOTE alert |
Company Profile |
SEC
News |
Chart |
Request a new note
C
A
S
I |
HQY
-
NASDAQ
"HealthEquity, Inc"
COMPUTER SOFTWARE and SERVICES - Healthcare Information Service
|
$46.01
|
-2.49
-5.12% |
$48.52
|
1,621,673
406.94% of 50 DAV
50 DAV is 398,500
|
$55.31
-16.82%
|
11/6/2017
|
$54.63
|
PP = $52.87
|
|
MB = $55.51
|
Most Recent Note - 12/6/2017 11:29:55 AM
G - Reported earnings +70% on +31% sales revenues for the Oct '17 quarter. Violating its 200 DMA line ($47.06) with today's 4th consecutive loss on ever-increasing volume raising more serious concerns. Disciplined investors always limit losses by selling any stock that falls more than -7% from their purchase price. A rebound above the 50 and 200 DMA lines is needed for its outlook to improve. See the latest FSU analysis for more details and an annotated graph.
>>> FEATURED STOCK ARTICLE : Sank Below 50-Day Moving Average With Loss on Higher Volume - 12/4/2017 |
View all notes |
Set NEW NOTE alert |
Company Profile |
SEC
News |
Chart |
Request a new note
C
A
S
I |
OLLI
-
NASDAQ
Ollie's Bargain Outlet
Retail-DiscountandVariety
|
$51.00
|
+0.30
0.59% |
$51.53
|
932,675
206.34% of 50 DAV
50 DAV is 452,000
|
$51.40
-0.78%
|
11/21/2017
|
$46.78
|
PP = $47.00
|
|
MB = $49.35
|
Most Recent Note - 12/5/2017 5:22:53 PM
G - Hit yet another new high with above average volume behind today's 7th consecutive gain. Color code is changed to green after rallying above its "max buy" level. Its 50 DMA line ($45.64) and prior lows in the $42 area define important near-term support.
>>> FEATURED STOCK ARTICLE : Recently Stalled After Reaching a New High - 11/27/2017 |
View all notes |
Set NEW NOTE alert |
Company Profile |
SEC
News |
Chart |
Request a new note
C
A
S
I |
HLI
-
NYSE
Houlihan Lokey Inc Cl A
Finance-Invest Bnk/Bkrs
|
$43.91
|
-0.29
-0.66% |
$44.33
|
155,932
63.13% of 50 DAV
50 DAV is 247,000
|
$45.14
-2.72%
|
9/18/2017
|
$37.04
|
PP = $39.78
|
|
MB = $41.77
|
Most Recent Note - 12/4/2017 5:50:06 PM
G - Posted a quiet gain today for a best-ever close. Perched at its all-time high, extended from any sound base. Its 50 DMA line and prior lows define near-term support in the $41 area. On 10/26/17 it priced a Secondary Offering. Fundamentals remain strong.
>>> FEATURED STOCK ARTICLE : Holding Ground Near Record High - 11/16/2017 |
View all notes |
Set NEW NOTE alert |
Company Profile |
SEC
News |
Chart |
Request a new note
C
A
S
I |
Symbol/Exchange
Company Name
Industry Group |
PRICE |
CHANGE
(%Change) |
Day High |
Volume
(% DAV)
(% 50 day avg vol) |
52 Wk Hi
% From Hi |
Featured
Date |
Price
Featured |
Pivot Featured |
|
Max Buy |
|
|
|
THESE ARE NOT BUY RECOMMENDATIONS!
Comments contained in the body of this report are technical
opinions only. The material herein has been obtained
from sources believed to be reliable and accurate, however,
its accuracy and completeness cannot be guaranteed.
This site is not an investment advisor, hence it does
not endorse or recommend any securities or other investments.
Any recommendation contained in this report may not
be suitable for all investors and it is not to be deemed
an offer or solicitation on our part with respect to
the purchase or sale of any securities. All trademarks,
service marks and trade names appearing in this report
are the property of their respective owners, and are
likewise used for identification purposes only.
This report is a service available
only to active Paid Premium Members.
You may opt-out of receiving report notifications
at any time. Questions or comments may be submitted
by writing to Premium Membership Services 665 S.E. 10 Street, Suite 201 Deerfield Beach, FL 33441-5634 or by calling 1-800-965-8307
or 954-785-1121.
|
|
|