You are not logged in.
This means you
CAN ONLY VIEW reports that were published prior to Friday, April 18, 2025.
You
MUST UPGRADE YOUR MEMBERSHIP if you want to see any current reports.
AFTER MARKET UPDATE - MONDAY, OCTOBER 23RD, 2017
Previous After Market Report Next After Market Report >>>
|
|
|
|
DOW |
-54.67 |
23,273.96 |
-0.23% |
|
Volume |
757,370,430 |
-16% |
|
Volume |
1,814,881,940 |
+1% |
|
NASDAQ |
-42.22 |
6,586.83 |
-0.64% |
|
Advancers |
1,002 |
34% |
|
Advancers |
839 |
34% |
|
S&P 500 |
-10.23 |
2,564.98 |
-0.40% |
|
Decliners |
1,922 |
66% |
|
Decliners |
1,625 |
66% |
|
Russell 2000 |
-11.75 |
1,497.49 |
-0.78% |
|
52 Wk Highs |
203 |
|
|
52 Wk Highs |
172 |
|
|
S&P 600 |
-4.98 |
908.77 |
-0.55% |
|
52 Wk Lows |
52 |
|
|
52 Wk Lows |
39 |
|
|
 |
Breadth Negative as Major Indices Fell
Kenneth J. Gruneisen - Passed the CAN SLIM® Master's Exam
Stocks were lower Monday. The Dow fell 54 points to 23273. The S&P 500 lost ten points to 2564. The Nasdaq Composite dropped 42 points to 6586. Volume totals reported were mixed, lighter than the prior session total on the NYSE and higher on the Nasdaq exchange. Decliners led advancers by nearly a 2-1 margin on the NYSE and on the Nasdaq exchange. There were 95 high-ranked companies from the Leaders List that made new 52-week highs and were listed on the BreakOuts Page, versus the total of 128 on the prior session. New 52-week highs totals contracted yet solidly outnumbered new 52-week lows totals on the Nasdaq exchange and on the NYSE. The Featured Stocks Page provides the latest analysis on noteworthy high-ranked leaders. Charts used courtesy of www.stockcharts.com
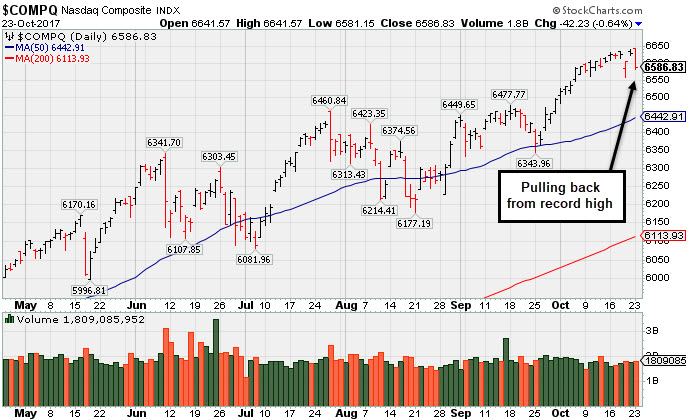 PICTURED: The Nasdaq Composite Index is pulling back from a new record high.
The major averages' (M criteria) are in a confirmed uptrend. Leadership has remained healthy. Investors should buy stocks meeting all key criteria of the fact-based investment system on a case-by-case basis as they trigger technical buy signals.
The major averages fell from record highs as investors prepared for this week’s full slate of profit tallies from several notable S&P 500 companies. The central bank remained in focus as investors await President Trump’s decision on who will be the next leader of the Federal Reserve. The lone data report on Monday from the Chicago Fed revealed business activity unexpectedly improved in September.
Ten of 11 S&P 500 sectors were lower with Industrials a notable underperformer. Shares of General Electric (GE -6.34%) fell on negative analyst commentary. In earnings news, Hartford Financial Services (HIG-4.30%) after posting profits below expectations. Hasbro (HAS -8.60%) fell after the toy-makers quarterly reports topped estimates but lowered its forward guidance. Seagate Technology (STX +12.62%) rose after posting earnings above projections. VF Corporation (VFC 5.38%) after it revealed profits above expectations and raised guidance. In other news, Dr. Pepper Snapple (DPS +1.46%) rose on positive analyst commentary surroundings its scheduled earnings release on Wednesday.
Treasuries were little changed with the yield on the benchmark 10-year note down one basis point to 2.37%. In commodities, NYMEX WTI crude added 0.1% to $51.90/barrel. COMEX gained 0.2% to $1283.10. |
 Kenneth J. Gruneisen started out as a licensed stockbroker in August 1987, a couple of months prior to the historic stock market crash that took the Dow Jones Industrial Average down -22.6% in a single day. He has published daily fact-based fundamental and technical analysis on high-ranked stocks online for two decades. Through FACTBASEDINVESTING.COM, Kenneth provides educational articles, news, market commentary, and other information regarding proven investment systems that work in good times and bad.
Comments contained in the body of this report are technical opinions only and are not necessarily those of Gruneisen Growth Corp. The material herein has been obtained from sources believed to be reliable and accurate, however, its accuracy and completeness cannot be guaranteed. Our firm, employees, and customers may effect transactions, including transactions contrary to any recommendation herein, or have positions in the securities mentioned herein or options with respect thereto. Any recommendation contained in this report may not be suitable for all investors and it is not to be deemed an offer or solicitation on our part with respect to the purchase or sale of any securities. |
|
 |
Semiconductor Index Was a Standout Group With Gains
Kenneth J. Gruneisen - Passed the CAN SLIM® Master's Exam
On Monday the Bank Index ($BKX -0.38%) and the Broker/Dealer Index ($XBD -0.21%) fell slightly, both outpaced to the downside by the Retail Index ($RLX -0.53%). The tech sector was mixed, with a small gain for the Semiconductor Index ($SOX +0.47%), meanwhile the Networking Index ($NWX -0.23%) and the Biotechnology Index ($BTK -0.92%) both ended lower. The Gold & Silver Index ($XAU -0.98%) and the Oil Services Index ($OSX -1.63%) both outpaced the Integrated Oil Index ($XOI -0.34%) to the downside. Charts courtesy www.stockcharts.com
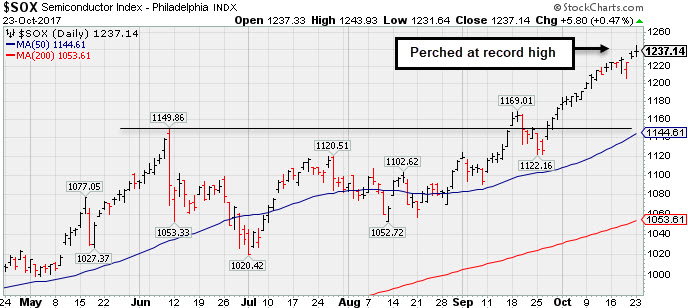 PICTURED: The Semiconductor Index ($SOX +0.47%) is perched at a record high.
| Oil Services |
$OSX |
129.56 |
-2.15 |
-1.63% |
-29.51% |
| Integrated Oil |
$XOI |
1,216.69 |
-4.11 |
-0.34% |
-4.05% |
| Semiconductor |
$SOX |
1,237.14 |
+5.80 |
+0.47% |
+36.48% |
| Networking |
$NWX |
467.07 |
-1.06 |
-0.23% |
+4.70% |
| Broker/Dealer |
$XBD |
245.79 |
-0.51 |
-0.21% |
+19.73% |
| Retail |
$RLX |
1,537.39 |
-8.13 |
-0.53% |
+14.48% |
| Gold & Silver |
$XAU |
84.17 |
-0.84 |
-0.99% |
+6.73% |
| Bank |
$BKX |
100.79 |
-0.38 |
-0.38% |
+9.80% |
| Biotech |
$BTK |
4,204.23 |
-38.83 |
-0.92% |
+36.72% |
|
|
|
 |
Recent Gains Lacked Volume; Earnings Report Due Soon
Kenneth J. Gruneisen - Passed the CAN SLIM® Master's Exam
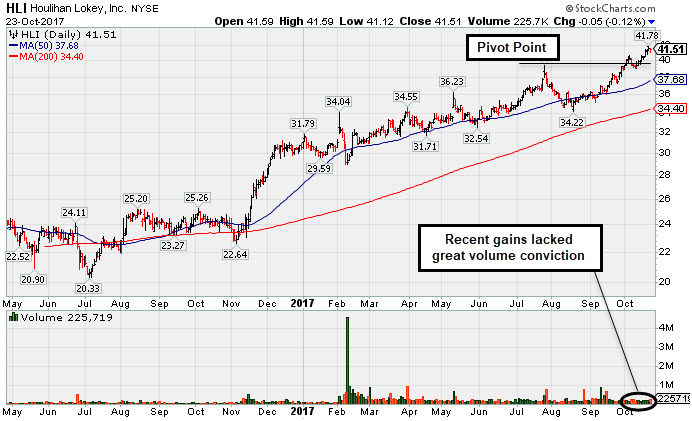
Houlihan Lokey Inc (HLI -$0.05 or -0.12% to $41.51) is quietly perched near its all-time high. All of the recent gains have been lacking great volume conviction. Gains above the pivot point must be backed by at least +40% above average volume to trigger a proper new (or add-on) technical buy signal. The company will release its third quarter 2017 financial results on Thursday, October 26, 2017, after the market close. Volume and volatility often increase near earnings news.
Its 50-day moving average (DMA) line ($37.68) defines near-term support. Subsequent losses below the recent low ($34.41 on 8/18/17) would raise more serious concerns and trigger a technical sell signal. HLI was last shown in this FSU section on 9/27/17 with an annotated graph, "Rebounding Toward Prior High and New Pivot Point".
The high ranked Finance - Invest Bank//Broker firm reported earnings +43% on +20% sales revenues for the Jun '17 quarter, and 3 of the past 4 quarterly comparisons were above the +25% minimum earning guideline (C criteria). Annual earnings growth (A criteria) history is a good match with the fact-based investment system's guidelines. It has an Earnings Per share rating of 98.
Its current Up/Down Volume Ratio of 1.7 is an unbiased indication its shares have been under accumulation over the past 50 days. It has a current Timeliness rating of B and a Sponsorship rating of C. The number of top-rated funds owning its shares rose from 165 in Jun '16 to 275 in Sep '17, also a reassuring sign concerning the I criteria. Its small supply of only 24.6 million shares (S criteria) in the public float can contribute to greater price volatility in the event of institutional buying or selling.
|
|
|
Color Codes Explained :
Y - Better candidates highlighted by our
staff of experts.
G - Previously featured
in past reports as yellow but may no longer be buyable under the
guidelines.
***Last / Change / Volume data in this table is the closing quote data***
Symbol/Exchange
Company Name
Industry Group |
PRICE |
CHANGE
(%Change) |
Day High |
Volume
(% DAV)
(% 50 day avg vol) |
52 Wk Hi
% From Hi |
Featured
Date |
Price
Featured |
Pivot Featured |
|
Max Buy |
MPX
-
NYSE
Marine Products Corp
AUTOMOTIVE - Recreational Vehicles
|
$15.23
|
+0.04
0.26% |
$15.35
|
11,923
37.26% of 50 DAV
50 DAV is 32,000
|
$17.12
-11.04%
|
9/26/2017
|
$16.30
|
PP = $16.35
|
|
MB = $17.17
|
Most Recent Note - 10/20/2017 5:41:40 PM
G - Still sputtering below its 50 DMA line ($15.41). Only a prompt rebound above the 50 DMA would help its outlook improve. See the latest FSU analysis for more details and a new annotated graph.
>>> FEATURED STOCK ARTICLE : Violation of 50 Day Moving Average Line Hurt Technical Stance - 10/20/2017 |
View all notes |
Set NEW NOTE alert |
Company Profile |
SEC
News |
Chart |
Request a new note
C
A
S
I |
THO
-
NYSE
Thor Industries Inc
AUTOMOTIVE - Recreational Vehicles
|
$130.52
|
-1.21
-0.92% |
$132.85
|
413,963
59.05% of 50 DAV
50 DAV is 701,000
|
$133.29
-2.07%
|
8/14/2017
|
$106.67
|
PP = $110.01
|
|
MB = $115.51
|
Most Recent Note - 10/19/2017 3:21:15 PM
G - Volume totals have been cooling in recent weeks, perched at its all-time high after 8 consecutive weekly gains, very extended from the previously noted base. Prior highs in the $115 area define initial support to watch on pullbacks. Fundamentals remain strong.
>>> FEATURED STOCK ARTICLE : Extended From Prior Base With Volume Totals Cooling - 10/13/2017 |
View all notes |
Set NEW NOTE alert |
Company Profile |
SEC
News |
Chart |
Request a new note
C
A
S
I |
PFBC
-
NASDAQ
Preferred Bank Los Angls
BANKING - Regional - Pacific Banks
|
$58.26
|
-0.70
-1.19% |
$58.99
|
132,378
205.88% of 50 DAV
50 DAV is 64,300
|
$60.99
-4.48%
|
10/10/2017
|
$59.38
|
PP = $59.08
|
|
MB = $62.03
|
 Most Recent Note - 10/23/2017 1:29:42 PM
Y - Its Relative Strength rating has slumped to 78, below the 80+ minimum for buy candidates. Sputtering since highlighted in the 10/10/17 mid-day report. Prior highs in the 58 area define initial support to watch above its 50 DMA line ($55.77)
>>> FEATURED STOCK ARTICLE : Perched Near High Following Volume-Driven Breakout Gains - 10/11/2017 |
View all notes |
Set NEW NOTE alert |
Company Profile |
SEC
News |
Chart |
Request a new note
C
A
S
I |
AVGO
-
NASDAQ
Avago Technologies Ltd
ELECTRONICS - Semiconductor - Broad Line
|
$244.27
|
+0.03
0.01% |
$245.65
|
2,341,959
91.35% of 50 DAV
50 DAV is 2,563,600
|
$259.36
-5.82%
|
8/24/2017
|
$252.44
|
PP = $256.89
|
|
MB = $269.73
|
Most Recent Note - 10/19/2017 12:25:54 PM
G - Still sputtering below its 50 DMA line ($246.24), and its Relative Strength rating has slumped to 76, below the 80+ minimum guideline for buy candidates. A rebound above that short-term average is needed for its outlook to improve. Subsequent losses below the recent low ($231.53 on 9/25/17) would raise serious concerns and trigger a more worrisome technical sell signal.
>>> FEATURED STOCK ARTICLE : Slumped Below 50-Day Moving Average Line Again - 10/17/2017 |
View all notes |
Set NEW NOTE alert |
Company Profile |
SEC
News |
Chart |
Request a new note
C
A
S
I |
YY
-
NASDAQ
YY Inc Ads
INTERNET - Internet Service Providers
|
$95.71
|
+2.59
2.78% |
$96.50
|
1,284,125
74.53% of 50 DAV
50 DAV is 1,723,000
|
$97.59
-1.93%
|
9/25/2017
|
$80.26
|
PP = $83.10
|
|
MB = $87.26
|
Most Recent Note - 10/19/2017 5:21:38 PM
G - Extended from its prior base and prior highs in the $83 area defining initial support to watch above its 50 DMA line. See the latest FSU analysis for more details and a new annotated graph.
>>> FEATURED STOCK ARTICLE : Extended After Rallying From Base - 10/19/2017 |
View all notes |
Set NEW NOTE alert |
Company Profile |
SEC
News |
Chart |
Request a new note
C
A
S
I |
Symbol/Exchange
Company Name
Industry Group |
PRICE |
CHANGE
(%Change) |
Day High |
Volume
(% DAV)
(% 50 day avg vol) |
52 Wk Hi
% From Hi |
Featured
Date |
Price
Featured |
Pivot Featured |
|
Max Buy |
STMP
-
NASDAQ
Stamps.com Inc
INTERNET - Internet Software and Services
|
$224.30
|
+2.45
1.10% |
$225.00
|
275,523
86.37% of 50 DAV
50 DAV is 319,000
|
$226.00
-0.75%
|
9/11/2017
|
$193.65
|
PP = $220.35
|
|
MB = $231.37
|
Most Recent Note - 10/19/2017 1:15:28 PM
Y - Faces no resistance, however recent gains have been "wedging" with a lack of great volume conviction indicative of fresh institutional buying demand. Gains above the pivot point must have at least +40% above average volume to trigger a proper new (or add-on) technical buy signal under the fact-based investment system. Its 50 DMA line ($205.79) defines important near-term support above the recent low ($195.05 on 9/28/17) where violations would trigger technical sell signals.
>>> FEATURED STOCK ARTICLE : Perched Near Pivot Point With No Resistance Remaining - 10/4/2017 |
View all notes |
Set NEW NOTE alert |
Company Profile |
SEC
News |
Chart |
Request a new note
C
A
S
I |
HTHT
-
NASDAQ
China Lodging Group Ads
LEISURE - Lodging
|
$141.02
|
+6.50
4.83% |
$141.85
|
745,916
191.75% of 50 DAV
50 DAV is 389,000
|
$138.44
1.86%
|
9/29/2016
|
$46.12
|
PP = $47.82
|
|
MB = $50.21
|
Most Recent Note - 10/23/2017 1:14:01 PM
G - Rallying to another new all-time high today, very extended from any sound base. Earnings +19% on +18% sales revenues for the Jun '17 quarter were below the +25% minimum earnings guideline (C criteria). Its 50 DMA line ($118) defines near-term support.
>>> FEATURED STOCK ARTICLE : Holding Ground Stubbornly After Considerable Rally - 10/5/2017 |
View all notes |
Set NEW NOTE alert |
Company Profile |
SEC
News |
Chart |
Request a new note
C
A
S
I |
LMAT
-
NASDAQ
Lemaitre Vascular Inc
Medical-Products
|
$38.35
|
-0.66
-1.69% |
$39.79
|
204,029
120.02% of 50 DAV
50 DAV is 170,000
|
$39.88
-3.84%
|
7/28/2017
|
$33.50
|
PP = $33.32
|
|
MB = $34.99
|
Most Recent Note - 10/20/2017 5:43:37 PM
G - Hit a new high with today's volume-driven gain, but it ended in the lower half of its intra-day range. Found support at its 50 DMA line and prior highs in the $36 area. Violations would raise concerns and trigger technical sell signals. Due to report Sep '17 quarterly earnings on 10/26/17 after the close. See the latest FSU analysis for more details and an annotated graph.
>>> FEATURED STOCK ARTICLE : Consolidating Above 50-Day Moving Average Before Earnings - 10/18/2017 |
View all notes |
Set NEW NOTE alert |
Company Profile |
SEC
News |
Chart |
Request a new note
C
A
S
I |
ESNT
-
NYSE
Essent Group Ltd
Finance-MrtgandRel Svc
|
$43.23
|
-1.27
-2.85% |
$44.46
|
1,073,656
150.79% of 50 DAV
50 DAV is 712,000
|
$45.10
-4.15%
|
10/9/2017
|
$39.75
|
PP = $41.54
|
|
MB = $43.62
|
Most Recent Note - 10/23/2017 1:10:13 PM
Y - Retreating from its all-time high with today's loss following 9 consecutive gains. Prior highs in the $41 area define near term support to watch above its 50 DMA line.
>>> FEATURED STOCK ARTICLE : Perched Within Close Striking Distance of Prior High - 9/29/2017 |
View all notes |
Set NEW NOTE alert |
Company Profile |
SEC
News |
Chart |
Request a new note
C
A
S
I |
FIVE
-
NASDAQ
Five Below Inc
Retail-DiscountandVariety
|
$57.00
|
-0.49
-0.85% |
$58.07
|
676,763
77.08% of 50 DAV
50 DAV is 878,000
|
$57.65
-1.13%
|
10/6/2017
|
$57.13
|
PP = $54.23
|
|
MB = $56.94
|
Most Recent Note - 10/17/2017 5:13:58 PM
Y - Posted a 3rd consecutive small gain today with below average volume. Prior highs in the $54 area define initial support to watch on pullbacks.
>>> FEATURED STOCK ARTICLE : Finished Strong With Above Average Volume Behind Big Gain - 10/6/2017 |
View all notes |
Set NEW NOTE alert |
Company Profile |
SEC
News |
Chart |
Request a new note
C
A
S
I |
Symbol/Exchange
Company Name
Industry Group |
PRICE |
CHANGE
(%Change) |
Day High |
Volume
(% DAV)
(% 50 day avg vol) |
52 Wk Hi
% From Hi |
Featured
Date |
Price
Featured |
Pivot Featured |
|
Max Buy |
OLED
-
NASDAQ
Universal Display Corp
Elec-Misc Products
|
$134.85
|
+0.55
0.41% |
$136.00
|
340,753
41.01% of 50 DAV
50 DAV is 831,000
|
$145.30
-7.19%
|
8/31/2017
|
$128.22
|
PP = $127.78
|
|
MB = $134.17
|
Most Recent Note - 10/23/2017 7:03:34 PM
G - It has not formed a sound base. Due to report Sep '17 quarterly results after the close on Thursday, November 2nd. Its 50 DMA line ($126) and recent lows define important near-term support to watch on pullbacks.
>>> FEATURED STOCK ARTICLE : Consolidating Near Prior Highs Following Recent Breakout - 9/28/2017 |
View all notes |
Set NEW NOTE alert |
Company Profile |
SEC
News |
Chart |
Request a new note
C
A
S
I |
ANET
-
NYSE
Arista Networks Inc
TELECOMMUNICATIONS - Communication Equipment
|
$191.57
|
-0.11
-0.06% |
$194.24
|
464,879
75.59% of 50 DAV
50 DAV is 615,000
|
$196.27
-2.39%
|
8/4/2017
|
$173.31
|
PP = $163.07
|
|
MB = $171.22
|
Most Recent Note - 10/23/2017 6:58:08 PM
G - Quietly perched near its all-time high, extended from any sound base. Its 50 DMA line ($181) defines near-term support to watch on pullbacks. Fundamentals remain very strong.
>>> FEATURED STOCK ARTICLE : Perched Near All-Time High, Extended From Any Sound Base - 10/16/2017 |
View all notes |
Set NEW NOTE alert |
Company Profile |
SEC
News |
Chart |
Request a new note
C
A
S
I |
GRUB
-
NYSE
Grubhub Inc
COMPUTER SOFTWARE and SERVICES - Technical and System Software
|
$51.44
|
-0.90
-1.72% |
$52.90
|
1,970,483
127.21% of 50 DAV
50 DAV is 1,549,000
|
$57.61
-10.71%
|
6/21/2017
|
$47.33
|
PP = $46.94
|
|
MB = $49.29
|
Most Recent Note - 10/19/2017 3:19:10 PM
G - Recent lows in the $49-50 area define near-term support above prior highs in the $47 area. A rebound above its now downward sloping 50 DMA line ($53.78) is needed for its outlook to improve. Due to report Sep '17 quarterly results before the open on Wednesday, October 25th. Volume and volatility often increase near earnings news. Earnings rose only +13% on +32% sales revenues for the Jun '17 quarter, below the +25% minimum earnings guideline (C criteria).
>>> FEATURED STOCK ARTICLE : Gain Above 50-Day Moving Average Line Helped Technical Stance - 10/2/2017 |
View all notes |
Set NEW NOTE alert |
Company Profile |
SEC
News |
Chart |
Request a new note
C
A
S
I |
IBP
-
NYSE
Installed Building Prod
DIVERSIFIED SERVICES - Business/Management Services
|
$65.20
|
-0.60
-0.91% |
$66.25
|
154,851
100.55% of 50 DAV
50 DAV is 154,000
|
$67.15
-2.90%
|
9/19/2017
|
$59.15
|
PP = $60.10
|
|
MB = $63.11
|
Most Recent Note - 10/17/2017 5:18:08 PM
G - Still stubbornly holding its ground, extended from prior highs in the $60 area that define initial support above its 50 DMA line ($59.88).
>>> FEATURED STOCK ARTICLE : Building - Maintenance & Service Firm Extended From Latest Base - 10/9/2017 |
View all notes |
Set NEW NOTE alert |
Company Profile |
SEC
News |
Chart |
Request a new note
C
A
S
I |
NCOM
-
NASDAQ
National Commerce Corp
BANKING - Regional - Southeast Banks
|
$42.15
|
-0.60
-1.40% |
$42.89
|
15,274
39.16% of 50 DAV
50 DAV is 39,000
|
$43.80
-3.77%
|
4/25/2017
|
$38.95
|
PP = $40.09
|
|
MB = $42.09
|
Most Recent Note - 10/17/2017 5:25:23 PM
G - Volume totals have been cooling while stubbornly holding its ground near its 52-week high following an impressive spurt of volume-driven gains. Recently reported Jun '17 earnings +23% on +45% sales revenues, below the +25% minimum earnings guideline (C criteria), raising fundamental concerns.
>>> FEATURED STOCK ARTICLE : Holding Ground Following Impressive Volume-Driven Gains - 10/12/2017 |
View all notes |
Set NEW NOTE alert |
Company Profile |
SEC
News |
Chart |
Request a new note
C
A
S
I |
Symbol/Exchange
Company Name
Industry Group |
PRICE |
CHANGE
(%Change) |
Day High |
Volume
(% DAV)
(% 50 day avg vol) |
52 Wk Hi
% From Hi |
Featured
Date |
Price
Featured |
Pivot Featured |
|
Max Buy |
OLLI
-
NASDAQ
Ollie's Bargain Outlet
Retail-DiscountandVariety
|
$46.00
|
+0.90
2.00% |
$46.35
|
432,081
81.83% of 50 DAV
50 DAV is 528,000
|
$46.90
-1.92%
|
9/8/2017
|
$45.20
|
PP = $46.18
|
|
MB = $48.49
|
Most Recent Note - 10/17/2017 5:22:49 PM
Y - Volume totals have been cooling while hovering near its all-time high and above its 50 DMA line ($44.78). Recent gains above the latest pivot point did not meet the minimum +40% above average volume threshold necessary to trigger a proper new (or add-on) technical buy signal. Confirming volume-driven gains would be a reassuring sign of fresh institutional buying demand. Fundamentals remain strong.
>>> FEATURED STOCK ARTICLE : Quietly Hit New Highs Without Great Volume Conviction - 10/3/2017 |
View all notes |
Set NEW NOTE alert |
Company Profile |
SEC
News |
Chart |
Request a new note
C
A
S
I |
HLI
-
NYSE
Houlihan Lokey Inc Cl A
Finance-Invest Bnk/Bkrs
|
$41.51
|
-0.05
-0.12% |
$41.59
|
224,407
101.54% of 50 DAV
50 DAV is 221,000
|
$41.78
-0.65%
|
9/18/2017
|
$37.04
|
PP = $39.78
|
|
MB = $41.77
|
Most Recent Note - 10/23/2017 6:55:47 PM
Y - Perched at its all-time high. Releases its second quarter results for the 2018 fiscal year on Tuesday, October 24, 2017, after the close of trading. See the latest FSU analysis for more details and a new annotated graph.
>>> FEATURED STOCK ARTICLE : Recent Gains Lacked Volume; Earnings Report Due Soon - 10/23/2017 |
View all notes |
Set NEW NOTE alert |
Company Profile |
SEC
News |
Chart |
Request a new note
C
A
S
I |
ICHR
-
NASDAQ
Ichor Holdings Ltd
ELECTRONICS - Semiconductor Equipment
|
$34.30
|
+0.44
1.30% |
$35.50
|
892,896
131.89% of 50 DAV
50 DAV is 677,000
|
$35.51
-3.41%
|
10/10/2017
|
$29.39
|
PP = $28.36
|
|
MB = $29.78
|
Most Recent Note - 10/19/2017 12:48:39 PM
G - Prior highs in the $29 area define initial support to watch on pullbacks. Very extended from its prior base after a streak of gains.
>>> FEATURED STOCK ARTICLE : Semiconductor Equipment Firm Finished Strong After Highlighted - 10/10/2017 |
View all notes |
Set NEW NOTE alert |
Company Profile |
SEC
News |
Chart |
Request a new note
C
A
S
I |
|
|
|
THESE ARE NOT BUY RECOMMENDATIONS!
Comments contained in the body of this report are technical
opinions only. The material herein has been obtained
from sources believed to be reliable and accurate, however,
its accuracy and completeness cannot be guaranteed.
This site is not an investment advisor, hence it does
not endorse or recommend any securities or other investments.
Any recommendation contained in this report may not
be suitable for all investors and it is not to be deemed
an offer or solicitation on our part with respect to
the purchase or sale of any securities. All trademarks,
service marks and trade names appearing in this report
are the property of their respective owners, and are
likewise used for identification purposes only.
This report is a service available
only to active Paid Premium Members.
You may opt-out of receiving report notifications
at any time. Questions or comments may be submitted
by writing to Premium Membership Services 665 S.E. 10 Street, Suite 201 Deerfield Beach, FL 33441-5634 or by calling 1-800-965-8307
or 954-785-1121.
|
|
|