You are not logged in.
This means you
CAN ONLY VIEW reports that were published prior to Thursday, March 20, 2025.
You
MUST UPGRADE YOUR MEMBERSHIP if you want to see any current reports.
AFTER MARKET UPDATE - TUESDAY, OCTOBER 17TH, 2017
Previous After Market Report Next After Market Report >>>
|
|
|
|
DOW |
+40.48 |
22,997.44 |
+0.18% |
|
Volume |
691,478,650 |
-1% |
|
Volume |
1,642,103,162 |
+1% |
|
NASDAQ |
-0.34 |
6,623.66 |
-0.01% |
|
Advancers |
1,245 |
43% |
|
Advancers |
1,020 |
36% |
|
S&P 500 |
+1.72 |
2,559.36 |
+0.07% |
|
Decliners |
1,654 |
57% |
|
Decliners |
1,821 |
64% |
|
Russell 2000 |
-5.18 |
1,497.50 |
-0.34% |
|
52 Wk Highs |
138 |
|
|
52 Wk Highs |
93 |
|
|
S&P 600 |
-2.94 |
905.20 |
-0.32% |
|
52 Wk Lows |
26 |
|
|
52 Wk Lows |
57 |
|
|
 |
Leadership Waned and Breadth Was Negative
Kenneth J. Gruneisen - Passed the CAN SLIM® Master's Exam
Stocks were little changed on Tuesday. The Dow added 40 points to 22997. The S&P 500 gained 1 point to 2559. The Nasdaq Composite was flat at 6623. Volume totals reported were mixed, lighter than the prior session total on the NYSE and slightly higher on the Nasdaq exchange. Decliners outnumbered advancers by a 4-3 margin on the NYSE and 9-5 on the Nasdaq exchange. There were 57 high-ranked companies from the Leaders List that made new 52-week highs and were listed on the BreakOuts Page, versus the total of 86 on the prior session. New 52-week highs totals contracted again yet still outnumbered new 52-week lows totals on the Nasdaq exchange and on the NYSE. The Featured Stocks Page provides the latest analysis on noteworthy high-ranked leaders. Charts used courtesy of www.stockcharts.com
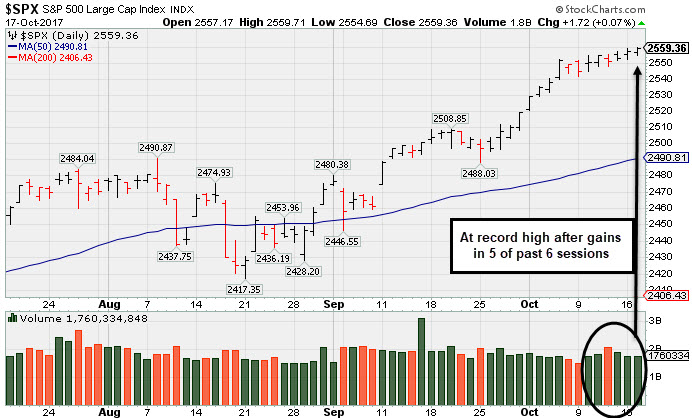 PICTURED: The S&P 500 Index hit another new record high with its 5th gain in 6 sessions.
The major averages' (M criteria) are in a confirmed uptrend. Leadership has remained healthy. Investors should buy stocks meeting all key criteria of the fact-based investment system on a case-by-case basis as they trigger technical buy signals.
The Dow briefly eclipsed 23000 as investors digested several blue chip earnings announcements. On the data front, a release revealed industrial production rose 0.3% in September, in line with consensus expectations. An additional release from the National Association of Home Builders showed homebuilder confidence topped consensus estimates and hit a six month high.
Six of 11 S&P 500 sectors were higher on the session with Healthcare the notable outperformer. United Healthcare (UNH +5.53%) and Johnson & Johnson (JNJ +3.43%) rose after both companies topped earnings projections. In Financials, Morgan Stanley (MS +0.37%) edged higher after it posted quarterly results above consensus estimates. Goldman Sachs (GS -2.61%) fell despite topping consensus estimates, after the investment bank revealed trading revenues fell 26% year over year. In other earnings news, WW Grainger (GWW +12.65%) rose after it beat analyst estimates and reiterated guidance. Netflix (NFLX -1.58%) fell despite posting earnings and subscriber growth above analyst expectations.
Treasuries were little changed with the benchmark 10-year note yield flat at 2.30%. In commodities, NYMEX WTI crude gained 0.2% to $51.96/barrel. COMEX gold fell 1.2% to $1287.60/ounce. In FOREX trading the U.S. dollar index gained 0.2% against its peers. |
 Kenneth J. Gruneisen started out as a licensed stockbroker in August 1987, a couple of months prior to the historic stock market crash that took the Dow Jones Industrial Average down -22.6% in a single day. He has published daily fact-based fundamental and technical analysis on high-ranked stocks online for two decades. Through FACTBASEDINVESTING.COM, Kenneth provides educational articles, news, market commentary, and other information regarding proven investment systems that work in good times and bad.
Comments contained in the body of this report are technical opinions only and are not necessarily those of Gruneisen Growth Corp. The material herein has been obtained from sources believed to be reliable and accurate, however, its accuracy and completeness cannot be guaranteed. Our firm, employees, and customers may effect transactions, including transactions contrary to any recommendation herein, or have positions in the securities mentioned herein or options with respect thereto. Any recommendation contained in this report may not be suitable for all investors and it is not to be deemed an offer or solicitation on our part with respect to the purchase or sale of any securities. |
|
 |
Financial and Commodity-Linked Groups Fell
Kenneth J. Gruneisen - Passed the CAN SLIM® Master's Exam
On Tuesday the Bank Index ($BKX -0.72%) and the Broker/Dealer Index ($XBD -1.42%) both ended lower, meanwhile the Retail Index ($RLX +0.05%) finished flat. The tech sector was mostly positive, with a modest loss from the Semiconductor Index ($SOX -0.07%) while the Biotechnology Index ($BTK +0.60%) and the Networking Index ($NWX +0.25%) both ended the session slightly higher. The Gold & Silver Index ($XAU -0.44%) and the Oil Services Index ($OSX -0.72%) both ended lower while the Integrated Oil Index ($XOI +0.00%) was unchanged. Charts courtesy www.stockcharts.com
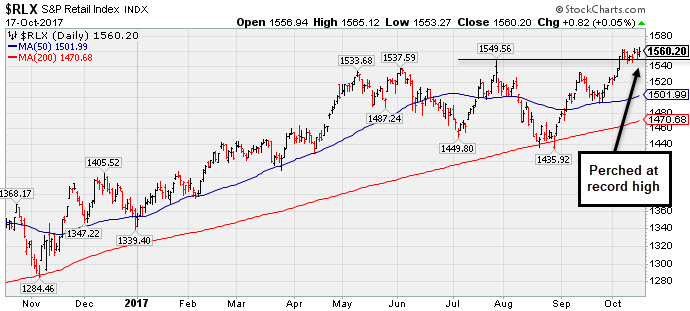 PICTURED: The Retail Index ($RLX +0.05%) Is perched at its record high. In August it found support at its 200-day moving average (DMA) line.
| Oil Services |
$OSX |
137.32 |
-1.00 |
-0.72% |
-25.28% |
| Integrated Oil |
$XOI |
1,221.80 |
-0.03 |
-0.00% |
-3.64% |
| Semiconductor |
$SOX |
1,224.12 |
-0.87 |
-0.07% |
+35.04% |
| Networking |
$NWX |
463.84 |
+1.14 |
+0.25% |
+3.98% |
| Broker/Dealer |
$XBD |
243.68 |
-3.52 |
-1.42% |
+18.71% |
| Retail |
$RLX |
1,560.20 |
+0.82 |
+0.05% |
+16.17% |
| Gold & Silver |
$XAU |
85.76 |
-0.38 |
-0.44% |
+8.75% |
| Bank |
$BKX |
98.79 |
-0.73 |
-0.73% |
+7.63% |
| Biotech |
$BTK |
4,298.53 |
+25.59 |
+0.60% |
+39.79% |
|
|
|
 |
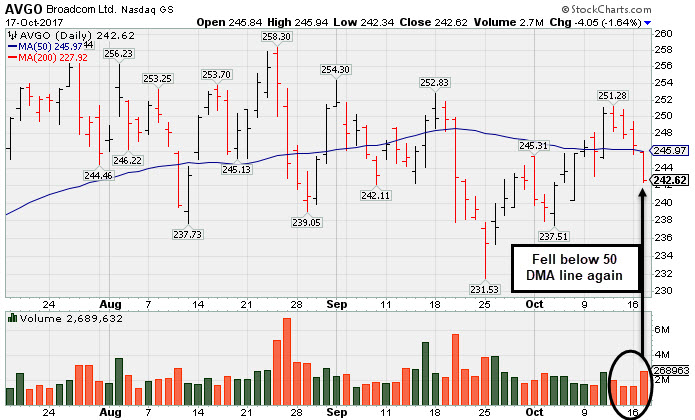
Slumped Below 50-Day Moving Average Line Again
Kenneth J. Gruneisen - Passed the CAN SLIM® Master's Exam
Broadcom Limited (AVGO -$4.05 or -1.64% to $242.62) raised greater concerns while slumping with higher (near average) volume today and falling back below its 50-day moving average (DMA) line. It has been enduring distributional pressure, and its color code was changed to green. A convincing rebound above the 50 DMA line would help its outlook improve. The low on 7/26/17 coincides with prior highs in the $227 area, and its 200 DMA line ($229) also defines important near-term support to watch
Its current Accumulation/Distribution Rating is D, meanwhile, it has a Timeliness Rating of B and Sponsorship Rating of B. Note that AVGO failed to produce a technical buy signal after highlighted in yellow with pivot point cited based on its 6/05/17 high plus 10 cents as it was noted in the 8/24/17 mid-day report - "Subsequent volume-driven gains above the pivot and for new highs may trigger a technical buy signal. Prior quarterly and annual earnings history (C and A criteria) is a good match with the fact-based investment system's fundamental guidelines."
The Jul '17 quarter marked its 5th consecutive quarterly earnings increase above the +25% minimum guideline (C criteria). Earnings rose by +29%, +38%, +51%, +46%, and +42%, respectively, in the Jul ,Oct '16, Jan, Apr, and Jul '17 quarterly comparisons versus the year ago periods. Sales revenues rose +119%, +125%, +134%, +18% and +18% during that time span. Its annual earnings (A criteria) history has been strong.
Other leadership in the Semiconductor group has been a reassuring sign concerning the L criteria. This Singapore-based Electronics - Semiconductor firm was last shown in this FSU section on 9/21/17 under the headline, "Technical Deterioration Raises Concerns". The number of top-rated funds owning its shares rose from 2,095 in Sep '16 to 2,345 in Sep '17, a reassuring sign concerning the I criteria. However, its current Up//Down Volume ratio of 0.8 is an unbiased indication its shares have been under distributional pressure over the past 50 days.
|
|
|
Color Codes Explained :
Y - Better candidates highlighted by our
staff of experts.
G - Previously featured
in past reports as yellow but may no longer be buyable under the
guidelines.
***Last / Change / Volume data in this table is the closing quote data***
Symbol/Exchange
Company Name
Industry Group |
PRICE |
CHANGE
(%Change) |
Day High |
Volume
(% DAV)
(% 50 day avg vol) |
52 Wk Hi
% From Hi |
Featured
Date |
Price
Featured |
Pivot Featured |
|
Max Buy |
MPX
-
NYSE
Marine Products Corp
AUTOMOTIVE - Recreational Vehicles
|
$15.02
|
+0.31
2.11% |
$15.35
|
41,648
126.21% of 50 DAV
50 DAV is 33,000
|
$17.12
-12.27%
|
9/26/2017
|
$16.30
|
PP = $16.35
|
|
MB = $17.17
|
Most Recent Note - 10/16/2017 1:46:35 PM
G - Violated its 50 DMA line ($15.37) with higher volume behind today's 6th consecutive loss triggering a technical sell signal and its color code is changed to green. Only a prompt rebound above the 50 DMA would help its outlook improve. Noted with caution in prior reports - "Recent losses negated the breakout attempt and it slumped back into the prior base raising concerns. Confirming volume-driven gains above the pivot point and for new highs would be a very reassuring sign of fresh institutional buying demand,"
>>> FEATURED STOCK ARTICLE : Powerboat Maker Hit Another New 52-Week High - 9/26/2017 |
View all notes |
Set NEW NOTE alert |
Company Profile |
SEC
News |
Chart |
Request a new note
C
A
S
I |
THO
-
NYSE
Thor Industries Inc
AUTOMOTIVE - Recreational Vehicles
|
$129.82
|
-0.70
-0.54% |
$131.34
|
736,971
107.90% of 50 DAV
50 DAV is 683,000
|
$131.24
-1.08%
|
8/14/2017
|
$106.67
|
PP = $110.01
|
|
MB = $115.51
|
Most Recent Note - 10/13/2017 5:52:39 PM
G - Perched at its all-time high after 8 consecutive weekly gains, very extended from the previously noted base. Prior highs in the $115 area define initial support to watch on pullbacks. Fundamentals remain strong. See the latest FSU analysis for more details and a new annotated graph.
>>> FEATURED STOCK ARTICLE : Extended From Prior Base With Volume Totals Cooling - 10/13/2017 |
View all notes |
Set NEW NOTE alert |
Company Profile |
SEC
News |
Chart |
Request a new note
C
A
S
I |
PFBC
-
NASDAQ
Preferred Bank Los Angls
BANKING - Regional - Pacific Banks
|
$58.49
|
-0.35
-0.59% |
$59.49
|
56,972
87.65% of 50 DAV
50 DAV is 65,000
|
$60.99
-4.10%
|
10/10/2017
|
$59.38
|
PP = $59.08
|
|
MB = $62.03
|
 Most Recent Note - 10/17/2017 5:24:05 PM
Y - Ended slightly lower with near average volume. It was highlighted in yellow with pivot point cited based on its 7/20/17 high plus 10 cents in the 10/10/17 mid-day report. Hit new 52-week highs, triggering a technical buy signal with considerable volume-driven gains on 9/27 and 9/28. Faces no resistance due to overhead supply. Reported earnings +31% on +26% sales revenues for the Jun '17 quarter, its 3rd consecutive quarterly comparison above the +25% minimum guideline (C criteria). See the latest FSU analysis for more details and an annotated graph.
>>> FEATURED STOCK ARTICLE : Perched Near High Following Volume-Driven Breakout Gains - 10/11/2017 |
View all notes |
Set NEW NOTE alert |
Company Profile |
SEC
News |
Chart |
Request a new note
C
A
S
I |
AVGO
-
NASDAQ
Avago Technologies Ltd
ELECTRONICS - Semiconductor - Broad Line
|
$242.62
|
-4.05
-1.64% |
$245.94
|
2,689,622
105.48% of 50 DAV
50 DAV is 2,550,000
|
$259.36
-6.45%
|
8/24/2017
|
$252.44
|
PP = $256.89
|
|
MB = $269.73
|
Most Recent Note - 10/17/2017 5:11:28 PM
G - Slumped back below its 50 DMA line ($246) with today's loss on higher (near average) volume. Subsequent losses below the recent low ($231.53 on 9/25/17) would raise serious concerns and trigger a more worrisome technical sell signal. See the latest FSU analysis for more details and a new annotated graph.
>>> FEATURED STOCK ARTICLE : Slumped Below 50-Day Moving Average Line Again - 10/17/2017 |
View all notes |
Set NEW NOTE alert |
Company Profile |
SEC
News |
Chart |
Request a new note
C
A
S
I |
YY
-
NASDAQ
YY Inc Ads
INTERNET - Internet Service Providers
|
$94.42
|
-2.90
-2.98% |
$97.55
|
1,055,269
57.79% of 50 DAV
50 DAV is 1,826,000
|
$97.59
-3.25%
|
9/25/2017
|
$80.26
|
PP = $83.10
|
|
MB = $87.26
|
Most Recent Note - 10/17/2017 5:28:33 PM
G - Pulled back today on lighter volume following 4 consecutive gains. Very extended from its prior base and prior highs in the $83 area defining initial support to watch above its 50 DMA line ($80.21).
>>> FEATURED STOCK ARTICLE : Encountered Distributional Pressure When Challenging Prior HIgh - 9/25/2017 |
View all notes |
Set NEW NOTE alert |
Company Profile |
SEC
News |
Chart |
Request a new note
C
A
S
I |
Symbol/Exchange
Company Name
Industry Group |
PRICE |
CHANGE
(%Change) |
Day High |
Volume
(% DAV)
(% 50 day avg vol) |
52 Wk Hi
% From Hi |
Featured
Date |
Price
Featured |
Pivot Featured |
|
Max Buy |
STMP
-
NASDAQ
Stamps.com Inc
INTERNET - Internet Software and Services
|
$219.80
|
+2.85
1.31% |
$220.10
|
311,790
88.83% of 50 DAV
50 DAV is 351,000
|
$224.64
-2.15%
|
9/11/2017
|
$193.65
|
PP = $220.35
|
|
MB = $231.37
|
Most Recent Note - 10/13/2017 6:07:32 PM
Y - Faces no resistance, however it has stalled near its pivot point based on its 8/07/17 high plus 10 cents. Subsequent volume-driven gains above the pivot point are needed to trigger a proper new (or add-on) technical buy signal. Its 50 DMA line ($205) defines important near-term support above the recent low ($195.05 on 9/28/17) where violations would trigger technical sell signals.
>>> FEATURED STOCK ARTICLE : Perched Near Pivot Point With No Resistance Remaining - 10/4/2017 |
View all notes |
Set NEW NOTE alert |
Company Profile |
SEC
News |
Chart |
Request a new note
C
A
S
I |
HTHT
-
NASDAQ
China Lodging Group Ads
LEISURE - Lodging
|
$132.73
|
-2.18
-1.62% |
$134.50
|
485,207
127.02% of 50 DAV
50 DAV is 382,000
|
$138.44
-4.12%
|
9/29/2016
|
$46.12
|
PP = $47.82
|
|
MB = $50.21
|
Most Recent Note - 10/16/2017 4:04:24 PM
G - Rallying today near its record high hit on 10/09/17, very extended from any sound base. Earnings +19% on +18% sales revenues for the Jun '17 quarter were below the +25% minimum earnings guideline (C criteria). Its 50 DMA line ($115.41) defines near-term support.
>>> FEATURED STOCK ARTICLE : Holding Ground Stubbornly After Considerable Rally - 10/5/2017 |
View all notes |
Set NEW NOTE alert |
Company Profile |
SEC
News |
Chart |
Request a new note
C
A
S
I |
LMAT
-
NASDAQ
Lemaitre Vascular Inc
Medical-Products
|
$37.09
|
+0.01
0.03% |
$37.45
|
61,456
35.12% of 50 DAV
50 DAV is 175,000
|
$39.29
-5.61%
|
7/28/2017
|
$33.50
|
PP = $33.32
|
|
MB = $34.99
|
Most Recent Note - 10/17/2017 5:21:06 PM
G - Volume totals have been cooling while consolidating above support at its 50 DMA line ($36.53) and prior highs in the $36 area. Violations would raise concerns and trigger technical sell signals.
>>> FEATURED STOCK ARTICLE : Quietly Pulling Back From High After More Volume-Driven Gains - 9/22/2017 |
View all notes |
Set NEW NOTE alert |
Company Profile |
SEC
News |
Chart |
Request a new note
C
A
S
I |
ESNT
-
NYSE
Essent Group Ltd
Finance-MrtgandRel Svc
|
$43.42
|
+0.91
2.14% |
$43.49
|
1,060,760
133.77% of 50 DAV
50 DAV is 793,000
|
$42.64
1.83%
|
10/9/2017
|
$39.75
|
PP = $41.54
|
|
MB = $43.62
|
Most Recent Note - 10/16/2017 11:53:53 AM
Y - Hitting new all-time highs with today's 5th consecutive gain on ever-increasing volume. Prior session's volume total was only +22% above average. Members were reminded - "Gains above the pivot point must have at least +40% above average volume to trigger a proper technical buy signal under the fact-based investment system's rules."
>>> FEATURED STOCK ARTICLE : Perched Within Close Striking Distance of Prior High - 9/29/2017 |
View all notes |
Set NEW NOTE alert |
Company Profile |
SEC
News |
Chart |
Request a new note
C
A
S
I |
FIVE
-
NASDAQ
Five Below Inc
Retail-DiscountandVariety
|
$56.47
|
+1.17
2.12% |
$56.61
|
666,577
75.49% of 50 DAV
50 DAV is 883,000
|
$57.65
-2.05%
|
10/6/2017
|
$57.13
|
PP = $54.23
|
|
MB = $56.94
|
Most Recent Note - 10/17/2017 5:13:58 PM
Y - Posted a 3rd consecutive small gain today with below average volume. Prior highs in the $54 area define initial support to watch on pullbacks.
>>> FEATURED STOCK ARTICLE : Finished Strong With Above Average Volume Behind Big Gain - 10/6/2017 |
View all notes |
Set NEW NOTE alert |
Company Profile |
SEC
News |
Chart |
Request a new note
C
A
S
I |
Symbol/Exchange
Company Name
Industry Group |
PRICE |
CHANGE
(%Change) |
Day High |
Volume
(% DAV)
(% 50 day avg vol) |
52 Wk Hi
% From Hi |
Featured
Date |
Price
Featured |
Pivot Featured |
|
Max Buy |
OLED
-
NASDAQ
Universal Display Corp
Elec-Misc Products
|
$136.95
|
+1.45
1.07% |
$137.05
|
568,406
67.91% of 50 DAV
50 DAV is 837,000
|
$145.30
-5.75%
|
8/31/2017
|
$128.22
|
PP = $127.78
|
|
MB = $134.17
|
Most Recent Note - 10/16/2017 4:27:41 PM
G - Color code is changed to green after a gain with light volume lifted it above its "max buy" level. Its 50 DMA line and recent lows define important near-term support to watch in the $123-124 area.
>>> FEATURED STOCK ARTICLE : Consolidating Near Prior Highs Following Recent Breakout - 9/28/2017 |
View all notes |
Set NEW NOTE alert |
Company Profile |
SEC
News |
Chart |
Request a new note
C
A
S
I |
ANET
-
NYSE
Arista Networks Inc
TELECOMMUNICATIONS - Communication Equipment
|
$190.61
|
+1.82
0.96% |
$190.96
|
355,103
51.17% of 50 DAV
50 DAV is 694,000
|
$196.27
-2.88%
|
8/4/2017
|
$173.31
|
PP = $163.07
|
|
MB = $171.22
|
Most Recent Note - 10/16/2017 4:11:16 PM
G - Pulled back today for a 3rd consecutive small loss on light volume. Still perched near its all-time high, extended from any sound base. Its 50 DMA line ($179.60) and prior highs in the $176 area define important near-term support to watch on pullbacks. Fundamentals remain very strong.
>>> FEATURED STOCK ARTICLE : Perched Near All-Time High, Extended From Any Sound Base - 10/16/2017 |
View all notes |
Set NEW NOTE alert |
Company Profile |
SEC
News |
Chart |
Request a new note
C
A
S
I |
GRUB
-
NYSE
Grubhub Inc
COMPUTER SOFTWARE and SERVICES - Technical and System Software
|
$51.51
|
+0.37
0.72% |
$51.78
|
497,686
29.24% of 50 DAV
50 DAV is 1,702,000
|
$57.61
-10.59%
|
6/21/2017
|
$47.33
|
PP = $46.94
|
|
MB = $49.29
|
Most Recent Note - 10/13/2017 12:26:26 PM
G - Early weakness today nearly tested the recent low ($49.60 on 9/22/17) noted as near-term support above prior highs in the $47 area. A rebound above its 50 DMA line ($54.08) is needed for its outlook to improve. Recently reported earnings +13% on +32% sales revenues for the Jun '17 quarter, below the +25% minimum earnings guideline (C criteria) raising fundamental concerns.
>>> FEATURED STOCK ARTICLE : Gain Above 50-Day Moving Average Line Helped Technical Stance - 10/2/2017 |
View all notes |
Set NEW NOTE alert |
Company Profile |
SEC
News |
Chart |
Request a new note
C
A
S
I |
IBP
-
NYSE
Installed Building Prod
DIVERSIFIED SERVICES - Business/Management Services
|
$65.50
|
+0.30
0.46% |
$66.90
|
149,679
96.57% of 50 DAV
50 DAV is 155,000
|
$67.15
-2.46%
|
9/19/2017
|
$59.15
|
PP = $60.10
|
|
MB = $63.11
|
Most Recent Note - 10/17/2017 5:18:08 PM
G - Still stubbornly holding its ground, extended from prior highs in the $60 area that define initial support above its 50 DMA line ($59.88).
>>> FEATURED STOCK ARTICLE : Building - Maintenance & Service Firm Extended From Latest Base - 10/9/2017 |
View all notes |
Set NEW NOTE alert |
Company Profile |
SEC
News |
Chart |
Request a new note
C
A
S
I |
NCOM
-
NASDAQ
National Commerce Corp
BANKING - Regional - Southeast Banks
|
$42.35
|
-0.45
-1.05% |
$42.95
|
20,819
52.05% of 50 DAV
50 DAV is 40,000
|
$43.80
-3.31%
|
4/25/2017
|
$38.95
|
PP = $40.09
|
|
MB = $42.09
|
Most Recent Note - 10/17/2017 5:25:23 PM
G - Volume totals have been cooling while stubbornly holding its ground near its 52-week high following an impressive spurt of volume-driven gains. Recently reported Jun '17 earnings +23% on +45% sales revenues, below the +25% minimum earnings guideline (C criteria), raising fundamental concerns.
>>> FEATURED STOCK ARTICLE : Holding Ground Following Impressive Volume-Driven Gains - 10/12/2017 |
View all notes |
Set NEW NOTE alert |
Company Profile |
SEC
News |
Chart |
Request a new note
C
A
S
I |
Symbol/Exchange
Company Name
Industry Group |
PRICE |
CHANGE
(%Change) |
Day High |
Volume
(% DAV)
(% 50 day avg vol) |
52 Wk Hi
% From Hi |
Featured
Date |
Price
Featured |
Pivot Featured |
|
Max Buy |
OLLI
-
NASDAQ
Ollie's Bargain Outlet
Retail-DiscountandVariety
|
$44.95
|
-0.35
-0.77% |
$45.40
|
215,899
39.47% of 50 DAV
50 DAV is 547,000
|
$46.90
-4.16%
|
9/8/2017
|
$45.20
|
PP = $46.18
|
|
MB = $48.49
|
Most Recent Note - 10/17/2017 5:22:49 PM
Y - Volume totals have been cooling while hovering near its all-time high and above its 50 DMA line ($44.78). Recent gains above the latest pivot point did not meet the minimum +40% above average volume threshold necessary to trigger a proper new (or add-on) technical buy signal. Confirming volume-driven gains would be a reassuring sign of fresh institutional buying demand. Fundamentals remain strong.
>>> FEATURED STOCK ARTICLE : Quietly Hit New Highs Without Great Volume Conviction - 10/3/2017 |
View all notes |
Set NEW NOTE alert |
Company Profile |
SEC
News |
Chart |
Request a new note
C
A
S
I |
HLI
-
NYSE
Houlihan Lokey Inc Cl A
Finance-Invest Bnk/Bkrs
|
$40.48
|
+0.01
0.02% |
$40.57
|
201,747
92.97% of 50 DAV
50 DAV is 217,000
|
$40.63
-0.37%
|
9/18/2017
|
$37.04
|
PP = $39.78
|
|
MB = $41.77
|
Most Recent Note - 10/16/2017 4:24:42 PM
Y - Matched its all-time high with today's 4th consecutive small gain lacking great volume conviction. Gains above the pivot point must be backed by at least +40% above average volume to trigger a proper new (or add-on) technical buy signal. Subsequent losses below the recent low ($34.41 on 8/18/17) would raise more serious concerns and trigger a technical sell signal.
>>> FEATURED STOCK ARTICLE : Rebounding Toward Prior High and New Pivot Point - 9/27/2017 |
View all notes |
Set NEW NOTE alert |
Company Profile |
SEC
News |
Chart |
Request a new note
C
A
S
I |
ICHR
-
NASDAQ
Ichor Holdings Ltd
ELECTRONICS - Semiconductor Equipment
|
$33.13
|
+0.24
0.73% |
$33.30
|
631,946
93.07% of 50 DAV
50 DAV is 679,000
|
$33.94
-2.39%
|
10/10/2017
|
$29.39
|
PP = $28.36
|
|
MB = $29.78
|
Most Recent Note - 10/16/2017 12:01:33 PM
G - On track for an 8th consecutive gain today, very extended from its prior base. Prior highs in the $29 area define initial support to watch on pullbacks. Disciplined investors avoid chasing stocks extended more than +5% above prior highs and always limit losses by selling any stock that falls more than -7% from their purchase price.
>>> FEATURED STOCK ARTICLE : Semiconductor Equipment Firm Finished Strong After Highlighted - 10/10/2017 |
View all notes |
Set NEW NOTE alert |
Company Profile |
SEC
News |
Chart |
Request a new note
C
A
S
I |
|
|
|
THESE ARE NOT BUY RECOMMENDATIONS!
Comments contained in the body of this report are technical
opinions only. The material herein has been obtained
from sources believed to be reliable and accurate, however,
its accuracy and completeness cannot be guaranteed.
This site is not an investment advisor, hence it does
not endorse or recommend any securities or other investments.
Any recommendation contained in this report may not
be suitable for all investors and it is not to be deemed
an offer or solicitation on our part with respect to
the purchase or sale of any securities. All trademarks,
service marks and trade names appearing in this report
are the property of their respective owners, and are
likewise used for identification purposes only.
This report is a service available
only to active Paid Premium Members.
You may opt-out of receiving report notifications
at any time. Questions or comments may be submitted
by writing to Premium Membership Services 665 S.E. 10 Street, Suite 201 Deerfield Beach, FL 33441-5634 or by calling 1-800-965-8307
or 954-785-1121.
|
|
|